279
Journal of Paleolimnology 27: 279–283, 2002. © 2002 Kluwer Academic Publishers. Printed in the Netherlands.
Note
A new method for visualizing sediment particle size distributions Brandon D. Beierle1, Scott F. Lamoureux1, Jaclyn M. H. Cockburn1 & Ian Spooner2 1 Department of Geography, Queen’s University, Kingston, ON, Canada, K7L 3N6 (E-mail:
[email protected]) 2 Department of Geology, Acadia University, Wolfville, Canada, NS B0P 1X0 Received 21 April 2001; accepted 16 August 2001
Key words: grain size, interpretation, display, methods
Abstract Conventional uses of sediment grain size data as a proxy for paleoenvironmental processes are usually restricted to simple statistical descriptions of the particle size distribution (PSD) (e.g., mean, median and mode). These descriptions provide a generalized indication of down-core changes in depositional conditions and processes, but are not sensitive to non-normal or polymodal distributions. In contrast, surface plots of grain size data allow qualitative interpretation of the characteristics of the entire PSD and thus can provide important insights into depositional processes and changing environmental conditions. This method is especially useful for distinguishing multiple sedimentary processes, which can appear as additional modes within the PSD. In general, this approach can be used on sediments from most depositional environments and at any spatial or temporal resolution. In combination with conventional summary statistics, PSD surface plots increase the potential utility of grain size as a paleoenvironmental proxy for identifying changes in clastic and organic depositional processes in lake sequences.
Introduction The grain size distribution of sedimentary deposits has long been used as an indicator of sediment availability, flow competency and transport mechanism. As with any data array, statistical generalizations are often made to summarize and interpret raw grain size information, although this may be at the cost of losing considerable detail from the original data set. Common statistical summary methods including mean, median and mode, and to a lesser extent standard deviation, skewness, and kurtosis (Inman, 1952; Folk & Ward, 1957) have been used to describe the PSD of sedimentary deposits, with the assumption that one or more of these parameters will accurately describe the key components of a given distribution and facilitate interpretation of the paleodepositional environment (e.g., Friedman, 1961; 1967). Although samples from similar sedimentary environments may cluster when plotted as some combination of moment measures (e.g., Friedman, 1961, 1967; Schock,
1964), PSDs from lakes often encapsulate several sedimentary processes, making statistical parameterization problematic. Additionally, multiple statistical parameters are difficult to use in time series (down-core) data because of the difficulty in plotting them in a readily interpretable manner. Statistical measures also have the problem of being insensitive to distributions that are not lognormal or that exhibit polymodality. In principle, the five most often used numerical samples of a graphical cumulative frequency distribution (grain diameter at 5, 95, 16, 84 and 50%) can be used to completely describe a normally distributed frequency distribution. The use of graphically derived summary statistics arose largely because they were the best way to describe a PSD without the laborious calculation of each statistical parameter for each sample. Because much of the pioneering work in process sedimentology was done in this manner, it became the de facto standard for interpreting grain size information, although the need to examine the whole
280 PSD was clearly recognized (Folk, 1966). However, these five graphical parameters cannot describe the shape of complex PSDs, particularly in the case of polymodal distributions. Visher (1969), Folk & Ward (1957) and many others have suggested that multiple modes in a PSD are indicative of multiple, simultaneous depositional processes. Thus, when inferring process from a PSD, the presence or absence of multiple modes is a key diagnostic of depositional conditions. Moreover, the detection of multiple modes is also essential for evaluating the quality of PSD data, as organic or clay aggregates often manifest as coarse-grained, secondary modes. An alternative method for presenting statistical analyses of a PSD, and one which is considerably more amenable to graphical display of time series data, is to plot particle size as three areas (or lines) representing the proportion of sand, silt and clay. However, the arbitrary nature of the sand, silt and clay boundaries makes process inferences from this type of plot difficult because grain size is by definition a continuous measure (Krumbein, 1934). Using this method of interpretation, a fining-upwards sequence of sediments would create a sequence of ‘jumps’, as the modal grain size crossed the clay-silt and sand-silt boundaries. Furthermore, this method of displaying data is equally insensitive to polymodality as the statistical parameters described above, and supplies relatively little information about the actual shape of the PSD. On the basis of the arguments presented above, we suggest that surface plots of particle size distributions can be used as an improved method to interpret depositional processes in core records. By using surface plots, sediments with polymodal or non-lognormal distributions can be qualitatively interpreted to make more informed interpretations of any quantitative statistical parameters used. A further benefit of the surface plot approach is that it presents the raw grain size data in its entirety, as is the normal practice with other paleoenvironmental proxy data such as diatoms or pollen.
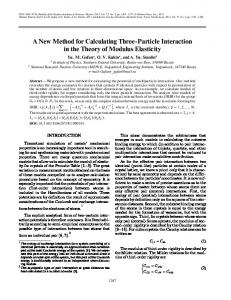
Figure 1. Schematic diagram of the relationship between a PSD plot and raw frequency distribution data obtained from individual sample determinations.
of visualization requires data to be ordered as x, y and z values (grain size, depth/age and weight or volume percent, respectively) and plotted with a graphing program capable of producing surface plots using three axes of numerical data. While common office software packages may be used to generate surface plots, they typically do not allow all three axes to be composed of numerical data (as opposed to category data), and the best results are usually obtained from specialized graphing packages.
Examples PSD series from two lacustrine environments are presented to demonstrate the utility of plotting PSDs as a surface and illustrate some of the shortcomings of using solely summary statistics in inferring sedimentary process. Bear Lake, Nunavut Territory
Methods Analysis and interpretation of time series particle size data is dependent on effectively visualizing the PSD of each sample, as well as down-core trends or variations. Visualization of PSD data as a three-dimensional surface plot preserves sample-level detail, while also providing down-core continuity (Figure 1). This method
PSD data provide new insights regarding the structure of varved sediments from glacier-fed Bear Lake, Devon Island (75º 29’ N, 85º 10’ W). In this example from a mid-proximal location in the lake, grain size data were obtained at subannual (2.5 mm) resolution from two rhythmites. Previous research has demonstrated that these units represent annually deposited layers, and as such are likely varves (Lamoureux, 1999).
281 Both varves show a similar sequence of carbonaterich silt overlain by clay-sized particles. In each case, the coarser silt appears to have a nearly constant modal size (35 µm), which could indicate the persistent transport competency of interflows in this area of the lake (Figure 2). The PSD in the upper varve gradually broadens during the course of the year, forming a tail into the fine range that indicates the progressive deposition of fine silt and clay from inputs earlier in the season. The abrupt transition from the silt mode to the clay mode (3 µm) is also especially clear and indicates the end of the active hydrological season (Figure 2). The mean grain size and other summary statistics from these samples reveal this information in only a fragmentary manner, from which reconstructing the actual change in PSD would be difficult. Additionally, the gradual broadening of the PSD through the season is only apparent from the surface plot, as the changes are too subtle to be detected in either skewness or standard deviation. The lower varve is comprised of two prominent subannual units (Figure 2). The progressive addition of finer-grained sediments in the lower unit of this varve reveals a distinctive mid-season decrease in river transport competence, in contrast to the overlying unit, which contains a clay cap indicative of the cessation of fluvial transport during the winter (Smith & Ashley,
1985). In this manner, subannual rhythmites may be qualitatively distinguished and differentiated from varves. Although this information can be inferred from the accompanying statistics, the surface plot effectively summarizes the nature of the PSD changes through each year. Sedimentological differences between summer silt deposits and the winter clay cap are clear using both types of presentation. However, more subtle changes associated with the subannual rhythmite in the lower varve (Figure 2) are not apparent from the statistics. Halfway Lake, Yukon Territory Halfway Lake (63° 48’ N, 135° 48’ W) is a closed basin lake with sediments composed primarily of autochthonous gyttja and a small component of clay and silt sized clastic particles. The coring site, in the centre of the lake, is 15 m deep and ~1 km from the nearest shore. Clastic sediments could be transported to the coring site by several mechanisms, including slope wash, wave resuspension or eolian deposition (either directly to the lake surface or deposited on the winter ice cover with deposition on the lake floor during the spring melt). Particle size analysis was conducted on the clastic portion of the sediments, after organic matter had been
Figure 2. Lithostratigraphic log, PSD plot, and summary statistics for two proximal varves from Bear Lake, Devon Island, Nunavut. Please refer to the text for discussion.
282
Figure 3. PSD plot and summary statistical measures for a sediment core from Halfway Lake, Yukon.
removed by oxidation with H2O2. The PSD reveals a major shift at the 120 cm interval, characterized by the appearance of a second, coarser mode, which persists through the upper 120 cm of the core (Figure 3) and is especially apparent between 120 and 50 cm depth. The appearance of this second mode could have resulted from changes in lake level (i.e., decreased wave base or increased proximity to the source of the sediment) or the initiation of a second depositional mechanism. Decreased lake level should have resulted in coarsening of the existing mode, rather then the development of a new one, suggesting the secondary mode was a product of a different sedimentary process. The dominance of the second mode above 120 cm is reflected in modal grain size and standard deviation, however the bimodal nature of this distribution, which is key in eliminating changes in lake level as a cause, could not have been deduced from the summary statistics alone (Figure 3).
Conclusion Statistical generalizations of particle size distributions from lacustrine sediments often do not adequately describe important characteristics of the distribution, and thus may not always be the best tool to interpret de-
positional processes. The use of multiple statistical descriptors to summarize a PSD may produce results that can be difficult to interpret, with six or more parameters for each sample (e.g., Figures 3 and 4). This problem is compounded when the PSD data are in a time series, and interpretation requires examining not only each sample, but also time transgressive trends. By displaying PSD measurements as a surface plot, the data can be interpreted qualitatively, with full integration of a variety of descriptive statistics and down-core variability. This combination of qualitative and quantitative analysis of lake sediments promises to further the use of grain size data as a proxy indicator for past depositional processes and environmental change.
Acknowledgements Research was supported by Natural Science and Engineering Research Council of Canada (NSERC) and Queen’s University. Infrastructure was acquired with the support of the Canada Foundation for Innovation (CFI) and Ontario Innovation Trust (OIT). Northern Science Training Program (NSTP) provided additional financial support for fieldwork for BDB. Polar Continental Shelf Project, Natural Resources Canada, pro-
283 vided logistical support for SFL. We thank several participants at the 8th International Paleolimnology Symposium, held in Kingston, ON, 20–25 August, 2000 for stimulating discussions on this subject. Constructive comments by three anonymous reviewers improved the manuscript.
References Folk, R. L., 1966. A review of grain-size parameters. Sedimentology 6: 73–93. Folk, R. L. & W. C. Ward, 1957. Brazos River bar, a study in the significance of grain-size parameters. J. Sed. Pet. 27: 3–27.
Friedman, G. M., 1961. Distinction between dune, beach and river sands from their textural characteristics. J. Sed. Pet. 31: 514–529. Friedman, G. M., 1967. Dynamic processes and statistical parameters compared for size frequency distribution of beach and river sands. J. Sed. Pet. 37: 327–354. Inman, D. L., 1952. Measures for describing the size distribution of sediments. J. Sed. Pet. 22: 125–145. Lamoureux, S. F., 1999. Catchment and lake controls over the formation of varves in monomictic Nicolay Lake, Cornwall Island, Nunavut. Can. J. Earth Sci. 36: 1533–1546. Schock, R. N., 1964. Note on the texture of some Pleistocene sands. J. Sed. Pet., 35: 500–503. Smith, N. D. & G. M. Ashley, 1985. Proglacial lacustrine environment. In G. M. Ashley, J. Shaw & N. D. Smith (eds), Glacial Sedimentary Environments. SEPM Short Course, 16: 135–215. Visher, G. S., 1969. Grain size distributions and depositional processes. J. Sed. Pet. 39: 1074–1106.
284