particle will estimate nearly equivalent size reflecting .... Table 1: General information for all samples about sediment type, specific gravity and construction ... be entrained compared to that necessary for the same size ..... systems via gully-pots.
American Journal of Environmental Sciences 6 (4): 316-323, 2010 ISSN 1553-345X © 2010 Science Publications
Representative Particle Size of Sediment in Storm Sewer Inlets Jaber Almedeij, Ebtehal Ahmad and Jasem Alhumoud Department of Civil Engineering, Kuwait University, P.O. Box 5969, Safat 13060, Kuwait Abstract: Problem statement: The aim of this study was examine the representative particle size of noncohesive sediment samples collected from different storm sewer inlets in residential catchments within Kuwait. Approach: A number of 25 sediment samples were collected from storm sewer inlets located in five residential areas in Kuwait: Bayan, Al-Nuzha, Al-Feiha, Al-Andalos and Al-Rumaithya. All the impervious areas for the selected sites are hydraulically connected to the drainage system, including the roofs for houses which are piped to the roads with gutters and thus have pronounced influence on catchment hydrology. Results: It was found that the sample median and mean particle sizes vary locally within each site and spatially compared to others, while the mode is invariant for most of the cases. This result suggests that the mode particle size is more stable in terms of magnitude than the median and mean and may constitute a robust estimator for sediment sizes reflecting the similarity found in watershed characteristics. Conclusion/Recommendations: This is the first such study conducted in Kuwait on sediment samples collected from five residential storm sewer inlets were employed to examine the average particle size readily available for transportation into the conduit. Key words: Bimodal and unimodal, mode, robust estimator, sieve analysis loss of hydraulic capacity causes, in turn, surcharged water flow, under which sewers run with positive pressure resulting in potential flooding of roads, surfaces, gardens, basements and other residential properties (Butler and Davies, 2004). Indications of these problems have been noticed during the rainfall events at many drainage locations. This is the case also for the storm sewers in the residential areas of Kuwait, where rainstorms are infrequent and have short duration, but are torrential. Numerous storm sewers suffered from loss of hydraulic capacity and blockage and the existing drainage system has frequently encountered ponding, which tends to increase the water width over the road pavement (Almedeij et al., 2006a). Observations from field studies reported by the ministry of public works in Kuwait indicate sediment deposits mainly of noncohesive properties such as sand and gravel. Knowledge of the average size of these deposits is important to provide basic information for the development of self cleansing storm sewers. To grasp knowledge regarding the average sediment size in sewers, two quite distinct issues arise: the source of sediment supply from which a sample is collected and the most representative average particle to consider for the sample size distribution. The source of sediment entered into storm sewers is closely related to the characteristics of the surrounded watershed surface.
INTRODUCTION An important feature of sediment deposits in storm sewers is the complex pattern of the surface material with varying flow discharges. The deposited bed material is usually well represented by either a unimodal or bimodal grain size distribution. In the latter case, the variation of the makeup of the surface material with flow discharges complicates the sediment transport rate estimation (Roberts et al., 1988). The presence of cohesive sediment such as clay or smaller sizes in storm sewers complicates the picture even further. The cohesive material is resistant to the initial motion and it may be cemented and become permanent if not disturbed for a long period, thereby accounting for the loss of hydraulic capacity of the sewer (Zipparro and Hasen, 1992; Delleur, 2001). Sediment deposits in storm sewers can have adverse impact on the environment and urban drainage systems. For example, the deposited sediment materials become polluted if they remain intact for a long period of time acting as pollution store or generator and can be washed out by the first flash into receiving water (Crabtree et al., 1995; Fan et al., 2003; Artina et al., 2007). Hydraulic problems associated with sediment deposits may be loss of pipeline capacity due to reduction in flow cross section and increase in bed roughness (Mark et al., 1995; May et al., 1996). The
Corresponding Author: Jaber Almedeij, Department of Civil Engineering, Kuwait University, P.O. Box 5969, Safat 13060, Kuwait
316
Am. J. Environ. Sci., 6 (4): 316-323, 2010 depth for the inlets varies from 1-1.3 m and the depth below the pipe invert, the sump, from 15-20 cm. As was mentioned previously, the choice of the inlet as the main input location to collect sediment samples for a sewer system was considered here to provide information about the grain size characteristics readily available for transportation into the conduit. In Kuwait, rainfall events are also rare. Hence, sampling directly from the bottom of the inlet is more efficient in terms of time compared to other techniques including that based on sitting a box trap below the inlet and observing sediment build up during rainfall. This technique though provides information about the characteristics of sediment deposited from a relatively long period of time and the results should be interpreted according to that. An amount of water was found inside the inlets, mostly caused by onsite watering activities and it was necessary to drain it out before starting sediment collection. A pump was used to drain carefully that water. Only a little amount of water was kept on top to a depth of ~1 cm to protect the settled finer grains from being sucked by the pump. The wet samples were then collected and placed in plastic containers, which were carefully sealed and labelled. A sample from each area was chosen to be from an inlet near a civil construction study, in order to examine any effect of this activity on sediment size characteristics. To test specifically the influence of workers, the construction materials were chosen to be located downstream of the inlets so that to reduce the chance of sediment input by flowing water due to human-induced activities.
Owing to the reason that the source of sediment is highly interrelated with factors such as rainfall intensity, wind speed and direction, traffic movement, street sweeping methods, impervious coverage and the presence of source contamination such as construction works, it is impractical to collect samples directly from the watershed surface; rather, the storm sewer inlet can possibly be used to examine the sediment sizes readily available for transportation into the conduit (Ahmad, 2007; Deletic et al., 2000). The second issue is a matter of estimating a robust average particle for a given sediment sample distribution. Robust average particle means that minor departure of sediment sample from original distribution will not seriously affect its size. Accordingly, if sediment samples were collected from different locations but with similar watershed characteristics, then by definition a robust average particle will estimate nearly equivalent size reflecting the existing similarity in watershed characteristics. The aim of this study is to investigate the representative particle size of noncohesive sediment entering residential storm sewer inlets in Kuwait. This study will select sites with similar catchment size and type and sewer inlet geometry and upstream activities to exclude the variation of watershed characteristics and thus identify a robust average particle for the samples. Initially, the study reports the sampling method and laboratory study undertaken to collect, test and classify sediment sizes. Then the results are analyzed and discussed. MATERIALS AND METHODS A number of 25 sediment samples were collected from storm sewer inlets located in five residential areas in Kuwait: Bayan, Al-Nuzha, Al-Feiha, Al-Andalos and Al-Rumaithya. The sampling was conducted after a wet season, in April 2006, about 14 days from the last rainfall event and 200 days from the annual sewer cleaning conducted by the ministry of public works. The chosen inlet for each site serves a relatively small catchment area of about 0.25~0.26 ha with a flat topography of a mean slope ~0.4% and an imperviousness of about 75~79%, which is composed of roads, car parks and roofs for houses. All the impervious areas for the selected sites are hydraulically connected to the drainage system, including the roofs for houses which are piped to the roads with gutters and thus have pronounced influence on catchment hydrology. The sediment samples were collected from storm sewer inlets with no upstream conduits and of single grate type located on grade. The size of inlet opening is 55 cm long and 45 cm wide. The structure
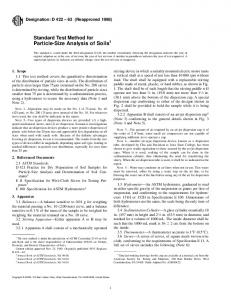
Laboratory testing: Sieve analysis: Sieve analysis was used to determine the grain size distribution for the 25 sediment samples. First, the samples were spread on a drying tray and then placed inside an oven at 105°C until a constant weight reached. Samples were broken up into individual particles using a mortar and rubber-tipped pestle. Samples were mixed thoroughly to have homogeneity and materials like plastics and glasses were removed. A representative sample was taken by quartering in a splitter. That sample was weighted and placed in a sieve shaker arranged in a descending order of aperture sizes. The sieve sizes used are 16, 10, 5, 2.36, 1.18, 0.6, 0.3, 0.15, 0.075 mm and a pan at the bottom. Those sieve classes were considered here to examine the characteristics of no cohesive sediment materials, while finer particle sizes retained in the pan such as the very fine sand, silt and clay were excluded. The sieves were vibrated for a period of 10-15 min. The sediment 317
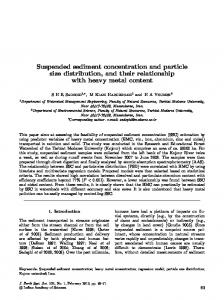
Am. J. Environ. Sci., 6 (4): 316-323, 2010 amount retained on each sieve was then weighted again. Percentages of sediment retained on and passed from each sieve were calculated. With these data, the grainsize distribution, which shows the percentage retained against particle diameter and of cumulative grain-size distribution, showing the percentage passing against diameter, were drawn on a semi-logarithmic study. Figure 1 shows the cumulative grain-size distribution for the examined samples.
RESULTS AND DISCUSSION The results of the sieve analysis for the 25 sediment samples are summarized in Table 1. It is seen that 13 sediment samples have bimodal grain size distributions and the remainders are unimodal. The specific gravity for the samples ranges from 2-2.66, with an overall mean of 2.43. As for natural sediment, a specific gravity of 2.65 is more common. The smaller mean value obtained for the samples resulted from the content of lighter organic materials such as plant leaves and animal litters, washed by weather currents during wet or dry periods. While construction works can have high influence on the sediment characteristics of storm sewer inlets, it is not the case here for most of the relevant samples. There is no apparent evidence from Table 1 and the forthcoming analyses suggesting systematic changes in sediment properties from this activity. The reason can be related to the strict regulations imposed by the government to prevent workers from accidentally disposing construction materials like coarse or fine aggregate particles into storm sewer inlets. An exception is for the sample of Al-Feiha S3 containing higher proportion of coarse particles (Fig. 2).
Specific gravity: Specific gravity was estimated as the ratio of sediment density to water density at a reference temperature of 4°C. The water density at this temperature is considered ~1000 kg m−3 and the sediment density was estimated for dried samples passing through a sieve opening of 2.36 mm. The latter was obtained by dividing the sediment sample mass by its volume, measured using an electronic balance and a volumetric flask of 500 mL capacity, respectively.
(a)
(b)
(c)
(d)
(e)
Fig. 1: Cumulative samples
grain-size
distribution
for
Fig. 2: Sediment samples collected from storm sewer inlets near civil construction works (a) Bayan S5 (b) Al-Nuzha S1 (c) Al-Feiha S3 (d) AlRumaithya S4
all 318
Am. J. Environ. Sci., 6 (4): 316-323, 2010 Table 1: General information for all samples about sediment type, specific gravity and construction study Sample Sediment type Specific gravity Bayan S1 Bimodal 2.48 S2 Unimodal 2.64 S3 Unimodal 2.38 S4 Unimodal 2.44 S5 Bimodal 2.59 Al-Nuzha S1 Bimodal 2.57 S2 Bimodal 2.40 S3 Bimodal 2.49 S4 Bimodal 2.41 S5 Unimodal 2.00 Al-Feiha S1 Unimodal 2.34 S2 Unimodal 2.31 S3 Bimodal 2.66 S4 Unimodal 2.45 S5 Unimodal 2.42 Al-Andalos S1 Unimodal 2.56 S2 Bimodal 2.29 S3 Bimodal 2.46 S4 Bimodal 2.46 S5 Unimodal 2.43 Al-Rumaithya S1 Unimodal 2.47 S2 Bimodal 2.17 S3 Unimodal 2.65 S4 Bimodal 2.20 S5 Bimodal 2.46
Construction work
B*
No No No No Yes (7 m away)
1.93 2.27
Yes (3.5 m away) No No No No
1.86 2.24 3.86 1.98 -
No No Yes (5 m away) No No
2.45 -
No No No No Yes (6 m away)
2.29 3.42 3.95 -
No No No Yes (4.5 m away) No
2.25 2.16 2.63
The grain size analysis for the sediment samples can be separated according to the material types of unimodal and bimodal. Figure 3 shows an example for the grain size distribution of these two materials. Such classification becomes important in storm sewers because of the difference in dynamic transport process of unimodal and bimodal materials. In the latter case, the movement of one mode becomes influenced by the other. For certain applications, the material represented by the finer mode tends to hide in the crevices created by the coarser one and requires a higher shear stress to be entrained compared to that necessary for the same size when available as unimodal. In contrast, the coarser grain size becomes more exposed to the hydrodynamic forces and can be moved by shear stresses lower than that necessary for the same size when available as unmoral. The degree of sediment bimodality can be quantified according to the criterion proposed by Smith et al. (1997). For an effective degree, the bimodal surface pattern can complicate the dynamic transport process of grains in storm sewer systems in a manner similar to that mentioned earlier; however, if the bimodality degree is ineffective, then the sample would behave as if a unimodal material. The bimodality degree for this criterion is determined from:
Fig. 3: Typical unimodal and bimodal sediment distributions showing the location for the mode grain size. The unimodal distribution is for sample Al-Rumaithya S3 with a mode of 0.3 mm and the bimodal is for Al-Nuzha S2 with finer and coarser modes of 0.3 mm and 4.5 mm 319
Am. J. Environ. Sci., 6 (4): 316-323, 2010 B* = | ∅ 2 − ∅1 | (f md2 / f md1 )
Table 2: Average size and standard deviation characteristics for unimodal sediment samples Unimodal sample dm (mm) dmd (mm) d50 (mm) σ (mm) Bayan S2 0.43 0.3 0.13 0.82 S3 0.57 0.3 0.30 0.93 S4 0.61 0.3 0.25 1.04 Al-Nuzha S5 0.8 0.3 0.38 1.18 Al-Feiha S1 0.67 0.3 0.23 0.84 S2 0.64 0.3 0.25 0.77 S4 1.40 0.3 0.50 2.26 S5 0.95 0.3 0.30 1.31 Al-Andalos S1 0.73 0.3 0.35 1.23 S5 1.54 0.3 0.32 3.66 Al-Rumaithya S1 1.14 0.3 0.52 1.78 S3 0.48 0.3 0.45 0.59
Where: B* = Bimodality parameter ∅ = Mode grain size in phi units, ∅ = log2dmd The subscripts 1 and 2 in fad refer to the primary and secondary modes in terms of sediment proportion of sample by weight, respectively; if the two modes are of exactly equal amplitudes, then subscript 1 refers to the coarser one. A reference value suggested by this criterion is equal to B* = 1.7. Above that, the bimodality is considered effective and below that it is treated as unimodal. Table 1 shows that all the bimodal samples have B* values greater than 1.7 suggesting effective bimodality degree. The grain size characteristics for the unimodal samples are provided in Table 2. This Table 2 classifies the information in terms of average size parameters, which are the median dso, mean dm and mode dmd and of size variability, which is the standard deviation σ. The values of dmd and dso were estimated from the grain-size and cumulative grain-size distributions, respectively; while dm and σ were determined mathematically from the expressions:
∑ = ∑ j
dm
Typically, the median is the particle diameter most widely adopted in the literature to represent a sediment mixture and to estimate bedload or suspended load transport rates. This parameter is a suitable choice for a lognormally distributed material as it coincides with the geometric mean and mode sizes. Nevertheless, the grain size distribution for many deposits is not lognormal; rather, it tends to be skewed (Kondolf and Wolman, 1993). Thus, the median may not be the most appropriate parameter to describe the grain size distribution for many deposits. The median can also become sensitive to the shape of the data set distribution and thus it often does not depict the typical outcome. This is especially evident in bimodal materials when the median falls in the gap between two significant modes and, therefore, represents a size class containing a small percentage of the overall sediment. However, attention is drawn here to the mode dmd as being especially useful in studying mixed sources of materials and has a great significance in deciphering origin. The mode is a less bias statistical parameter as by definition it has always the highest percentage of particles by weight and covers the largest portion of the bed surface area compared to any other size class. Relevant applications evaluating the efficiency of the mode parameter in the estimation of bedload transport rates is presented in details by Almedeij and Diplas (2003) and Almedeij et al. (2006b) for the cases of unimodal and bimodal materials, respectively. As can be seen in Table 2, the average size parameters for the unimodal samples suggest the materials being in the sand range. It is also seen that the median grain size varies locally within the site and spatially compared to other locations. For example, two median grain sizes in Al-Feiha of 0.23 and 0.5 mm are ~118% different. These values vary spatially if compared to other areas like Al-Nuzha, with a median of 0.38 mm.
f di
i =1 i j
f
i =1 i
and: ∑ j f (d − d ) 2 i i m σ = i =1 j ( f ) ∑ i i =1
1/ 2
Where: di = Mean size of ith class fi = Percentage of sample by weight of ith class j = Total number of classes The robustness of the average particle size varies according to the nature of sediment data. It is well documented that the mean parameter dm, in general, does not resist the minor departure of sediment data from original grain size distribution. The median dso, which has a value that lies in the middle of the data when arranged in ascending order, is a robust estimator if the weight of each particle size is equivalent, since its value will not change as the magnitude of one size far away in the distribution changes. However, if the weight of sizes is different, which is the case for sediment deposits, then the median becomes unstable for minor departure from original data. 320
Am. J. Environ. Sci., 6 (4): 316-323, 2010 Table 3: Size characteristics of sand and gravel fractions for bimodal sediment samples Fine fraction ---------------------------------------------------------------------dm dmd d50 σ fmd Bimodal sample (mm) (mm) (mm) (mm) (%) Bayan S1 0.34 0.30 0.18 0.29 21.0 S5 0.47 0.31 0.25 0.34 23.0 Al-Nuzha S1 0.46 0.30 0.25 0.35 24.0 S2 0.56 0.30 0.30 0.37 15.5 S3 0.48 0.30 0.26 0.34 19.5 S4 0.44 0.30 0.25 0.32 23.0 Al-Feiha S3 0.47 0.30 0.25 0.33 15.8 Al-Andalos S2 0.50 0.32 0.27 0.36 22.5 S3 0.38 0.30 0.20 0.32 19.0 S4 0.43 0.30 0.22 0.35 16.0 Al-Rumaithya S2 0.46 0.30 0.25 0.36 15.5 S4 0.41 0.30 0.20 0.35 8.0 S5 0.42 0.30 0.20 0.36 18.5
Coarse fraction --------------------------------------------------------------------dm dmd d50 σ fmd (mm) (mm) (mm) (mm) (%) 6.03 7.11
5.0 5.0
3.8 3.6
2.86 4.90
11.0 13.5
6.06 4.77 6.86 4.91
5.0 4.5 5.0 5.0
3.1 2.8 3.5 3.2
4.35 3.09 4.67 2.42
11.0 27.0 20.5 11.0
8.35
10.0
6.1
3.48
33.0
5.19 5.57 6.49
5.0 5.0 5.0
3.0 4.0 3.5
3.33 2.26 3.50
13.0 16.0 18.0
5.85 9.59 4.08
5.0 6.0 5.0
2.4 6.5 2.8
3.46 4.92 1.62
28.0 16.0 12.0
detect the significant influence of one factor contaminating the source of sediment supply. The present environment of deposition affects the relative proportion of the mode size in the sample distribution. The mode size of ~0.3 mm is significant in all the data sets of unimodal and bimodal sediment. This is not a surprising result, as smaller grains are transported from the catchment surface into and then out of, the inlets effortlessly under different water flow conditions and thus may reflect more closely the similarity in watershed properties for the chosen areas. The presence of the mode of the coarser fraction in bimodal samples is also interesting. The origin of the coarser fraction is difficult to evaluate from the available source of supply because of many prevailing factors that can have direct influence on the pattern of onsite sediment deposition. For example, larger grains may be transported from the source of supply in different proportions based on street sweeping mechanical or manual, outdoor watering activities, traffic movement over or away from unpaved areas and the degree of exposure of unpaved areas to wind currents. Owing to the expected preferential retention, the proportion of larger grains may increase for a relevant inlet and become even higher than that found in the watershed surface. The stability of the mode parameter for each sediment sample can be compared to the stability of the median and mean using the ratio d / d ; where d is arithmetic mean for the parameter (median, mean, or mode), n d = (∑ k =1 d k ) / n;d k is parameter size of kth sample
However, it is interesting to note that the mode grain size is invariant for the samples collected, equal to 0.3 mm. This suggests that the mode parameter is more stable than the median and mean in terms of magnitude, as it is insensitive to the motion of smaller particles and thus can be estimated in field more accurately. Owing to the similarity in watershed and sewer inlet characteristics and upstream activities, the mode for those samples is considered more representative than the median and mean. For the bimodal samples, the size characteristics are summarized in Table 3. Here, the information are classified in terms of finer and coarser sediment fractions. As can be seen, the size of the finer fraction is within the sand range and the coarser fraction within the gravel. Similar to unimodal data, the bimodal samples possess mode grain sizes that are nearly invariant. All the samples have mode of finer fraction equal to ~0.3 mm, while most of them have mode of coarser fraction equal to 5 mm. The difference is found in sample Al-Feiha S3 possessing a coarser mode of 10 mm. The percentage of sample by weight of this mode size fmd is equal to 33%. As it was mentioned earlier, this sample had been collected from a site near a civil construction study, which is about 5 m distant and the results are possibly interpreted according to the influence of this activity as the workers can accidentally dispose large material sizes into the inlet. If this size class was removed from the sample, then the sediment distribution would still be bimodal but with a coarser mode of 5 mm coinciding with the other results. The implication here is that the mode size can be useful to
number and n is total number of samples considered. 321
Am. J. Environ. Sci., 6 (4): 316-323, 2010 variability with statistical variance of σ2 = 0.0002 compared to that for the mean 0.245 and median 0.113. The same analysis but for the coarser fractions of bimodal samples n = 13 is presented in Fig. 5, showing how much influence the sample of Al-Feiha S3 has on the average size parameter stability. The estimated variance of the mode ratio d / d with sample Al-Feiha S3 included, of a coarser mode of 10 mm, is equal to σ2 = 0.068 (Fig. 5a), compared to that for the mean 0.059 and median 0.11. Treating this sample as an outlier (Fig. 5b) and thus deleting it from the analysis improved the variance considerably, with a variability for the mode equal to σ2 = 0.0044 compared to that for the mean 0.056 and median 0.088.
Fig. 4: Comparison of the ratio d / d calculated for the median, mean and mode particle sizes for total sediment samples n = 25. For bimodal samples only the finer sediment fraction is considered
CONCLUSION Sediment samples collected from five residential storm sewer inlets were employed to examine the average particle size readily available for transportation into the conduit. The specific gravity for the samples has an overall mean of 2.43. Despite the similarity in catchment size and type and sewer inlet geometry and upstream activities, it has been found that the sample median and mean grain sizes vary locally within the residential site and spatially compared to others, while the mode size is more stable reflecting the similarity found in watershed characteristics. The single mode for the unimodal samples is equal to 0.3 mm and the finer and coarser modes for most of the bimodal samples are 0.3 and 5 mm. The degree of bimodality for the relevant samples is effective. There is no apparent evidence showing influence of civil construction works on sediment size characteristics except for sample Al-Feiha S3. The reason may be related to the strict regulations imposed by the government to prevent workers from accidentally disposing construction materials into storm sewer inlets. This sample demonstrated a possible implication of the mode parameter in detecting the significant influence of one factor contaminating the source of sediment supply to storm sewers.
(a)
(b)
Fig. 5: Comparison of the ratio d / d calculated for the median, mean and mode particle sizes for the coarser fractions of bimodal sediment: (a) total number of sediment samples n = 13; (b) total number of sediment samples n = 12 by excluding Al-Feiha S3
ACKNOWLEDGEMENT The authors would like to thank the distinguished reviewers of the journal for their useful comments and suggestions. REFERENCES
Figure 4 shows the results of the sediment samples with n = 25. Where it can be observed that only the finer fractions of bimodal samples are considered. Apparently, the mode ratio d / d has very small
Almedeij, J. and P. Diplas, 2003. Bedload transport in gravel-bed streams with unimodal sediment. J. Hydraul. Eng., 129: 896-904. 322
Am. J. Environ. Sci., 6 (4): 316-323, 2010 Fan, C.Y., R. Field and F. Lai, 2003. Sewer-sediment control: Overview of an environmental protection agency wet-weather flow research program. J. Hydraul. Eng., 129: 253-259. Kondolf, G.M. and M.G. Wolman, 1993. The sizes of salmonid spawning gravels. Water Resour. Res., 29: 2275-2285. Mark, O., C. Appelgren and T. Larsen, 1995. Principles and approaches for numerical modeling of sediment transport in sewers. Water Sci. Technol., 31: 107-115. May, R.W.P., J.C. Ackers, D. Butler and S. John, 1996. Development of design methodology for selfcleansing sewers. Water Sci. Technol., 33: 195-205. Roberts, A.H., J.B. Ellis and W.B. Whalley, 1988. The progressive alteration of fine sediment along an urban storm drain. Water Res., 22: 775-781. Smith, G.H.S., A.P. Nicholas and R.I. Ferguson, 1997. Measuring and defining bimodal sediments: Problems and implications. Water Resour. Res., 33: 1179-1185. Zipparro, V.J. and H. Hasen, 1992. Davis’s Handbook of Applied Hydraulics. 4th Edn., McGraw-Hill Company, New York, USA., ISBN: 10: 0070730024, pp: 1056.
Almedeij, J., A. Alsulaili and J. Alhomoud, 2006a. Assessment of grate sag inlets in a residential area based on return period and clogging factor. J. Environ. Manage., 79: 38-42. Almedeij, J., P. Diplas and F. Al-Ruwaih, 2006b. Approach to separate sand from gravel for bed-load transport calculations in streams with bimodal sediment. J. Hydraul. Eng., 132: 1176-1185. Ahmad, E., 2007. Sediment size characteristics in residential storm sewer inlets. M.S. Thesis, Kuwait University. Artina, S., A. Bolognesi, T. Liserra and A. Maglionico, 2007. Simulation of a storm sewer network in industrial area: Comparison between models calibrated through experimental data. Environ. Model. Software, 22: 1221-1228. Butler, D. and J.W. Davies, 2004. Urban Drainage. 2nd Edn., Spon Press, UK., London, ISBN: 10: 0415306078, pp: 568. Crabtree, R.W., R. Ashley and R. Gent, 1995. Mousetrap: Modeling of real sewer sediment characteristics and attached pollutants. Water Sci. Technol., 31: 43-50. Deletic, A., R. Ashley and D. Rest, 2000. Modeling input of fine granular sediment into drainage systems via gully-pots. Water Res., 34: 3836-3844. Delleur, J.W., 2001. New results and research needs on sediment movement in urban drainage. J. Water Resour. Manage., 127: 186-193.
323