A New Ventricular Fibrillation Detection Algorithm for Automated External Defibrillators Anton Amann1 , Robert Tratnig2 , Karl Unterkofler2 1
2
Innsbruck Medical University and ETH Z¨urich Research Center for Process and Product Engineering, FH-Vorarlberg, Austria Abstract
A pivotal component in AEDs is the detection of ventricular fibrillation by means of appropriate detection algorithms. In scientific literature there exists a wide variety of methods and ideas for handling this task. These algorithms should have a high detection quality, be easily implementable, and work in real time in an AED. Testing of these algorithms should be done by using a large amount of annotated data under equal conditions. For our investigation we simulated a continuous analysis by selecting the data in steps of one second without any preselection. We used the BIH-MIT arrhythmia, the CU, and the AHA database. For a new ventricular fibrillation detection algorithm we calculated the sensitivity, specificity, and the area under its receiver operating characteristic curve (ROC) and compared these values with the results from an earlier investigation of several different ventricular fibrillation detection algorithms. This new algorithm is based on the Hilbert transform and outperforms all other investigated algorithms.
1.
Introduction
Sudden cardiac arrest is a major public health problem and one of the leading causes of mortality in the western world. In most cases, the mechanism of onset is a ventricular tachycardia that rapidly progresses to ventricular fibrillation. Approximately one third of these patients could survive with the timely employment of a defibrillator. Besides manual defibrillation by an emergency paramedic in recent years, bystander defibrillation with automatic external defibrillators (AEDs) has also been recommended for resuscitation. These devices analyze the electrocardiogram (ECG) of the patient and recognize whether a shock should be delivered or not. Hence it is of vital importance that the ECG analysis algorithms used by AEDs differentiate well between VF and a stable but fast sinus rhythm (SR). To gain insight into the quality of an algorithm for ECG
analysis, it is essential to test the algorithm with a large amount of data, which has already been annotated by qualified cardiologists. Commonly used annotated databases are Boston’s Beth Israel Hospital and MIT arrhythmia database (BIHMIT), the Creighton University ventricular tachyarrhythmia database (CU), and the American Heart Association database (AHA). We used the complete BIH-MIT arrhythmia and CU database, and the files 7001 - 8210 of the AHA database [1], [2], [3]. In this paper we develop a new ventricular fibrillation detection algorithm and compare its performance with the results from an earlier evaluation [4] by calculating the area under the ROC curve. We call this value “integrated receiver operating characteristic”, and denote it by IROC. The ROC curve is given by plotting the sensitivity in dependence of (1−specificity), where different points of the plot are obtained by varying the critical threshold parameter in the decision stage of the algorithm.
2.
Methods: The Hilbert Transform Algorithm
This algorithm (HILB) is based on a method which is used in analyzing nonlinear signals. From a real signal x(t) a complex valued signal z(t) is obtained by z(t) = x(t) + i xH (t), xH (t) being the Hilbert transform of x(t). Then z(t) = r(t) exp(i ϕ(t)). Usually the Hilbert transform is used to compute this phase ϕ(t). Hence a two dimensional phase-space plot is generated in the following way: On the x-axis we plot the ECG signal x(t) and on the yaxis we plot the Hilbert transform xH (t) of the ECG signal x(t). The Hilbert transform xH (t) of a signal x(t) is defined by Z ∞ x(τ ) 1 dτ, (1) xH (t) = P.V. π −∞ t − τ where P.V. means that the integral is taken in the sense of the Cauchy principal value. From Equation (1) one can
and the corresponding points in the phase-space plot. 40 35 30 25 x(t) / a.u.
read off that the Hilbert transform can be considered as 1 the convolution of the functions x(t) and πt . Due to the d properties of convolution, the Fourier transform X H (ω) of xH (t) is the product of the Fourier transforms of x(t) and 1 d b πt . Thus for ω > 0, XH (ω) = −iX(ω) and for ω < 0, d b XH (ω) = iX(ω). This means that the Hilbert transform can be realized by an ideal filter whose amplitude response is unity and phase response is a constant π2 lag at all frequencies ω > 0. In our algorithm, we first down-sample the ECG data to a frequency of 50 Hz, since we do not expect any relevant information in the frequency region above this value. In addition a reduced data set speeds up the calculation. We observe that phase-space plots of random signals fill the x-y–plane in a more or less irregular way. On the other hand, phase-space plots of normal ECG signals always show circle like curves. Figure 1 shows a typical SR signal from the CU database and the corresponding points in the phase-space plot.
20 15 10 5 0 410
412
414
416
418
20
30
40
t/s
40
35
30 x H(t) / a.u.
40
x(t) / a.u.
35
25
20
30
15
25
10
20
5
15
0 0
10
x(t) / a.u.
10
5
0 10
12
14
16
18
t/s
40
Based on phase-space plots (x(t), xH (t)) we differentiate SR from VF. We determine the area of the plot filled by the curve. To achieve this, we produce a 40 × 40 grid and count the boxes visited by the ECG signal. We then calculate a measure d defined by
35
x H(t) / a.u.
30
25
20
visited boxes . (2) number of all boxes If d is higher than a certain threshold d0 , we classify the corresponding ECG episode as VF. We choose for the threshold d0 = 0.15. The critical threshold parameter to obtain the ROC curve is d0 . d=
15
10
5
0 0
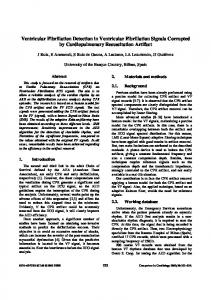
Figure 2. VF episode in the ECG signal cu01 from the CU database and corresponding points in the phase-space plot, d = 333/1600 = 0.21.
10
20
30
40
x(t) / a.u.
Figure 1. SR episode in the ECG signal cu01 from the CU database and corresponding points in the phase-space plot, d = 88/1600 = 0.06. Figure 2 shows a typical VF signal from the CU database
3.
Results
For the new algorithm tested in this paper we used the same prefiltering process as in [4]. The filtering process is carried out in a MATLAB routine, called filtering.m. The function filtering.m for preprocessing can be found on the
site http://www2.staff.fh-vorarlberg.ac.at/∼ku/VF/ filtering.m
In this paper we chose ECG episodes with a window length of 8 seconds. For the investigation we simulated a continuous analysis by selecting the data in steps of one second without any preselection.
MIT DB PP. Ac. 0.8 83.9 82.4 99.9 60.6 99.8 0.1 92.3 6.3 97.8
The decision of an algorithm analyzing an episode of 8 seconds window length is assigned to the endpoint of that interval. The quality parameters are presented in the following figure and tables. The perfect algorithm would have values for sensitivity, specificity, positive predictivity, accuracy, and IROC of 100%, assuming that the annotations are 100% correct. The data sets were taken from the BIH-MIT database (48 files, 2 channels per file, each channel 1805 seconds long), the CU database (35 files, 1 channel per file, each channel 508 seconds long), and the AHA database (files 7001 - 8210, 40 files, 2 channels per file, each channel 1800 seconds long). Thus, the total number of decisions per algorithm (window length = 8s) is 2 · 48 · (1805 − 7) + 35 · (508 − 7) + 2 · 40 · (1800 − 7) = 333 583. Table 1 shows the values for the sensitivity, the specificity and the area under the receiver operating characteristic of the new algorithm and the corresponding values for some other algorithms investigated in [4]. A short description of all these algorithms can be found there too1 . Table 1. Quality of ventricular fibrillation detection algorithms (sensitivity, specificity, integrated receiver operating characteristic) in per cent. Data Source Parameter TCI VF SPEC CPLX HILB
MIT DB Sns. Spc. 74.5 83.9 29.4 100 23.1 100 6.3 92.4 86.0 97.9
CU DB Sns. Spc. 71.0 70.5 30.8 99.5 29.0 99.3 56.4 86.6 74.7 85.4
AHA DB Sns. Spc. 75.7 86.9 16.9 100 29.2 99.8 60.2 91.9 84.4 95.1
CU DB PP. Ac. 38.9 70.6 94.5 85.2 92.0 84.6 52.7 80.3 59.1 83.0
AHA DB PP. Ac. 54.4 84.9 98.9 85.7 97.3 87.7 60.7 86.5 78.3 93.3
overall results PP. Ac. ct. 31.1 83.6 2.1 97.7 93.0 1.9 96.1 93.8 1.9 40.8 89.2 2.5 67.6 95.1 1.8
accuracy and the calculation time of the new algorithm. Figure 3 compares the ROC curves of the new algorithm and the corresponding values for some other algorithms investigated in [4]. 100
80 Sensitivity / per cent
Data Source Parameter TCI VF SPEC CPLX HILB
Table 2. Positive predictivity, accuracy, and calculation time in per cent for a window length of 8 seconds, calculation time in per cent of the real time of the data.
60
40
TCI VF SPEC CPLX HILB
20
0
0
20
40
60
80
100
(1−Specificity) / per cent
Figure 3. ROC curves for investigated algorithms, blue vertical lines at 99% and 95%.
overall results Sns. Spc. IROC 75.1 84.4 82 18.8 100 87 29.1 99.9 89 59.2 92.0 87 83.1 96.2 95
Table 2 shows the values for the positive predictivity, the 1 TCI . . . threshold crossing intervals algorithm [5], VF . . . VF filter algorithm [6], SPEC . . . spectral algorithm [7], CPLX . . . complexity measure algorithm [8]
Table 3 shows the values for the sensitivity of the investigated algorithms, if, due to an appropriate adaption of
the threshold parameters, the specificity is 95 % or 99 %, respectively. Table 3. Sensitivity of ventricular fibrillation detection algorithms in per cent for a window length of 8 seconds. Parameter TCI VF SPEC CPLX HILB
4.
Sns. if Spc. = 95 25.3 73.4 69.8 38.8 84.7
Sns. if Spc. = 99 1.3 59.7 58.9 5.8 74.2
Discussion and Conclusion
In real applications of AEDs the specificity is more important than the sensitivity, since no patient should be defibrillated due to an analysis error which might cause cardiac arrest. Therefore, a low number of false positive decisions should be achieved, even if this increases the number of false negative decisions. The new algorithm HILB clearly yields the best values for the integrated receiver operating characteristic. This implies that for any given specified specificity the algorithm HILB will yield by far the best sensitivity (see Figure 3). Moreover, it is the fastest of all algorithms.
References [1] American Heart Association, AHA database. URL http: //www.americanheart.org. [2] Massachusetts Institute of Technology, MIT-BIH arrhythmia database. URL http://www.physionet.org/ physiobank/database/mitdb. [3] Massachusetts Institute of Technology, CU database. URL http://www.physionet.org/physiobank/ database/cudb. [4] Amann A, Tratnig R, Unterkofler K. Reliability of old and new ventricular fibrillation detection algorithms for automated external defibrillators. BioMedical Engineering OnLine 2005;4(60). URL http: //www.biomedical-engineering-online.com/ content/4/1/60. [5] Thakor N, Zhu Y, Pan K. Ventricular tachycardia and fibrillation detection by a sequential hypothesis testing algorithm. IEEE Trans Biomed Eng 1990;37(9):837–43. [6] Kuo S, Dillman R. Computer detection of ventricular fibrillation. Computers in Cardiology IEEE Computer Society 1978;347–349. [7] Barro S, Ruiz R, Cabello D, Mira J. Algorithmic sequential decision-making in the frequency domain for life threatening ventricular arrhythmias and imitative artefacts: a diagnostic system. J Biomed Eng 1989;11(4):320–8. [8] Zhang X, Zhu Y, Thakor N, Wang Z. Detecting ventricular tachycardia and fibrillation by complexity measure. IEEE Trans Biomed Eng 1999;46(5):548–55.
Address for correspondence: Anton Amann: Innsbruck Medical University, Department of Anesthesia and General Intensive Care, Anichstrasse 35, A-6020 Innsbruck, Austria and Department of Environmental Sciences, CHN F 26, ETH-Zentrum, CH-8092 Z¨urich E-mail address:
[email protected] Robert Tratnig and Karl Unterkofler: Research Center PPE, Life Science - Biomathematics Group, FH-Vorarlberg, Achstrasse 1, A–6850 Dornbirn, Austria E-mail address:
[email protected],
[email protected]