Generative Network Automata: A Generalized Framework for Modeling Adaptive Network Dynamics Using Graph Rewritings
arXiv:0901.0216v1 [nlin.AO] 2 Jan 2009
Hiroki Sayama and Craig Laramee
Abstract A variety of modeling frameworks have been proposed and utilized in complex systems studies, including dynamical systems models that describe state transitions on a system of fixed topology, and self-organizing network models that describe topological transformations of a network with little attention paid to dynamical state changes. Earlier network models typically assumed that topological transformations are caused by exogenous factors, such as preferential attachment of new nodes and stochastic or targeted removal of existing nodes. However, many real-world complex systems exhibit both of these two dynamics simultaneously, and they evolve largely autonomously based on the system’s own states and topologies. Here we show that, by using the concept of graph rewriting, both state transitions and autonomous topology transformations of complex systems can be seamlessly integrated and represented in a unified computational framework. We call this novel modeling framework “Generative Network Automata (GNA)”. In this chapter, we introduce basic concepts of GNA, its working definition, its generality to represent other dynamical systems models, and some of our latest results of extensive computational experiments that exhaustively swept over possible rewriting rules of simple binary-state GNA. The results revealed several distinct types of the GNA dynamics.
1 Introduction A variety of modeling frameworks have been proposed and utilized for research on the dynamics of complex systems [1, 2, 3]. A major class of modeling frameworks Hiroki Sayama and Craig Laramee Collective Dynamics of Complex Systems Research Group / Department of Bioengineering, Binghamton University, State University of New York, P.O. Box 6000, Binghamton, NY 13902-6000, USA, e-mail:
[email protected],
[email protected] Hiroki Sayama is also an Affiliate of the New England Complex Systems Institute, 24 Mt. Auburn St., Cambridge, MA 02138, USA, e-mail:
[email protected]
1
2
Hiroki Sayama and Craig Laramee
is that of dynamical systems models, including ordinary or partial differential equations and iterative maps [4], artificial neural networks [5, 6], random Boolean networks [7, 8, 9], and cellular automata [10, 11]. While they are capable of producing strikingly complex and even biological-like behaviors [12, 13, 14, 15, 16], these tools generally assume a network made of a fixed number of components organized in a fixed topology. Their dynamics are considered as trajectories of system states in a confined phase space with time-invariant dimensions. The recent surge of network theory in statistical physics has demonstrated yet another graph-theoretic approach to complex systems modeling [17, 18, 19]. It addresses the self-organization of network structure via local topological transformations such as random or preferential addition, modification and removal of components and their interactions (i.e., nodes and links). Among the most actively investigated issues in this field is how statistical properties of the entire network topology will be affected by additions (growth or augmentation) and removals (failures or attacks) of nodes and links, and in particular, how networks can be more robust against the latter [20, 21, 22, 23, 24]. Those additions and removals are typically assumed as perturbations coming from external sources, not incorporated into the dynamics of the network itself. They are also limited in that not much attention has been paid to dynamical state changes on the network. Researchers recently started investigating dynamical state changes on complex networks [25, 26, 27, 28, 29, 30]. They are still largely focusing on fixed network topologies or topologies varied by exogenous perturbations. When looking into real-world complex networks, however, one can find many instances of networks whose states and topologies “coevolve”, i.e., they keep changing over the same time scales due to the system’s own dynamics (Table 1). In these networks, state transitions of each component and topological transformations of networks are deeply coupled with each other. Understanding and describing the coevolution of states and topologies of networks is now recognized as one of the most important problems to address [21, 31]. Several theoretical models of coevolutionary networks have been proposed and studied most recently [32, 33, 34, 35, 36], yet each of these studies used different model formulations for different phenomena, with limited implications given for how these coevolutionary network models could be linked to other existing complex systems models. Here we aim to address the above-mentioned lack of linkages between coevolutionary network models and other existing complex systems models by developing a more comprehensive formulation. Specifically, we show that, by using the concept of graph rewriting, both state transitions and autonomous topology transformations of complex systems can be seamlessly integrated and represented in a unified computational framework. We call this novel modeling framework “Generative Network Automata (GNA)” [37]. The name indicates the integration of knowledge accumulated in dynamical systems theory, network theory, and graph grammar theory. In the following sections, we will introduce basic concept of graph rewriting, a working definition of GNA, its generality to represent other dynamical systems models, and some of our latest results of extensive computational experiments that
Generative Network Automata
3
Table 1 Real-world examples of complex networks whose states and topologies change over the same time scales due to the network’s own dynamics. Network
Nodes
Links
Example of node states
Example of node addition or removal
Example of topological changes
Organism
Cells
Gene/protein activities
Cell division, cell death
Cell migration
Ecological community
Species
Cell adhesions, intercellular communications Ecological relationships (predation, symbiosis, etc.) Physical contacts
Population, intraspecific diversities
Speciation, invasion, extinction
Changes in ecological relationships via adaptation
Pathologic states
Death, quarantine
Social relationships, conversations, collaborations
Sociocultural states, political opinions, wealth
Entry to or withdrawal from community
Reduction of physical contacts Establishment or renouncement of relationships
EpidemioIndividuals logical network Social network Individuals
exhaustively swept over possible rewriting rules of simple binary-state GNA. The results revealed several distinct types of the GNA dynamics.
2 About Graph Rewriting The key characteristic of GNA is that it should have mechanisms for transformations of local network topologies as well as transitions of local states. Topological transformations may be modeled as a rewriting process of local network configurations. We will therefore adopt methods and techniques developed in graph grammar theory [38] to construct general formulations of GNA. Graph grammars, studied since late 1960’s in theoretical computer science [39, 40, 41, 42], are an extension of formal generative grammars in computational linguistics to discuss similar rule-based generative processes of graphs, or networks. They recursively define a set of “valid” graph topologies that can be generated through repetitive applications of a given set of node and/or link replacement rules. A computational implementation of such processes is called a graph rewriting system, often used to simulate particular generative processes of network topology. Here the word “generative” means that the replacements are triggered by local topological features of the network itself, and not by external sources of perturbation as typically assumed in modern network theory. A classic, and probably most widely known, example of graph rewriting systems is the Lindenmayer system, or L-system [43]. It is a simple rewriting system that
4
Hiroki Sayama and Craig Laramee
can produce self-similar recursive structures in a sequential string (in this sense, the L-system remains within the range of classic formal grammars). What makes this system outstanding is that it comes with an interpretation that converts a resultant string into a tree-like topological structure, which may appear just like a natural tree if parameters are appropriately chosen. This example shows the capability of graph rewriting systems to describe the emergence of natural complex structures using a set of small local rules. Although their relevance to biology was initially recognized [39, 44], applications of graph grammars have so far remained within computer science, such as pattern recognition, compiler design, and data type and process specification [38, 40, 41, 42], and their use has been not so common even within computer science due to unintuitive, complicated formulation and lack of software tools for modeling [45]. Moreover, most applications were primarily focused on context-free rewriting rules, and they rarely considered dynamical state transitions on networks. Recently, context-dependent graph grammars have been applied to describe reaction rules in artificial life/artificial chemistry, including models of self-replication [46, 47, 48], self-assembly [49], morphogenesis [50, 51] and dynamic state changes [51] of artifacts. However, none of them integrated graph grammars into complex systems modeling in a flexible, generalizable way so as to be readily applicable to networks studied in other domains. To the best of our knowledge, our GNA framework is among the first to systematically integrate graph rewritings in the representation and computation of the dynamics of complex networks that involve both state transition and autonomous topological transformation. Our long-term goal is to develop a comprehensive theory of GNA and a set of analytical/computational tools that can be broadly applied to the modeling of various complex systems.
3 Definition of GNA A working definition of GNA is a network made of dynamical nodes and directed links between them. Undirected links can also be represented by a pair of directed links symmetrically placed between nodes. Each node takes one of the (finitely or infinitely many) possible states defined by a node state set S. The links describe referential relationships between the nodes, specifying how the nodes affect each other in state transition and topological transformation. Each link may also take one of the possible states in a link state set S′ . A configuration of GNA at a specific time t is a combination of states and topologies of the network, which is formally given by the following: • Vt : A finite set of nodes of the network at time t. While usually assumed as time-invariant in conventional dynamical systems theory, this set can dynamically change in the GNA framework due to additions and removals of nodes. • Ct : Vt → S: A map from the node set to the node state set S. This describes the global state assignment on the network at time t. If local states are scalar num-
Generative Network Automata
5
bers, this can be represented as a simple vector with its size potentially varying over time. • Lt : Vt → {Vt × S′ }∗ : A map from the node set to a list of destinations of outgoing links and the states of these links, where S′ is a link state set. This represents the global topology of the network at time t, which is also potentially varying over time. States and topologies of GNA are updated through repetitive graph rewriting events, each of which consists of the following three steps: 1. Extraction of part of the GNA (subGNA) that will be subject to change. 2. Production of a new subGNA that will replace the subGNA selected above. 3. Embedding of the new subGNA into the rest of the whole GNA. The temporal dynamics of GNA can therefore be formally defined by the following triplet hE, R, Ii: • E: An extraction mechanism that determines which part of the GNA is selected for the updating. It is defined as a function that takes the whole GNA configuration and returns a specific subGNA in it to be replaced. It may be deterministic or stochastic. • R: A replacement mechanism that produces a new subGNA from the subGNA selected by E and also specifies the correspondence of nodes between the old and new subGNAs. It is defined as a function that takes a subGNA configuration and returns a pair of a new subGNA configuration and a mapping between nodes in the old subGNA and nodes in the new subGNA. It may be deterministic or stochastic. • I: An initial configuration of GNA. There are a couple of other commonly used procedures needed to simulate GNA dynamics, such as the removal of the selected subGNA from the whole GNA and the re-connection of “bridge” links (i.e., links that were between the old subGNA and the rest of the GNA) when embedding the new subGNA. Because the workings of these procedures are fairly obvious, we omit detailed explanations for them. The above E, R, I are sufficient to uniquely define specific GNA models. The entire picture of a rewriting event is illustrated in Fig. 1, which visually shows how these mechanisms work together. This rewriting process, in general, may not be applied synchronously to all nodes or subGNAs in a network, because simultaneous modifications of local network topologies at more than one places may cause conflicting results that are inconsistent with each other. This limitation will not apply though when there is no possibility of topological conflicts, e.g., when the rewriting rules are all context-free, or when GNA is used to simulate conventional dynamical networks that involve no topological changes. We note that it is a unique feature of GNA that the mechanism of subgraph extraction is explicitly described in the formalism as an algorithm E, not implicitly assumed outside the grammatical rules like what other graph rewriting systems typically adopt (e.g. [51]). Such algorithmic specification allows more flexibility in
6
Hiroki Sayama and Craig Laramee
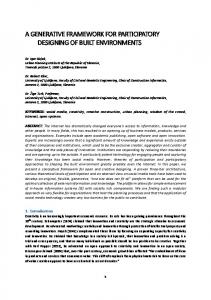
Fig. 1 GNA rewriting process. (a) The extraction mechanism E selects part of the GNA. (b) The replacement mechanism R produces a new subGNA as a replacement of the old subGNA and also specifies the correspondence of nodes between old and new subGNAs (dashed line). This process may involve both state transition of nodes and transformation of local topologies. The “bridge” links that used to exist between the old subGNA and the rest of the GNA remain unconnected and open. (c) The new subGNA produced by R is embedded into the rest of the GNA according to the node correspondence also specified by R. In this particular example, the top gray node in the old subGNA has no corresponding node in the new subGNA, so the bridge links that were connected to that node will be removed. (d) The updated configuration after this rewriting event.
representing diverse network evolution and less computational complexity in implementing their simulations, significantly broadening the areas of application. For example, the preferential attachment mechanism widely used in modern network theory to construct scale-free networks is hard to describe with pure graph grammars but can be easily written in algorithmic form in GNA, as demonstrated in the next section. While the definition given above is one of the simplest possible formulations of GNA, it already has considerable complexity compared to conventional dynamical systems models. The possibility of temporal changes of Vt and Lt particularly
Generative Network Automata
7
makes it difficult to investigate its dynamical properties analytically. However, the updating process of GNA is algorithmically described and hence their dynamics can be experimented through computer simulation relatively easily. We have developed a package in Wolfram Research Mathematica for small-scale simulation and visualization of GNA with node states1 . The results presented in this chapter were obtained using this package.
4 Generality of GNA The GNA framework is highly general and flexible so that many existing dynamical network models can be represented and simulated within this framework. For example, if R always conserves local network topologies and modifies states of nodes only, then the resulting GNA is a conventional dynamical network model, including cellular automata, artificial neural networks, and random Boolean networks (Fig. 2 (a), (b)). A straightforward application of GNA typically comes with asynchronous updating schemes, as introduced in the previous section. Since asynchronous automata networks can emulate any synchronous automata networks [52], the GNA framework covers the whole class of dynamics that can be produced by conventional dynamical network models. Moreover, as mentioned earlier, synchronous updating schemes could also be implemented in GNA for this particular class of models because they involve no topological transformation. On the other hand, many network growth models developed in modern network theory can also be represented as GNA if appropriate assumptions are implemented in the subGNA extraction mechanism E and if the replacement mechanism R causes no change in local states of nodes (Fig. 2 (c)).
5 Computational Exploration of Possible Dynamics of Simple Binary-State GNA In this section we report our latest results of extensive computational experiments that exhaustively swept over possible rewriting rules of simple binary-state GNA. The results shown here were obtained with much less restricted rule sets than those assumed in our previous work [37].
1
The Mathematica package is still under active development but may be available upon request.
8
Hiroki Sayama and Craig Laramee
Fig. 2 Various dynamical network models simulated using GNA. These examples were represented in the same format of hE, R, Ii (see text) and simulated using the same simulator package implemented in Mathematica. (a) Simulation of asynchronous 2-D binary cellular automata with von Neumann neighborhoods and local majority rules. Space size: 100 × 100. (b) Simulation of an asynchronous random Boolean network with N = 30 and K = 2. Time flows from left to right. Nodes of random Boolean networks are non-homogeneous, i.e., they obey different state-transition rules. Here each node’s own state-transition rule is embedded as part of its state, and the replacement mechanism R refers to that information when calculating the next state of a node. (c) Simulation of a network growth model with the Barab´asi-Albert preferential attachment scheme. Time flows from left to right. Each new node is attached to the network with one link. The extraction mechanism E is implemented so that it determines the place of attachment preferentially based on the node degrees, which causes the formation of a scale-free network in the long run.
Generative Network Automata
9
5.1 Assumptions There are infinitely many possible mechanisms for E and R because there are no theoretical upper bounds in terms of the size of the old subGNA selected by E (it could be infinitely large as the GNA grows) and the new subGNA produced by R (it could be arbitrarily large by the design of R). Making reasonable assumptions to restrict the possibility of mechanisms for E and R is critical to facilitate systematic study on the dynamics of GNA. Here we make the following assumptions (Fig. 3): 1. Node states are binary (0 or 1). 2. No link state is considered (i.e., links homogeneously take only one state and it will never change). 3. Links are undirected (i.e., every connection between nodes is represented by a pair of symmetrically placed directed links). 4. The extraction mechanism E always selects a subGNA by a. randomly picking one node u from the entire GNA (Fig. 3 (a)), b. taking all the destination nodes of its outgoing links Lt (u) (Fig. 3 (b)), and c. producing a subGNA “induced” by these nodes {u} ∪ Lt (u), i.e., a subGNA that includes all these nodes as well as all the links present between them (Fig. 3 (c)). 5. The replacement mechanism R only refers to the state of the central node u and the local majority state within the induced subGNA. If there are equal numbers of 0’s and 1’s within the subGNA, one of the two states is randomly chosen. This two-bit information will be used to determine what will happen to the local configuration (Fig. 3 (d)). The following ten possible rewriting outcomes are made available (which are extended from [37]): 0) 1) 2) 3) 4) 5) 6) 7)
The central node u disappears. Everything remains in the same condition. The state of the central node u is inverted. The central node u divides into two with the state preserved in both nodes. The central node u divides into two with the state inverted in both nodes. The central node u divides into two with the state inverted in one node. The central node u divides into three with the state preserved in all three nodes. The central node u divides into three with the state inverted in all of three nodes. 8) The central node u divides into three with the state inverted in two of three nodes. 9) The central node u divides into three with the state inverted in one of three nodes. In cases where node division occurs, the links that were connected to the central node u is distributed as evenly as possible to its daughter nodes (Fig. 3 (e)). 6. The initial condition I consists of a single node with state 0.
10
Hiroki Sayama and Craig Laramee
Fig. 3 Simplified GNA rewriting process used for the exhaustive sweep experiments. The extraction mechanism E (a) randomly picks one node u, (b) takes all the destination nodes of its outgoing links Lt (u), and (c) produces a subGNA induced by those nodes {u} ∪ Lt (u). The replacement mechanism R (d) refers to the state of the central node u in the selected subGNA and the local majority state within it to determine what happens to the local configuration, (e) produces a new subGNA as well as the correspondence of nodes between the old and new subGNAs based on the choice made in (d), and then (f) embeds the new subGNA into the rest of the GNA.
Note that the above model assumptions will always generate planar graphs in which the node degrees are bounded up to three when initiated with a single node. Therefore all the results shown in this chapter are topologically planar.
5.2 Methods We carried out an exhaustive sweep of all the possible rewriting rules that satisfy the assumptions discussed above. Since the extraction mechanism E is uniquely defined, it is only the replacement mechanism R that can be varied. Here R is defined as a function that maps each of the four possible two-bit inputs to one of the ten 2 possible actions. Therefore the number of all the possible R’s is 102 = 10000. To indicate a specific R, we will use its “rule number” rn(R) that is defined by rn(R) = a11 × 103 + a10 × 102 + a01 × 101 + a00 × 100,
(1)
where ai j is a numerical representation (numbers associated with each of the ten possible actions shown above) of the choice that R will make when the state of the central node u is i and the local majority state is j.
Generative Network Automata
11
It should be noted that there are two different ways of counting time steps in asynchronous simulations. One is simply to count one rewriting event as one time step, which we call computational time. The other is to measure the progress of virtual time in a simulated world between discrete events by considering one rewriting event as taking 1/Nt of the unit of time, where Nt is the number of nodes at time t. This is based on the assumption that every node is updated once on average per unit of time, which is a reasonable and useful assumption especially when one wants to compare results of asynchronous simulations with those of synchronous ones. We call the latter notion of time simulated time. All the t’s in this chapter represent simulated time. We simulated the GNA dynamics for rn ranging from 0 to 9999. For each rn five independent simulation runs were conducted and the average of their results were used. Each run continued until 500 rewriting events were simulated, or Nt exceeded 1000, or Nt became 0, whichever was sooner. During each run, we recorded time series of Nt by sampling its value in every half unit of simulated time. We then calculated its growth characteristics, estimated order of polynomial growth k and estimated rate of exponential growth r, by conducting nonlinear fitting of a hypothetical growth model to the time series data (explained later). In addition, after each simulation run, we measured the following quantities of the final GNA configuration: • • • • • •
Number of nodes Number of links Average node degree Number of connected components Size of the largest connected component Average node state
If all the nodes disappear during the simulation run, the average node degree and the average node state are indeterminate.
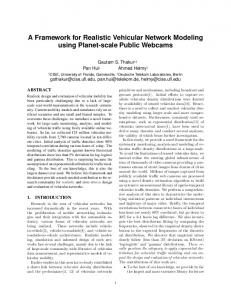
5.3 Results We first studied the growth characteristics of GNA and their differences between different rules. Figure 4 presents sample growth curves superposed in a single plot, showing temporal changes in number of nodes over simulated time. Several distinct types of growth patterns are already visible in this plot. Curves that go nearly flat along the t axis indicate that the GNA for these cases did not grow at all. Many other rules showed rapid exponential growth processes (dense bundle of sharply rising curves on the left). Between these two, there are relatively fewer intermediate cases that exhibit either slow, fluctuating growth, or even linear growth, which are qualitatively different from other growth curves. We extracted the growth characteristics of each rule from its time series data by fitting to them a hypothetical growth model Nt ∼ (t + 1)k ert using the least squares
Hiroki Sayama and Craig Laramee
# of nodes
12
t Fig. 4 Growth curves of randomly selected 10% of the 50000 independent simulation runs (5 runs × 10000 rules).
method, where k and r are the estimated order of polynomial growth and the estimated rate of exponential growth, respectively. For each rule, these values were calculated with five independent simulation runs and then their averages were used for the analysis. We excluded rules in the form of “***0” or “0**2” (where ‘*’ can be any single-digit number) that caused immediate node extinction and hence failure of nonlinear fitting. This filtering excluded 1100 rules, leaving a total of 8900 (out of 10000) rules that were used in the following plots. Figure 5 (left) shows the distribution of the growth characteristics (k and r) of the 8900 GNA rules. The distribution is continuously spread mostly in the first and second quadrants, in which there are a couple of visually identifiable dense clusters. The slightly slanted linear cluster near the top of the second quadrant corresponds to rules that make GNA grow exponentially through continuous tertiary node divisions. The other slanted linear cluster located around (k, r) = (0, 1) corresponds to rules that make GNA grow exponentially through continuous binary divisions. Between and around these two clusters there are many other rules that show intermediate exponential growth rates. A relatively thin linear cluster at k > 0 and r ∼ 0 is considered of non-growing or polynomially growing GNA rules. Most of the GNA rules belong to one of these three clusters, as seen in the histogram on the right. Finally, the sparse distribution of rules in the fourth quadrant are the ones that lead to node extinction. Figure 6 shows actual growth patterns of several rule samples (indicated by large black dots in Fig. 5), which confirms topological diversity generated even within this restricted set of binary-state GNA rules. The first five rows (rn =6929, 8955, 1756, 4683 and 8414) are the samples of exponentially growing rules. For rn =1756 and 4683, every rewriting event exclusively causes tertiary and binary node divisions and forms planar and linear structures, respectively, where node states remain ho-
Generative Network Automata
13
6929 1756
8414
8955
4683 179 2971
4212
125
Fig. 5 Left: Distribution of growth characteristics, estimated order of polynomial growth k and estimated rate of exponential growth r, of the 8900 GNA rules (excluding rules in the form of “***0” or “0**2” that caused immediate node extinction and hence failure of nonlinear fitting). Sample cases shown in Fig. 6 are indicated with large black dots, accompanied with the corresponding rule numbers. Right: 3-D histogram of growth characteristics in the parameter area −3 < k < 3 and 0 < r < 3. It is clearly seen that there are three distinct peaks, which correspond to non-growers, exponential growers by binary node divisions, and exponential growers by tertiary node divisions.
mogeneous and do not change at all. On the other hand, for rn =6929, 8955 and 8414, state-1 nodes appear at the beginning of simulation and the node states influence the network growth processes. Such interaction between node states and network topology results in a final GNA configuration with non-homogeneous node state distribution and a growth rate that is different from those of homogeneous network growth. The rest are the examples that do not show exponential growth, among which rn =4212 uniquely demonstrates a very slow growth of a linear structure driven by a complicated interaction between state-0 and state-1 nodes on it. We also investigated the topological characteristics of the final GNA configurations obtained at the end of each simulation run. For this purpose, we additionally excluded rules that always ended up with node extinction, because average node degrees or states cannot be defined for such rules. As a result, we used 8617 rules for the following analyses. Figure 7 shows the histograms of rule frequencies arranged in terms of six topological characteristics (described earlier) of the final GNA configuration. Three distinct peaks are commonly seen in (a), (b), (c) and (e) of these plots. These three peaks correspond to two types of exponential growers (by tertiary and binary node divisions) and non-growers. Between these peaks other cases distribute with relatively lower frequencies. Plot (d) indicates that most rules produce connected network structures only. In terms of the node state distribution, plot (f) shows that many GNA rules produce networks which are homogeneous regarding node states (represented by two peaks at 0.0 and 1.0) but other rules produce heterogeneous state distributions as well (represented by a gentle peak around 0.5). The
2 rewritings
4 rewritings
8 rewritings
16 rewritings
32 rewritings
64 rewritings 128 rewritings
14
After 1 rewriting rn
6929
8955
1756
8414
Hiroki Sayama and Craig Laramee
4683
Generative Network Automata
4212
179
(extinction)
2971
125
(extinction)
15
Fig. 6 Sample growth patterns of several GNA rules. Each row presents one specific simulation run for a particular GNA rule (indicated on the left by rn). Each image shows an actual GNA configuration after specific times of rewriting events. Note that the number of rewritings does not necessarily scale along the simulated time, which is given at the top of each image. Dark gray dots represent nodes in state 0, while light gray ones in state 1.
16
Hiroki Sayama and Craig Laramee
1500
Frequency
Frequency
1500 1000 500
1000 500
0
0 0
200
400
600
800
1000
0
500
(a) number of nodes
1500
8000
3000 2500
6000
2000
Frequency
Frequency
1000
(b) number of links
1500 1000
4000 2000
500 0
0 0.0
0.5
1.0
1.5
2.0
2.5
3.0
0
(c) average node degree
20
40
60
80
(d) number of connected components
3000
2000
Frequency
Frequency
2500 1500 1000 500
2000 1500 1000 500
0
0 0
200
400
600
800
1000
(e) size of largest connected component
0.0
0.2
0.4
0.6
0.8
1.0
(f) average node state
Fig. 7 Histograms of rule frequencies over six topological characteristics of the final GNA configurations. Each characteristic was calculated by averaging measurements obtained from five independent simulation runs for each rule. 8617 GNA rules after filtering (see text) were used to produce these plots.
distribution in (f) is asymmetric because we used a single node of state 0 as an initial condition for all the simulations. Figure 8 is a scatter plot matrix made of 7 × 7 = 49 scatter plots, each of which visually shows correlation between two of the seven characteristics described above: number of nodes, number of links, average node degree, number of connected components, average node state, estimated order of polynomial growth k, and estimated rate of exponential growth r. The size of largest connected components was not included because it is strongly correlated with the number of nodes as most of the networks were well connected (see Fig. 7 (d), as well as (a) and (e)). This matrix gives several interesting observations. There is a simple correlation between number of nodes, number of links and average node degree for obvious reasons, as already
Generative Network Automata
17
Table 2 Results of principal component analysis (PCA) applied to the same data shown in Fig. 8. Components and eigenvalues in bold face indicate four important dimensions. Component Eigenvalue
1 2 3 4 5 6 7
4.014 1.203 0.895 0.718 0.151 0.019 0.001
# of nodes 0.490 -0.021 0.122 0.105 -0.234 0.490 -0.662
Eigenvector # of Av. node # of Av. node links degree CCs state 0.485 0.441 -0.087 0.082 0.005 -0.269 -0.642 -0.603 0.108 0.028 0.584 -0.763 0.121 0.192 -0.484 -0.109 -0.383 0.828 -0.071 -0.186 -0.768 -0.101 -0.018 0.015 -0.034 0.004 -0.002 -0.002
k
r
-0.265 -0.388 0.204 0.831 -0.177 0.073 0.102
0.495 0.034 0.085 -0.018 -0.207 0.392 0.741
reported in our previous work [37]. More importantly, average node states have significant impacts on other properties of GNA, as seen in the fifth column/row of the matrix. For networks whose node states are homogeneous (i.e., average node state ∼ 0 or 1), there is always only one local situation possible: a node of state 0 (or 1) surrounded by nodes of the same state. For such a network to remain in homogeneous states while staying away from node extinction, there are only three possible outcomes (tertiary division with state preserved, binary division with state preserved, or absolutely no change). This necessarily results in only three values possible for number of nodes, number of links and estimated rate of exponential growth, for average node state ∼ 0 or 1. It is also notable that the largest numbers of connected components are achieved when the average node states take intermediate values. This suggests that node states play a critical role in determining when and where a node should disappear to cut the network and increase the number of connected components. Without such state-driven control of node disappearance, the nodes would easily become extinct. Finally, we conducted principal component analysis (PCA) on the distribution of results in a seven-dimensional vector space created by the seven characteristics used in Fig. 8. Data were rescaled before the analysis so that the standard deviation was one in each dimension. As a result, we extracted four important dimensions in the data distribution (Table 2). The primary dimension is strongly correlated with number of nodes, number of links, average node degree, and estimated rate of exponential growth r, which may be understood as a factor relevant to general topological growth. The secondary dimension is strongly correlated to number of connected components, average node state, and estimated order of polynomial growth k, which may be understood as a factor related to node disappearances caused by state changes. Note that the basis vector of this dimension happened to be taken in opposite direction to its correlated characteristics, so the lower value in this dimension means greater number of connected components, higher average node state, and higher order of polynomial growth. We further applied Ward’s minimum-variance hierarchical clustering algorithm to the data distribution in a vector space whose dimensions were reduced from seven to four according to the results of PCA. The clustering results were split into
18
Hiroki Sayama and Craig Laramee
Fig. 8 Scatter plot matrix showing 7 × 7 = 49 scatter plots, each of which visually shows correlation between two of the following seven characteristics of GNA. From left (bottom) to right (top): number of nodes, number of links, average node degree, number of connected components, average node state, estimated order of polynomial growth k, and estimated rate of exponential growth r.
seven clusters as shown in Fig. 9, where the top plot presents the results in a twodimensional space using the primary and secondary dimensions detected by PCA, whereas the bottom plot maps the same results in the k-r space in the same way as in Fig. 5. Rules in each cluster were manually sampled and inspected in further detail to see what kind of common dynamics exist within each type, which revealed the following: The first three clusters, filled circles (1103 rules), filled triangles (1000 rules) and filled squares (1000 rules), share exactly the same growth characteristics within each cluster so that they appear as a point in the k-r plot (Fig. 9, bottom). Specifically, the filled circles are non-growers without state changes or with regular state alterations between 0 and 1 (e.g., rn =2971), while the filled triangles and the filled squares are exponential growers without state changes, growing solely by binary (e.g., rn =4683) and tertiary (e.g., rn =1756) node divisions, respectively. The other
19
Component 2
Generative Network Automata
r
Component 1
k
Fig. 9 Results of hierarchical clustering of the data distribution conducted in a dimension-reduced vector space. Top: Clusters projected to a two-dimensional space using the primary and secondary dimensions detected by PCA. Bottom: Same results mapped in the k-r space in the same way as in Fig. 5. Numbers of rules in these clusters are as follows: Filled circle 1103, filled triangle 1000, filled square 1000, open circle 412, open triangle 1812, open square 2529, and star 761.
20
Hiroki Sayama and Craig Laramee
three clusters denoted by open markers involve active node state changes that influence their growth patterns. Specifically, the open circles (412 rules) show very slow or even no growth (e.g., rn =4212), while the open triangles (1812 rules) and the open squares (2529 rules) show exponential-like growth predominantly by binary (e.g., rn =8414) and tertiary (e.g., rn =6929 and 8955) node divisions, respectively. Finally, the cluster denoted by light gray stars (761 rules) involve active node state changes and frequent node disappearances, typically producing more than one connected components (e.g., rn =179). These results altogether demonstrate the diversities of potential dynamics of simple GNAs, in both topology and temporal evolution. Of particular importance compared to other network growth models is the possibility of interaction between network topology and node state distribution, which is key to nontrivial dynamics observed in the types that involve active node state changes.
6 Conclusion We proposed Generative Network Automata as a new generalized framework for the modeling of complex dynamical networks, with which one can uniformly describe both state transitions and autonomous topological transformations using repetitive graph rewritings. We explored possible dynamics of simple binary-state GNA and observed several distinct types of topologies and growth patterns that emerged from local rewriting rules, where dynamic state changes were coupled with topological changes in some types. The work presented here had a couple of limitations that must be noted. One was that we employed several restrictions on possible rule sets to keep the search space small. For example, we assumed that the extraction mechanism E randomly picks a node from the network, which avoided the computationally inefficient subgraphisomorphism problem that would need to be solved for other types of extraction mechanisms that look for particular topological features. The other limitation was the small network size. We experimented with GNAs whose size was up to 1000 nodes, which is significantly smaller than many real-world complex networks being investigated today. We realize that, to enable unrestricted GNA modeling and simulation at a significantly larger scale, several technical issues will need to be addressed in a computationally efficient way, including: 1. How to represent and rewrite large GNA configurations 2. How to extract subGNAs that match given patterns from a large GNA configuration 3. How to keep track of statistical/dynamical properties of GNAs during simulation with minimum computational overheads 4. How to embed complex GNAs in a 2-D or 3-D visualization space in a visually meaningful manner 5. How to derive the optimal rule set that best explains the network evolution given by experimental data
Generative Network Automata
21
Some of these problems apparently involve intractable computational complexity if exact solutions are sought2. We are therefore working to develop computationally practical solutions to these problems by using appropriate approximations and heuristics. We hope that GNA will help formulate many distinct complex systems in the same “format”, enabling one to compare those systems systematically, to identify their commonness and uniqueness, and to actively exchange knowledge between different fields beyond disciplinary boundaries. We anticipate several areas of immediate applications, including (a) ecology and epidemiology modeling where organisms and pathogens actively reshape their habitat structure (e.g., niche construction, effects of host survivability in epidemiological networks), (b) social network modeling where individual states and behaviors modify the network topology (e.g., evolution of social ties, self-organization of collective knowledge among people), and (c) biologically inspired engineering design where local rewriting rules can be exploited as a means to indirectly control the emergent dynamics of artifacts that develop and self-organize over time.
References 1. Bar-Yam, Y. (1997) Dynamics of Complex Systems. Westview Press. 2. Wiggins, S. (2003) Introduction to Applied Nonlinear Dynamical Systems and Chaos, 2nd Ed. Springer. 3. Boccara, N. (2004) Modeling Complex Systems. Springer-Verlag. 4. Strogatz, S. H. (1994) Nonlinear Dynamics and Chaos. Westview Press. 5. McCulloch, W. S. & Pitts, W. (1943) A logical calculus of the ideas immanent in nervous activity. Bull. Math. Biophys. 5:115-133. 6. Hopfield, J. J. (1982) Neural networks and physical systems with emergent collective computational abilities. PNAS 79:2554-2558. 7. Kauffman, S. A. (1969) Metabolic stability and epigenesis in randomly constructed genetic nets. J. Theor. Biol. 22:437-467. 8. Derrida, B. & Pomeau, Y. (1986) Random networks of automata: A simple annealed approximation. Europhys. Lett. 1:45-49. 9. Kauffman, S. A. (1993) The Origins of Order. Oxford University Press. 10. Wolfram, S. (1984) Universality and complexity in cellular automata. Physica D 10:1-35. 11. Ilachinski, A. (2001) Cellular Automata: A Discrete Universe. World Scientific. 12. May, R. M. (1976) Simple mathematical models with very complicated dynamics. Nature 261:459-467. 13. Berlekamp, E. R., Conway, J. H., & Guy, R. K. (1982) Winning Ways for Your Mathematical Plays Vol. 2: Games in Particular, Chapter 25: “What is Life?”. Academic Press. 14. Pearson, J. E. (1993) Complex patterns in a simple system. Science 261:189-192. 15. Sayama, H. (1999) A new structurally dissolvable self-reproducing loop evolving in a simple cellular automata space. Artificial Life 5:343-365. 16. Salzberg, C. & Sayama, H. (2004) Complex genetic evolution of artificial self-replicators in cellular automata. Complexity 10(2): 33-39. 17. Watts, D. J. & Strogatz, S. H. (1998) Collective dynamics of ‘small-world’ networks. Nature 393:440-442. 2
The subgraph-isomorphism problem is known to be NP-complete.
22
Hiroki Sayama and Craig Laramee
18. Strogatz, S. H. (2001) Exploring complex networks. Nature 410:268-276. 19. Newman, M., Barab´asi, A.-L. & Watts, D. J., eds. (2006) The Structure and Dynamics of Networks. Princeton University Press. 20. Albert, R., Jeong, H. & Barab´asi, A.-L. (2000) Error and attack tolerance of complex networks. Nature 406:378-382. 21. Albert, R. & Barab´asi, A.-L. (2002) Statistical mechanics of complex networks. Rev. Mod. Phys. 74:47-97. 22. Shargel, B., Sayama, H., Epstein, I. R. & Bar-Yam, Y. (2003) Optimization of robustness and connectivity in complex networks. Phys. Rev. Lett. 90:068701. 23. da Fontoura Costa, L. (2004) Reinforcing the resilience of complex networks. Phys. Rev. E 69:066127. 24. Beygelzimer, A., Grinstein, G. M., Linsker, R. & Rish, I. (2005) Improving network robustness by edge modification. Physica A 357:593-612. 25. Bar-Yam, Y. & Epstein, I. R. (2004) Response of complex networks to stimuli. PNAS 101:4341-4345. 26. Motter, A. E. (2004) Cascade control and defense in complex networks. Phys. Rev. E 93:098701. 27. de Aguiar, M. A. M. & Bar-Yam, Y. (2005) Spectral analysis and the dynamic response of complex networks. Phys. Rev. E 71:016106. 28. Zhou, H. & Lipowsky, R. (2005) Dynamic pattern evolution on scale-free networks. PNAS 102:10052-10057. 29. Tomassini, M. (2006) Generalized automata networks. In Yacoubi, S. E., Chopard, B. & Bandini, S., eds., Cellular Automata: Proceedings of the 7th International Conference on Cellular Automata for Research and Industry (ACRI 2006), pp.14-28. Springer-Verlag. 30. Motter, A. E., Mat´ıas, M. A., Kurths, J. & Ott, E., eds. (2006) Special Issue: Dynamics on Complex Networks and Applications, Physica D 224. 31. Gross, T. & Blasius, B. (2008) Adaptive coevolutionary networks: a review. J. R. Soc. Interface 5:259-271. 32. Holme, P. & Ghoshal, G. (2006) Dynamics of networking agents competing for high centrality and low degree. Phys. Rev. Lett. 96:098701. 33. Holme, P. & Newman, M. E. J. (2006) Nonequilibrium phase transition in the coevolution of networks and opinions. Phys. Rev. E 74:056108. 34. Gross, T., D’Lima, C. J. D. & Blasius, B. (2006) Epidemic dynamics on an adaptive network. Phys. Rev. Lett. 96:208701. 35. Pacheco, J. M., Traulsen, A. & Nowak, M. A. (2006) Coevolution of strategy and structure in complex networks with dynamical linking. Phys. Rev. Lett. 97:258103. 36. Palla, G., Barab´asi, A.-L. & Vicsek, T. (2007) Quantifying social group evolution. Nature 446:664-667. 37. Sayama, H. (2007) Generative network automata: A generalized framework for modeling complex dynamical systems with autonomously varying topologies. Proceedings of The First IEEE Symposium on Artificial Life (IEEE-CI-ALife ’07), IEEE, pp.214-221. 38. Rozenberg, G., ed. (1997) Handbook of Graph Grammars and Computing by Graph Transformation Volume 1: Foundations. World Scientific. 39. Claus, V., Ehrig, H. & Rozenberg, G., eds. (1979) Proceedings of the International Workshop on Graph-Grammars and Their Application to Computer Science and Biology, October 30November 3, 1978, Bad Honnef, Germany. Lecture Notes in Computer Science 73, SpringerVerlag. 40. Ehrig, H., Nagl, M. & Rozenberg, G., eds. (1983) Proceedings of the Second International Workshop on Graph-Grammars and Their Application to Computer Science, October 4-8, 1982, Haus Ohrbeck, Germany. Lecture Notes in Computer Science 153, Springer-Verlag. 41. Ehrig, H., Nagl, M., Rozenberg, G. & Rosenfeld, A., eds. (1987) Proceedings of the Third International Workshop on Graph-Grammars and Their Application to Computer Science, December 2-6, 1986, Warrenton, VA. Lecture Notes in Computer Science 291, Springer-Verlag.
Generative Network Automata
23
42. Ehrig, H., Kreowski, H.-J. & Rozenberg, G., eds. (1991) Proceedings of the Fourth International Workshop on Graph-Grammars and Their Application to Computer Science, March 5-9, 1990, Bremen, Germany. Lecture Notes in Computer Science 532, Springer-Verlag. 43. Lindenmayer, A. (1968) Mathematical models for cellular interaction in development I. Filaments with one-sided inputs. J. Theor. Biol. 18:280-289. 44. Doi, H. (1984) Graph-theoretical analysis of cleavage pattern: Graph developmental system and its application to cleavage pattern of ascidian egg. Development, Growth & Differentiation 26:49-60. 45. Blostein, D., Fahmy, H. & Grbavec, A. (1996) Issues in the practical use of graph rewriting. In Proceedings of the Fifth International Workshop on Graph Grammars and Their Application to Computer Science, Lecture Notes in Computer Science 1073, Springer, pp.38-55. 46. Tomita, K., Kurokawa, H. & Murata, S. (2002) Graph automata: Natural expression of selfreplication. Physica D 171:197-210. 47. Hutton T. J. (2002) Evolvable self-replicating molecules in an artificial chemistry. Artificial Life 8:341-356. 48. Klavins, E. (2004) Universal self-replication using graph grammars. In Proceedings of the 2004 International Conference on MEMS, NANO and Smart Systems (ICMENS 2004), pp.198204. 49. Klavins, E., Ghrist, R. & Lipsky, D. (2004) Graph grammars for self-assembling robotic systems. In Proceedings of the 2004 IEEE International Conference on Robotics and Automation (ICRA’04), vol. 5, pp.5293-5300. 50. Kniemeyer, O., Buck-Sorlin, G. H. & Kurth, W. (2004) A graph grammar approach to artificial life. Artificial Life 10:413-431. 51. Kurth, W., Kniemeyer, O. & Buck-Sorlin, G. H. (2005) Relational growth grammars – A graph rewriting approach to dynamical systems with a dynamical structure. In Proceedings of the 2004 International Workshop on Unconventional Programming Paradigms (UPP 2004) Lecture Notes in Computer Science 3566, Springer, pp.56-72. 52. Nehaniv, C. L. (2004) Asynchronous automata networks can emulate any synchronous automata network. Intl. J. Algebra & Computation 14:719-739.