npg Bayesian networks for deep sequencing data
440
LETTER TO THE EDITOR
Cell Research (2013) 23:440-443. © 2013 IBCB, SIBS, CAS All rights reserved 1001-0602/13 www.nature.com/cr
A novel Bayesian network inference algorithm for integrative analysis of heterogeneous deep sequencing data Cell Research (2013) 23:440-443. doi:10.1038/cr.2013.8; published online 15 January 2013
Dear Editor, Next Generation Sequencing (NGS) technology has enabled sequencing millions of short DNA tags in a single pass. NGS-based techniques such as ChIP-Seq/ BS-Seq (Chromatin Immunoprecipitation/Bisulfite conversion followed by deep sequencing) have become predominant approaches for genome-wide quantification of transcription factor binding sites, histone modifications/ variants and DNA methylation [1]. The rapidly increasing volume of ChIP-Seq and other deep sequencing data calls for the urgent need of developing analytical tools for processing these data and extracting meaningful biological knowledge from them. Till now, a number of software tools that are designed to map tag sequences to the genome [2] or to find “peak” chromosomal regions with enriched mapped tags [3] have been readily available, yet tools that target the primary goal of generating testable biological hypotheses directly from NGS data barely exist. A general question in the analysis of NGS data is how to de novo infer the combinatorial interactions (and if possible, their causalities) between different factors probed by ChIP-Seq experiments (e.g., transcription factors, histone modifications) and/or other factors probed by non-ChIP-Seq experiments (e.g., RNA-Seq, BS-Seq). For example, recently it was demonstrated that distinct genomic elements are cooperatively marked by histone modifications/variants and DNA methylation, which form so-called combinatorial chromatin states [4]. However, few software tools are designed for directly reverse engineering the molecular interactions that give rise to the combinatorial chromatin states. To address this, we developed a new Bayesian network (BN) structure learning algorithm “SeqSpider”, for inferring regulatory relationships/interactions between a set of biological factors using heterogeneous NGS data sets of different types (discrete/real/profile) generated by the same or different laboratories. BN is an ideal probabilistic formalism for inferring regulatory networks [5]. By systematically searching for
the global network that best fits the data, it can disambiguate direct/indirect interactions and de novo identify potentially causal relationships, which are not possible in correlation-based network inference algorithms. However, most practical BN learning algorithms only accept discrete training data (c.f. systems biology applications of these algorithms [6-8]). This limitation is even more conspicuous when BN is applied to NGS data as these algorithms cannot model tag distributions, an important feature of NGS data. This problem is completely resolved by the SeqSpider algorithm, which simultaneously accepts tag distributions as well as discrete/continuous variables. Together with a profile-based clustering strategy for noise reduction, SeqSpider successfully predicted with high accuracy and high stability the molecular interactions in human embryonic stem cells (hESCs) from heterogeneous NGS data sets generated by three different laboratories [9, 10] (ChIP-Seq of seven histone modifications and seven transcription factors, BS-Seq and RNA-Seq data). On the contrary, the accuracy and stability achieved by conventional discrete data-based BN learning algorithms [11, 12] are significantly lower on the same data sets (see below and Figure 1). An example demonstrates the unique advantage of SeqSpider for seamlessly integrating multi-source and multi-type NGS data to infer a regulatory network for a certain cellular context, in this case, the self-renewing hESCs (Figure 1A). This advantage mainly comes from two technical innovations. First, we proposed a new kernel function for sequence tag distributions (termed the “L1 reciprocal partial sums” (L1-RPS) kernel, see Supplementary information, Methods) to enable BN learning from tag profiles (as vectors) in addition to discrete and continuous data. A kernel can be seen as an inner product (an operation on two vectors that produces a scalar) in a high/infinite dimensional feature space. By incorporating the L1-RPS kernel in an optimized implementation of a kernel-based BN scoring approach [13], the information stripping data discretization step in the conventional BN learning methods [11] is avoided (Supplementary information, Methods S1). Second, we exploited the “Super Cell Research | Vol 23 No 3 | March 2013
npg
Yi Liu et al. npg 441
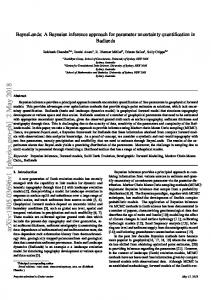
Figure 1 Comparing SeqSpider with conventional BN learning algorithms on predicting the hESC regulatory network from NGS data sets. (A) The consensus hESC regulatory network inferred by SeqSpider. The color of an edge indicates the Pearson correlation coefficient (PCC) between the total tag counts within TSS ± 2Kb (or TTS ± 2Kb for H3K36me3) for the two interacting nodes. (B) Stability of the consensus network inferred by SeqSpider (as shown in (A), panel f) compared with alternative implementations using different types of training data with/without profile clustering (other panels). Network stability curves are evaluated on 10-fold incomplete training samples. SeqSpider algorithm works on “combined vectored data”, whereas the conventional BN algorithm [11, 12] works on “discretized data” and the original kernel-based BN algorithm [13] works on “real-valued data”. (C) Significance of literature cocitation rates for networks inferred by different algorithms and on distinct types of data (null/sk/k-means/ap: no clustering/the super kmeans/the classic k-means/the affinity propagation algorithm-based profile clustering is performed; vec/real/dis: vectored/real-valued/ discrete training data). (D) Joint validations of the hESC regulatory network in (A) and two cellular context-dependent/independent motif networks. P-values indicate the statistical significance of network overlaps. (E) The P-values for the overlap between general motif interaction networks and the hESC epigenome-based regulatory networks. “cons/uncons” indicates whether a motif network is learned using the hESC regulatory network in (A) as a structural constraint, also see (C) for other notations of different algorithms. (F) Prototype of information flow of the network in (A). The input from one modification or enhancer activity that feeds into H3K4me3 at TSS will lead the information to flow out of the hub and engage other modifications or enhancers.
www.cell-research.com | Cell Research
npg Bayesian networks for deep sequencing data
442
k-means” algorithm to cluster genes with similar TF/ modification patterns (represented by concatenated genewise tag profiles and expression value) to reduce noise and sampling biases in training data (Supplementary information, Methods S1). By applying this profile-based clustering step and then learning BN on the resulting cluster centers, SeqSpider achieves significantly better stability and accuracy in network inference than conventional methods [11, 12] and the original kernel-based BN algorithm on real-valued data [13] (Figure 1B, 1C, and 1E, Supplementary information, Note S2). SeqSpider employed 10-dimensional vectors with uniform bins to represent the ChIP-Seq and BS-Seq signal at (– 2 kb, + 2 kb) around each TSS (or TTS for H3K36me3), and one-dimensional continuous variable to represent gene expression levels. The value in each element of a vector is the log-transformed and standardized (zscore normalized) tag count (Supplementary information, Methods S1). Then, we thoroughly compared SeqSpider with the existing BN learning algorithms that only accept discrete/continuous data [11-13] with/without the profileclustering step. To evaluate the performance of different BN learning algorithms, two criteria are used: network stability on partial training data [7] and literature co-citation rate for network edges. The results suggest that both the modeling of tag distributions and the profile-clustering step for data preprocessing are necessary for SeqSpider to achieve significantly better performance than conventional algorithms (Figure 1B and 1C). We also tested alternative implementations of the two key components in SeqSpider, either using the classic k-means (in Cluster 3.0)/affinity propagation [14] algorithm for profileclustering or using two other ways to define the kernel for tag distributions. The results suggest that the performance of these alternative methods could not match the level of the SeqSpider algorithm (Figure 1C, Supplementary information, Notes S2 and S13). Testing results also demonstrate that the output of SeqSpider is robust to the choice of both the single customizable parameter (the weight of the penalty term in scoring function) and the internal parameter (kernel widths); and the learned network is not overfitted to training data (Supplementary information, Notes S3, S11 and S12). In addition to the significantly higher literature cocitation rate in hESC regulator network inferred by SeqSpider compared with alternative algorithms (Figure 1C), the network is further supported by the cellular context-independent, genomic sequence-based motif interaction BN, as demonstrated by the significant overlap between the two networks (Figure 1D, P = 0.0067). Pairwise comparison on the significance of network overlaps further demonstrates that SeqSpider performs the best
among all alternative algorithms tested (Figure 1E). Furthermore, by taking the regulator BN as template, we also learned a constrained motif interaction network using SeqSpider, revealing sequence motifs that potentially mediate the regulator interactions in the hESC context (Supplementary information, Figure S22). The unconstrained/constrained motif networks overlap well (Figure 1D and 1E, P = 6.15E-8) and both of them are further validated by independent evidence, the spatial closeness of motif locations in the promoter regions (Supplementary information, Figure S23). The regulator network brought new biological insights into hESCs. First, NGS data from different laboratories and of different types [9, 10] are fully intermingled in the network according to their biological relationships (Figure 1A, Supplementary information, Note S4). Second, H3K4me3, which directly correlates with gene expression, stays at the center of the network and connects six major regulatory domains. Both the domain structures and 87.5% edges in the network have been reported in literature (except two edges: H3K27me3-H3K9ac, NANOG-TAFII) (Figure 1A, Supplementary information, Note S4). Third, although this network does not include directed edges, SeqSpider’s capability of correctly predicting causal relationships is proven theoretically and demonstrated on a CD4+ T-cell ChIP-Seq data set [1, 7] (Supplementary information, Note S14). The star-shaped topology of the hESC network is further demonstrated by an independent mESC network, by a larger hESC network with more recent ChIP-Seq data and by networks learned from different groups of promoters (Supplementary information, Notes S15, S16 and S17). According to BN theory, this topology indicates that any input arrow pointing toward H3K4me3 will lead to outward flow toward all other branches, implicating dynamic communication among these regulatory domains (Figure 1F, Supplementary information, Note S5). Though this is still a hypothesis, the bidirectional nature of one edge H3K4me3-Oct4 has recently been demonstrated experimentally in hESC [15]. The difference of the connectivity and directionality of edges around H3K4me3 between the hESC and the CD4+ T-cell network is likely to reflect the diverse regulatory program in the two cell types (Supplementary information, Note S8). Finally, we found that the missing of a few known regulatory relationships in the hESC network is not the fault of SeqSpider, but simply because they are not well supported by the NGS data sets or due to BN’s acyclic constraint. To relax the acyclic constraint, we developed a post-BN learning graph search method, which successfully recovered some known interactions otherwise missed (Supplementary information, Methods S1, Notes S18 and S19). Cell Research | Vol 23 No 3 | March 2013
Yi Liu et al. npg 443
To conclude, by modeling sequence tag distributions and introducing the profile-clustering strategy for noise reduction, SeqSpider achieved significantly better performance than previous BN algorithms for inferring a regulatory network from NGS data sets, and allowed for the first time seamless integration of heterogeneous data types from different sources. Given the fast growing volume of NGS data, SeqSpider (http://www.picb.ac.cn/ hanlab/seqspider.html) will become an important tool for reverse-engineering regulatory networks of various biological contexts.
Acknowledgments This work was supported by grants from the National Natural Science Foundation of China (30890033 and 91019019), the Ministry of Science and Technology of China (2011CB504206) and Chinese Academy of Sciences (KSCX2-EW-R-02, KSCX2-EWJ-15 and XDA01010303) to J-D JH, and from Beijing Jiaotong University (K12RC00090) to YL.
Yi Liu1, 2, 3, *, Nan Qiao1, 2, 4, *, Shanshan Zhu1, 2, Ming Su1, 2, 4, Na Sun1, 2, 4, Jerome Boyd-Kirkup1, Jing-Dong J Han1 1
Chinese Academy of Sciences Key Laboratory of Computational Biology, Chinese Academy of Sciences-Max Planck Partner Institute for Computational Biology, Shanghai Institutes for Biological Sciences, Chinese Academy of Sciences, Shanghai 200031, China; 2Center of Molecular Systems Biology, Institute of Genetics and Developmental Biology, Chinese Academy of Sciences, Beijing 100101, China; 3School of Computer and Information Technology, Beijing Jiaotong University, Beijing 100044, China; 4 Graduate University of Chinese Academy of Sciences, Beijing 100049, China *These two authors contributed equally to this work.
www.cell-research.com | Cell Research
Correspondence: Jing-Dong J Han E-mail:
[email protected]
References Barski A, Cuddapah S, Cui K, et al. Cell 2007; 129:823-837. Li R, Yu C, Li Y, et al.Bioinformatics 2009; 25:1966-1967. Zhang Y, Liu T, Meyer CA, et al. Genome Biol 2008; 9:R137. Ernst J, Kellis M. Nat Biotechnol 2010; 28:817-825. Koller D, Friedman N. Probabilistic Graphical Models - Principles and Techniques: MIT Press 2009. 6 Sachs K, Perez O, Pe’er D, et al. Science 2005; 308:523-529. 7 Yu H, Zhu SS, Zhou B, et al. Genome Res 2008; 18:1314-1324. 8 van Steensel B, Braunschweig U, Filion GJ, et al. Genome Res 2010; 20:190-200. 9 Lister R, Pelizzola M, Dowen RH, et al. Nature 2009; 462:315-322. 10 Ku M, Koche RP, Rheinbay E, et al. PLoS Genet 2008; 4:e1000242. 11 Heckerman D, Geiger D, Chickering DM. Mach Learn 1995; 20:197243. 12 Steck H. Learning the Bayesian network structure: dirichlet prior vs data. In: McAllester DA, Myllymaki P, eds. Proceedings of the 24th Conference in Uncertainty in Artificial Intelligence. Helsinki, Finland: AUAI Press 2008:511-518. 13 Bach FR, Jordan MI. Learning graphical models with Mercer kernels. In: Becker S, Thrun S, Obermayer K, eds. Advances in Neural Information Processing Systems. Vancouver, Canada: MIT Press 2002:1009-1016. 14 Frey BJ, Dueck D. Science 2007; 315:972-976. 15 Ang YS, Tsai SY, Lee DF, et al. Cell 2011; 145:183-197.
1 2 3 4 5
(Supplementary information is linked to the online version of the paper on the Cell Research website.)
This work is licensed under the Creative Commons Attribution-NonCommercial-No Derivative Works 3.0 Unported License. To view a copy of this license, visit http:// creativecommons.org/licenses/by-nc-nd/3.0