A Novel Multi-Objective Optimisation Methodology Applied to the Synthesis of CMOS Operational Amplifiers Ricardo Salem Zebulum §
Marco Aurélio Pacheco ‡
Marley Maria Vellasco ‡
§ Jet Propulsion Laboratory, 4800 Oak Grove Drive, Pasadena, California 91109,
[email protected] ‡ ICA:
Núcleo de Pesquisa em Inteligência Computacional Aplicada, Dep. de Engenharia Elétrica, PUC-Rio, Cx. Postal: 38063, Rio de Janeiro, Brasil, email:
[email protected]
Abstract: The task of CMOS operational amplifiers (OpAmps) design optimisation is investigated in this work. When this task is analysed as a search problem, it can be translated into a multiobjective optimisation application, in which various OpAmps’ specifications have to be taken into account, i.e, GBW (gain-bandwidth product), area, power consumption, phase margin and others. In this work, we introduce the genetic algorithm search technique and apply it to the proposed problem. A novel multi-objective optimisation strategy, based on artificial neural networks learning paradigms, is embedded in our genetic algorithm. We focus on the optimisation of four different analog cells, which include low-power operational amplifiers.
1 – Introduction Although constituting only a small part of the total area of modern chips, analog circuitry is usually the liming factor of their overall performance [8]. The current trend towards the achievement of low-power, low-area and high-speed analog cells may increase the complexity of VLSI analog design, if hard specifications have to be met. This constitutes the major motivation of our work. We address this problem as multi-objective optimisation task, propose a novel methodology based on Genetic Algorithms, and applied it to CMOS operational amplifiers design optimisation. Genetic Algorithms (GAs) [5] have already been employed in many Computer Aided Design (CAD) problems for digital circuits optimisation [3][12]. This search technique can be successfully applied to a class of optimisation problems in which the search space is too large to be sampled by conventional methods [5]. In the particular context of this application, the GA will
perform cell sizing,
i.e., search for transistor sizes, biasing currents and compensating
capacitance values that meet a set of design requirements. As a highly multi-objective problem, which involves the sampling of a large search space, a compromise among gain, dissipation, area and other factors must be achieved. We devise a new multi-objective optimisation technique to handle this task. We test our methodology in two classes of problems: the design of a standard Miller Operational Tranconductance Amplifier (OTA) cell and the design of low-power cells. In the latter, three different OpAmp’s topologies are used as a test-bed for our optimisation system. The results are compared with human- made designs and standard low-power techniques. Four additional sections compose this work: section 2 discusses the problem of OpAmp design optimisation and reviews basic concepts related to CMOS transistors operating regions; section 3 describes the methodology used by the authors to cope with this problem; section 4 presents the case studies; and section 5 concludes this work.
2. - OpAmp Design Optimisation Whereas in bipolar based circuits the designer’s creativity is used to the conception of different topologies, in the case of CMOS design the creativity is used to set the transistors’ sizes of a particular topology, and, as a consequence, select their operating regions [8]. OpAmp design optimisation encompasses a large set of specifications or objectives (around 20) which should be considered along the design process [8]. Nevertheless, only the most important specifications are effectively incorporated into the design methodologies, constituting the design plan. It is important to decide beforehand which specifications should take part in the design plan, as well as the relative importance of each specification. It is common that, when a
circuit is optimised to fulfil only one or two specifications, the other characteristics may become nonsense. Human design relies on the solution of a system of equations [6]. However, when many objectives are included in the system, many solutions may exist. It is usually up to the designer to assess which solution fits better according to the relative importance of each objective. When cell sizing is performed, each point of the design space consists of the transistors’ sizes, biasing current and compensating capacitance of a target circuit topology. By setting the transistors’ sizes and biasing currents, the MOS transistors operating regions are determined. MOS transistors may operate in strong, weak and moderate inversion. The strong inversion region, in which VGS – VT N is greater than 0.2 Volts, is the most commonly used in analog design. The weak inversion region, in which VGS – VT N is around 100 mV, is characterised by the low power consumption of the device, being usually employed in micro-power applications. Nonetheless, the use of this operating region also results in the following drawbacks: low speed of the device, increase in its area, and reduction of the load driving capacity [8]. Another way to characterise the weak (and moderate) inversion region is through the following equation: ID
?
2 ?n ? U T
2
(1 )
Where ? is proportional to the transistors’ dimensions W/L, UT is the thermal voltage (26mV at 300K) and n manufacturing features.
takes values between 1 and 1.5, according to some transistor
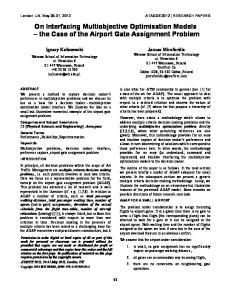
3 - Optimisation Methodology The authors approach to the OpAmp design optimisation employs Genetic Algorithms (GAs), a search technique with the potential to perform an efficient exploration over a large design space [3][5]. GAs carry out optimisation through biological evolution simulation. Instead of focusing on just one potential solution to the problem, they sample a population of potential solutions. A population of individuals is initially randomly generated. Each individual is a string that encodes, by means of a particular mapping, a potential solution to the problem. The GA performs then operations of selection, crossover and mutation over the individuals, corresponding respectively to the principles of survival of the fittest, recombination of genetic material and mutation observed in nature. The selection step is probabilistic, but it favours individuals which have been assigned higher fitness indexes, in an evaluation step performed beforehand. The fitness is a scalar measure of the performance of an individual according to the problem specification. The crossover operator splices the contents of two randomly chosen strings, producing two new individuals or offsprings. The mutation operator changes a particular string position at random and it is applied with a low probability [5]. The optimisation process is carried out through the generation of successive populations until a stop criteria is met. The basic GA flow is illustrated in Figure 1. Since genetic algorithms are stochastic, many executions are necessary to achieve significant results. Following, we provide a description of the individual
representation and evaluation
methods used by the genetic algorithm to tackle the problem at hand. 3.1 – Representation In the particular domain of our problem, each genetic algorithm string (also called chromosome) encodes an operational amplifier by means of a particular mapping. The
representation thus refers to the way this mapping is performed. A sized CMOS operational amplifier can be characterised by a list of real numbers representing transistors sizes, biasing current, and, if it is the case, a compensating capacitance. Each OpAmp feature is represented in a chromosome integer string, so that each string element serves as pointer to the actual OpAmp feature value. This representation is illustrated in Figure 2. The functions f i, shown in this figure, perform a simple conversion, whose general expression is given by:
f : ?? ? x y ? ? k1 , k2
x ? (0,1,...,N ? 1);
y ? [Cmín , Cmáx ]
(2)
In the above expression, y and x are the actual value taken by the OpAmp feature and the value of the associated string position, respectively. While each string position can assume N different integer values, each amplifier feature is constrained to values between Cmín and Cmáx. These constraints are set according to the referred feature and to the technology being used. For instance, if the feature is a particular transistor width, Cmín and Cmáx will stand for the minimum width allowed by the technology, Wmín , and the maximum width chosen by the user, Wmáx . The constants k 1 and k 2 are set in order to make the conversion between x and y. One of the most important aspects in choosing a particular representation is the amount of previous designer knowledge used in it. Our representation requires the designer to supply minimum and maximum constraints, Cmín and Cmáx , for each amplifier feature. Furthermore, in order to avoid meaningless OpAmps, the differential input pairs and current mirrors are also constrained to have the same sizes, as illustrated in Figure 2. If compared to other evolutionary electronic applications [6], our system uses less amount of previous knowledge.
3.2 – Evaluation The main challenge of applying genetic algorithms or any other optimisation technique to this problem is its multi-objective nature. Multi-objective optimisation concerns the need to integrate vectorial performance measures with the inherently scalar way in which most optimisation techniques rewards performance. Because genetic algorithms require scalar fitness information on which to work, a scalar transformation of the objective vectors is always necessary [4]. CAD problems of electronic circuits
are usually intrinsically multi-objective, being
artificially decomposed in single-objective optimisation problems. Recent ly, some GA based tools have been produced to tackle multiple objective problems in the digital domain: the software EXPLORER [3] is a tool used to minimise chip layout area, deviation from a target aspect ratio, routing congestion and maximum path delay in VLSI cells. No standard technique to multi-objective optimisation has been achieved so far; surveys on this issue can be found elsewhere [4]. After testing some standard methods, the authors developed a new one that suited better to OpAmps’ optimisatio n. As it will be observed, our method is based on artificial neural networks learning algorithms [2]. Given a population of individuals, each one encoding an operational amplifier in the way shown previously, a measure of performance or fitness is assigned to each individual in the following way:
Fitness ?
n
?
i? 1
wi Fnormi
(3)
According to the above equation, the fitness is computed by a weighted sum, where w is a weight vector, n is the number of objectives and Fnorm is the normalised fitness vector. This vector is defined by:
Fnorm i ?
Fi Fi
( 4)
Fi is the actual score of an individual with respect to a particular objective i, whereas the denominator of the above equation represents the average fitness over all the individuals of the population with respect to the same objective. This normalisatio n is accomplished to account for the fact that the objectives are measured in different units (decibels, Hertz, etc) and all of them must have the same influence in the fitness expression. The main problem of this approach is the one of setting the weights’ values. It is desirable to use a strategy in which the weights are dynamically updated according to the level of satisfaction of each objective during evolutionary search; and also to take into account the user’s specifications (design plan) for each particular objective. Based on these guidelines, the following weight updating equation has been formulated:
w i ,t ? 1 ? ? ? w i , t ? (1 ? ? ) ? e i , t
( 5)
The above equation uses an additional temporal index t, which points to a particular generation of individuals. Hence, wi,t+1 is the next value of the weight associated to objective i. It is computed using its present value, wi,t , and an error measure ei,t. This equation is based on the Backpropagation learning algorithm for Artificial Neural Networks (ANN) [2]. The term ? used in equation 5 can take values from 0 to 1, and will balance the contribution of the error and of the current weight value to the weight update. This term is analogous to the momentum term used in
the Backpropagation algorithm, which is related to the stability of the learning process [2]. The error ei,t provides a measure of the overall system performance for the particular objective i in a particular instant t, and it is computed by:
ei , t ?
| F i , t ? User i | User i
(6)
Where Useri represents the user specification for objective i. Therefore, the error is calculated by the difference between the average value for objective i over all individuals and the user specification. All the weights are initialised with an equal arbitrary absolute value: if the correspondent objective needs to be minimised, the weight must take a negative initial value, and a positive value if the correspondent objective needs to be maximised. Through experimentation, we have found out that a value of ? =0.7 (Equation 5) produces better results.
4 – Case Studies We describe two classes of experiments in this section: the design optimisation of a Miller OTA cell [8] and of low power cells [9][11], respectively. The SMASH simulator [10] has been used to evaluate the OpAmps’ performance.
4.1 – Miller CMOS OTA The Miller OTA is a two stage amplifier whose compensation capacitance introduces the Miller effect, and presents a low output impedance for most of its frequency range [8]. We apply a genetic algorithm together with the multi-objective strategy defined previously to optimise gain,
GBW, power consumption, area and phase margin. These performance statistics have been measured through simulation by small signal and operating point analysis. The genetic algorithm manipulates the transistors’ sizes, biasing current and compensating capacitance through the chromosome representation shown in section 3.1. The values of k 1 and k 2 (Equation 2) define low and upper boundaries for the variables manipulated by the genetic algorithm. The transistors’ dimensions, W and L, may take values between 5? m and 105? m with a step of 1? m (using k 1 = 1 and k 2 = 5). The biasing current, IB , may take values between 1.5? A and 2.5? A with a step of 0.01? A (using k 1 = 100 and k 2 = 1.5). Finally, the compensating capacitance CP may assume values between 1pF and 6pF, with a step of 0.05pF (using k 1 = 20 and k 2 = 1). As described in section 3.2, the multi-objective evaluation strategy uses a vector of objectives’ specifications supplied by the user. For this particular case, the specifications have been set to: minimum of 80dB DC gain, minimum GBW of 2MHz, maximum power consumption of 200? W; maximum area of 5,000? m2 1 ; and minimum phase margin of 70o . Table 1 provides a comparison between a human made design [8] and the best design obtained by the gene tic algorithm. The schematics of these two cells are shown in Figure 3. From Table 1, it can be seen that the genetic algorithm arrived at an OpAmp with performance statistics close to the specified values, which were deliberately set hard to be achieved simultaneously. Comparing to the hand made design, we can observe that they present similar gain and GBW statistics. (The GA procedure could be modified in order to meet the gain and GBW specification but disregarding other specifications). However, the OpAmp synthesised by the GA features less than half of the dissipation observed in the hand made design, at an 1
The OpAmp area has been estimated in a simplified way, just by computing (? W.L + 1,000CP ) over all transistors. The second term takes into account the influence of the compensating capacitance in the area.
expense of a larger area. This is due to the design plan chosen in this particular case. The phase margin achieved by the GA cell is lower than the human made one. If stability is critical in the OpAmp application, the phase margin can be further improved by increasing the Miller capacitance, thus affecting the OpAmp area total (? W.L + 1,000CP ). The slew-rate has not been taken into account as an objective of the genetic algorithm, because its measure requires time consuming transient analysis. Nevertheless, the obtained values (2.05V/? s and -1.82V/? s) compare well with the hand made ones, taking into account that the GA cell dissipates much less than the human made counterpart. Features Human Made GA Design Space ----------------------1024 Gain 71.2dB 72.7dB GBW 2MHz 1.6MHz Slew-Rate 3.78 V/? s; -1.56V/? s 2.05V/? s;-1.82V/? s IB 2.50 ? A 2.31? A CP 1 pF 1.15 pF Power 527.8 ? W 237.9 ? W 2 Area 1,929? m 3,020 ? m2 o Phase Margin 65 55o Technology 3 ? n-well 3 ? n-well RL 100k 100k CL 10pF 10pF Table 1 – Comparison between a hand- made operational amplifier [6] and one synthesised by the Genetic Algorithm. In this case study, the design search space is constituted of 1024 possible OpAmps (Table 1). Nonetheless, the genetic algorithm sampled only 90000 cells, by running 10 executions with a population of size 30 along 300 generations. This illustrates one of the most important features of a genetic algorithm, which is its efficiency in sampling large search spaces [5].
Figure 3 depicts the hand made and the GA cells. Transistor pairs (T1,T2), (T3,T4) and (T7,T8) have been constrained to have equal sizes. It has been verified that the GA design followed the hand made in these respects: 1. High value of (W/L)6 , since the gain is proportional to the transconductance of transistor T6, which is proportional to W/L [8]; 2. (W/L)1 > 1, since the gain is also proportional to the transconductance of transis tor T1; 3. High value of (W/L)5 , which improves the output swing; The GA arrived at these design strategies without any kind of previous knowledge being supplied to the system, except the equal size constraint imposed to the differential input pairs and current mirrors transistors. This illustrates the GA’s potential of rediscovering human made design rules. However, in order to clearly demonstrate its potential, these constraints would have to be dismissed and verified if the GA is able to reach such design rule. The curves of Figure 4 show the average values taken by the objectives included in the design plan along the genetic algorithm execution. It can be observed that the GA tries to minimise the area and maximise the phase margin, while trying to keep the other objectives around the specified design plan. 4.2 – Low-Power OpAmp Design Our experiment in low-power design have focused on three topologies: class A operational amplifier, operational transconductance amplifier (OTA) with simple output, and OTA with Cascode output. The representation and evaluation were similar to the one used for the Miller OTA design. Concerning the representation, the transistor dimensions, W and L, may take values between 2? m and 102? m with a step of 1? m (using k 1 = 1 and k 2 = 2) for the OTAs’ cells; and
values between 3? m and 103? m with a step of 1? m (using k 1 = 1 and k 2 = 3) for the class A OpAmp. The difference is due to the fact that distinct technologies are used. The biasing current IB may take values between 0.01? A and 1? A with a step of 0.01? A (using k 1 = 100 and k 2 = 0.01). Finally, the compensating capacitance of the class A OpAmp, CP , may assume values between 1pF and 6pF, with a step of 0.05pF (using k 1 = 20 and k 2 = 1). The fitness evaluation function has been designed to optimise gain, GBW, output bias, power consumption, area and phase margin. The design plan (Minimum gain, Minimum GBW; Maximum output bias voltage; Maximum power consumption; Maximum area; Minimum Phase Margin) has been set to: (120 dB ; 300 kHz; 0.1 V; 8? W; 7,000? m2 ; 65o ) for the class A OpAmp; (80dB, 200 kHz ; 0.05 V; 10? W; 5,000? m2 ; 70o ) for the simple OTA; and (120dB, 200 kHz ; 0.05 V; 10? W; 15,000? m2 ; 70o ) for the cascode OTA. Contrasting to the Miller OTA experiments, the measures have now been carried out in an open- loop configuration. Therefore, another objective had to be included, the minimisation of the absolute value of the bias output voltage 2 . The level 5 CMOS transistor model, which simulates more accurately the weak inversion region, has been used in these experiments. Table 2 displays the performance statistics of the best amplifiers obtained in these experiments; and Figures 5, 6 and 7 depict the schematics of the best Class A, OTA and Cascode OTA cells respectively. Typical low power class A operational amplifiers found in the literature [1][9] present the following average statistics: 115 dB gain, gain-bandwidth product of 170 kHz , phase margin above 45o , slew -rate of 120 mV/? s, area around 20000? m2 , power consumption around 5? W and a compensating capacitance of 2 pF. Our design plan sought for a better balance
2
A voltage controlled source was used to remove bias in the Miller OTA experiments; Refer to [8] for details.
between dissipation and area, and the best cell performance is shown in the first column of Table 2 (schematics shown in Figure 5). It is a common low-power design strategy to place transistors T1, T2 and T6 in weak inversion, in order to improve the gain. In contrast, the synthesised cell uses T1 and T2 in moderate inversion, using T6 in strong version (Equation 1). It can also been observed that the amplifier bandwidth is increased as a result of the zero introduced by the active resistor implemented by transistors T9 and T10. Features Design Space Gain GBW Bias Output Offset Slew-Rate
Class A Simple OTA Cascode OTA 32 34 10 10 1044 140.6 dB 63.6 dB 88.5 dB 1MHz 200 kHz 150 kHz 9.4 mV 1.3 mV 0.85 mV -2.49 mV 34.6 nV 3.37 nV 210mV/? s; 100mV/? s; 89mV/? s; -232mV/? s -80mV/? s -76mV/? s IB 0.98 ? A 0.10 ? A 0.16 ? A CP 2.1 pF -----------------------Power 14.1 ? W 1.4 ? W 8.65 ? W 2 2 Area 9,029 ? m 3,343 ? m 7,189 ? m2 o o Phase Margin 65 65 57o Technology 3 ? Marin 1.2 ? AMS 1.2 ? AMS CL 3 pF 3 pF 10 pF Table 2 – Results of the synthesis of three low-power operational amplifiers: Class A, Simple OTA and Cascode OTA. Typical low power OTA cells found in the literature [1][6][9] present the following average statistics: 65dB gain, gain-bandwidth product of 300kHz , phase margin of 60o , slew rate of 120mV/? s, area around 5000? m2 and a power consumption around 5 ? W. The GA arrived at a cell with smaller area and power consumption, whilst keeping comparable values for the other statistics. It is a conventional strategy to place the input differential pair in weak inversion. The cell designed by the GA has the input pair and transistor T6 in weak inversion. This is expected, as the gain is also proportional to the transconductance of T6 (the higher W/L the higher the transconductance [8]).
Typical low power Cascode OTA cells found in the literature [1][6][7][9] present the following statistics : gain around 100 dB, gain-bandwidth product of 100 kHz , phase margin of 70o , slew-rate of 50 mV/? s, area around 10000? m2 and a power consumption around 5 ? W. The GA cell achieved better GBW, slew rate, and area statistics, at the expense of slightly worse values for gain, phase margin and power consumption. In contrast with usual low-power design guidelines for this kind of cell, the differential input pair is not working in weak inversion in this particular case.
5 – Conclusions We presented a tool that performs operational amplifier sizing using minimal human knowledge. Particularly, we focused on low-power analog cells, which is an important industrial trend. In order to tackle this multi-objective optimisation problem, we applied genetic algorithms together with a new strategy for multiple-objective assessment. Given a design plan supplied by the user, this tool performs an efficient search over the design space. Our methodology was able to rediscover a human made Miller OTA design, enhancing it by reducing the power consumption. In the case of Class A and Cascode OTA cells, the design plan consisted of finding cells with balanced area and dissipation statistics. Finally, a simple OTA cell has been achieved that is better both in area and dissipation than conventional designed ones. References [1] -Allen, P.E., Holberg, D. R., “CMOS Analog Circuit Design”, Holt, Rinehart and Winston editors, 1987. [2] - Churchland, P. S., Sejnowski, T. J., ``The Computational Brain'', MIT Press,1992. [3] - Esbensen, H., Kuh, E., "EXPLORER: An Interactive Floorplanner for Design Space Exploration", Proc. of the European Design Automation Conference, pp.356-361, 1996. [4] - Fonseca, C. M, Fleming P. J. , "An Overview of Evolutionary Algorithms in Multiobjective Optimization”, Evolutionary Computation Journal, MIT Press, Vol. 3, No. 1, pp. 1-16, 1995.
[5] - Goldberg, D. E., "Genetic Algorithms in Search, Optimization and Machine Learning", Addison-Wesley, 1989. [6] - Kruikamp, W., Leenaerts, D., "Darwin: CMOS opamp Synthesis by means of a Genetic Algorithm", 32nd Design Automation Conference, pp. 433-438, CA, USA, 1995. [7] - Krummenacher, F., "High Voltage Gain CMOS OTA For Micropower SC Filters", Electronic Letters, 19th February, Vol. 17, No. 4, pp.160-162, 1981. [8] - Laker, K. R., Sansen, W., "Design of Analog Integrated Circuits and Systems", Mc.Graw-Hill Inc (eds)., 1994. [9] - Salazar, F. A., "Projeto de Celulas CMOS Analógicas de Baixo Consumo a Partir de Transistores Operando em Inversao Fraca", Msc Thesis, Electrical Engineering Department, Pontifícia Universidade Católica, RJ, Brasil, 1996. [10] – “SMASH User and Reference Manual", Dolphin Integration, France, 1993. [11] - Zebulum, R.S., Pacheco, M.A., Vellasco, M., ”A Multi-Objective Optimisation Methodology Applied to the Synthesis of Low-Power Operational Amplifiers”, proceedings of the XIII International Conference in Microelectronics and Packaging, Vol. 1, Ivan Jorge Chueiri and Carlos Alberto dos Reis Filho (Eds), pp. 264-271, Curitiba, Brasil, August, 1998. [12] – Sanchez E., Tomassini M. (editors), “ Towards Evolvable Hardware: The Evolutionary Engineering Approach”, Lecture Notes in Computer Science 1062, Springer, ISBN 3-540-61093-6, 1996.