Accepted Manuscript A novel multi-objective programming model of relief distribution for sustainable disaster supply chain in large-scale natural disasters Ce-jun Cao, Cong-dong Li, Qin Yang, Yang Liu, Ting Qu PII:
S0959-6526(17)32688-4
DOI:
10.1016/j.jclepro.2017.11.037
Reference:
JCLP 11176
To appear in:
Journal of Cleaner Production
Received Date: 18 March 2017 Revised Date:
30 October 2017
Accepted Date: 6 November 2017
Please cite this article as: Cao C-j, Li C-d, Yang Q, Liu Y, Qu T, A novel multi-objective programming model of relief distribution for sustainable disaster supply chain in large-scale natural disasters, Journal of Cleaner Production (2017), doi: 10.1016/j.jclepro.2017.11.037. This is a PDF file of an unedited manuscript that has been accepted for publication. As a service to our customers we are providing this early version of the manuscript. The manuscript will undergo copyediting, typesetting, and review of the resulting proof before it is published in its final form. Please note that during the production process errors may be discovered which could affect the content, and all legal disclaimers that apply to the journal pertain.
ACCEPTED MANUSCRIPT Word count: 9914 1 A novel multi-objective programming model of relief distribution for sustainable disaster 2 supply chain in large-scale natural disasters a,b
3 Ce-jun Cao , Cong-dong Li
b,a,*
, Qin Yangc, Yang Liu b,d,*, Ting Qub
a
College of Management and Economics, Tianjin University, Tianjin, 300072, China
5
b
Institute of Physical Internet, Jinan University (Zhuhai Campus), Zhuhai, 519070, China
6
c
School of Business, Sichuan Normal University, Chengdu, 610101, China
7
d
Department of Management and Engineering, Linköping University, SE-581 83 Linköping, Sweden
SC
8 *Corresponding Authors:
[email protected] (C.D. Li),
[email protected] (Y. Liu)
RI PT
4
M AN U
9 Abstract To save lives and reduce suffering of victims, the focus here is to design the strategies of 10 relief distribution regarding beneficiary perspective on sustainability. This problem is formulated as a 11 multi-objective mixed-integer nonlinear programming model to maximize the lowest victims’ 12 perceived satisfaction, and minimize respectively the largest deviation on victims’ perceived 13 satisfaction for all demand points and sub-phases. Then, genetic algorithm is proposed to solve this
TE D
14 mathematical model. To validate the proposed methodologies, a case study from Wenchuan 15 earthquake is illustrated. Computational results demonstrate genetic algorithm here can achieve the 16 trade-off between solution quality and computation time for relief distribution with the concern of 17 sustainability. Furthermore, it indicates that the methodology provides the tools for decision-makers
EP
18 to optimize the structure of relief distribution network and inventory, as well as alleviate the suffering 19 of victims. Increasingly, this paper expects to not only validate the proposed model and method, but
AC C
20 highlight the importance and urge of considering beneficiary perspective on sustainability into relief 21 distribution problem.
22 Keywords: Relief distribution; Sustainable disaster supply chain; Victims’ perceived satisfaction; 23 Multi-objective programming model; Genetic algorithm 24 1. Introduction 25 The International Disaster Database (EM-DAT) indicates the total number of both natural disasters 26 and the affected people have steadily increased since 1900s. Such natural disasters pose serious 27 threats to sustainable development of society, economy and ecology, as well as place populations at 28 risk. Particularly, large-scale natural disasters have occurred frequently, resulting in tremendous 1 / 30
ACCEPTED MANUSCRIPT 29 consequences, such as large casualties, property losses, and environmental disruption (Papadopoulos 30 et al., 2017; Anaya-Arenas et al., 2014). For instance, it was estimated that the total number of death, 31 injury, and being missing was respectively at least 69,016, 368,565, and 18,498, as well as direct 32 economic losses exceeded 845.14 billion CNY in the great Wenchuan earthquake (Huang et al., 2015;
RI PT
33 Chen et al., 2013). Since the frequency of large-scale natural disasters increased sharply, to save lives, 34 decrease human suffering, and contribute to development as much as possible, the pressing need for 35 sustainable disaster supply chain (SDSC) remains an issue regardless of increasing contributions in 36 this field. This insight is also supported by Dubey et al. (2016), Haavisto et al. (2014) and
SC
37 Halldórsson et al. (2010).
38 According to the insights of Dubey et al. (2016) and Haavisto et al. (2014), this paper infers that
M AN U
39 SDSC can be regarded as the result of the idea of sustainable development organically being 40 integrated into traditional disaster supply chain (TDSC). To have a better understanding of SDSC, the 41 definition of TDSC ought to be first elaborated clearly. Hoyos et al. (2015), Van Wassenhove (2006) 42 and Altay et al. (2006) clarified that TDSC aimed to employ modern technologies and MS/OR 43 methods to monitor, response, control and manage disasters and their consequences from supply-side
TE D
44 to demand-side by integrating relief resources, human capitals and other necessities, thus mitigating 45 or reducing the catastrophic consequences. On the other hand, Dubey et al. (2016) clarified that 46 TDSC would be guided by sustainable development and ecological balance in the future. In terms of
EP
47 sustainability concerning disaster context, Weerawardena et al. (2010) opined that sustainability in 48 non-profit organization was able to survive so that it can continue to serve its constituency, or being 49 understood roughly as maintaining operations. Ibegbunam et al. (2012) further defined sustainability
AC C
50 as being related to responsible communication and coordination, thus enhancing the responsiveness 51 of disaster supply chain. Haavisto et al. (2013) classified various sustainability expectations into 52 societal, beneficiary, supply chain and program perspective. In this context, SDSC here intends to 53 achieve the coordinated development regarding social, economic and ecological dimensions of 54 sustainability by improving the efficiencies of disaster response strategies, thus saving lives, 55 decreasing human suffering, and contributing to development as much as possible. A similar 56 viewpoint which is that efficient response can drastically reduce the impacts of disasters on society, 57 economy and environment is mentioned by Hoyos et al. (2015).
2 / 30
ACCEPTED MANUSCRIPT 58 In recent several decades, TDSC has received increasing attention from academia and practitioners. 59 Meanwhile, relief distribution as one of the most active topics in TDSC becomes popular 60 (Anaya-Arenas et al., 2014). That may be because 80 percentage of disaster supply chain takes 61 logistic activities into account, which was portrayed by Van Wassenlove et al. (2006). However,
RI PT
62 SDSC remains still in its early stage. Even so, it must be acknowledged that either relief distribution 63 or disaster relief supply chain plays an important role in SDSC (Haavisto et al., 2014). Main 64 differences between TDSC and SDSC may be determined by their motivations, objectives, methods 65 and others. In addition, Camacho-Vallejo et al. (2015) delineated that some of the most commonly
SC
66 sent relief need to be distributed efficiently to the affected areas, thus avoiding increasing death from 67 starvation and disease. Caunhye et al. (2012) also highlighted the significance and necessity of
M AN U
68 efficient distribution of urgent relief after the occurrence of large-scale disasters. What they 69 addressed is consistent with the objectives of SDSC. More precisely, it is one of the ultimate goals of 70 SDSC. Consequently, it can be inferred that the need for relief distribution for SDSC is pressing. 71 Though relief distribution for SDSC has gained increasing attention from academia and practitioners 72 in recent years, it is still in its infancy. Firstly, plenty of research has been done in commercial supply
TE D
73 chain regarding sustainability, but such topic is still very limited in disaster supply chain (Habib et al., 74 2016; Dubey et al., 2016). Besides, most of them discussed sustainability of disaster supply chain 75 during recovery phase with a long-term period. How to interpret the sustainability during response
EP
76 phase with a short-term period is an interesting and promising topic, which is also mentioned by 77 Anaya-Arenas et al. (2014). Secondly, most of researchers were dedicated to presenting the 78 comprehensive dimensions of sustainability of disaster supply chain, developing the corresponding
AC C
79 theoretical framework, as well as testing them by using either empirical or qualitative method 80 (Dubey et al., 2016; Haavisto et al., 2014). In other words, they tried to answer what the indicators to 81 measuring sustainability of disaster supply chain are. But how to characterize these potential 82 indicators in a quantitative manner is considered rarely. Thirdly, as mentioned above, topic on relief 83 distribution is very popular in TDSC. Although some of scholars addressed the importance of this 84 issue in SDSC, how to incorporate some of the indicators to measuring sustainability into relief 85 distribution strategies still needs to be further studied (Haavisto et al., 2014). In addition to that how 86 to formulate relief distribution model with sustainability consideration, and design the corresponding 87 solution strategies can only be found in a few literature. 3 / 30
ACCEPTED MANUSCRIPT 88 In this context, this paper firstly focuses on sustainable disaster supply chain (SDSC), and devotes to 89 describing, characterizing and modelling sustainability with the concern of response phase. In fact, 90 the goals of disaster response to some extent are line with those of recovery activities for a short-term 91 perspective. For instance, during response phase, relief distribution to victims in the affected areas
RI PT
92 aims to save lives, reduce their suffering and others, which are also considered during the short-term 93 recovery activities. Secondly, Carter et al. (2008) clarified that sustainability could be measured by 94 triple bottom line model including social, economic and environmental dimensions. Haavisto et al. 95 (2013, 2014) delineated that societal, beneficiary, supply chain and program perspective was able to
SC
96 elaborate the sustainability of disaster context. An interesting point is that the essence of 97 sustainability defined respectively by social dimension of Carter et al. (2008) and beneficiary
M AN U
98 perspective of Haavisto et al. (2013, 2014) to some extent is very similar. This paper leverages and 99 extends their insights to characterize sustainability of relief distribution in MS/OR manner only from 100 beneficiary perspective, including access, equity, and needs fulfilment aspects. Thirdly, on the 101 condition of considering the access of beneficiaries (victims) and demand points, both equity and 102 needs fulfilment are simultaneously taken into account objective functions. Thus, this problem is
TE D
103 formulated as a mathematical programming model. Then, genetic algorithm (GA) as very popular 104 method in disaster relief operations, whose optimization mechanism is derived from Darwin’s theory 105 of evolution is designed to solve this model (Holland, 1975). And encoding, population, fitness
EP
106 function, selection, crossover, mutation are main operators of GA. 107 The contributions of this paper include three points. Firstly, SDSC different from previous one is the 108 focus of this paper, and beneficiary perspective on sustainability regarding access, equity and needs
AC C
109 fulfilment is quantitatively incorporated into relief distribution problem during response phase. 110 Secondly, an integrated issue concerning relief distribution incorporating multi-stage, multi-depot, 111 multi-destination, multi-item, periodical demands and supplies, insufficient supply and sustainability 112 is considered to provide decisions for disaster managers in practice. Thirdly, relief distribution 113 problem is formulated as a multi-objective mathematical programming model to maximize the 114 lowest victims’ perceived satisfaction (VPS) as well as minimize respectively the largest deviation on 115 VPS for all demand points and sub-phases, thus alleviating victims’ suffering. 116 The rest of this paper is organized as follows: The following section describes the related works on 117 this topic. Section 3 presents problem description in detail. Section 4 formulates this issue as a 4 / 30
ACCEPTED MANUSCRIPT 118 MINLP model. GA with matrix encoding is designed to solve the mathematical programming model 119 in section 5. Section 6 uses case study from Wenchuan earthquake to illustrate the proposed model 120 and algorithm. Finally, implication of the findings and future directions are concluded. 121 2. Literature review
RI PT
122 In recent years, to save lives, reduce victims’ suffering, as well as contribute to development, both 123 relief distribution and sustainable disaster supply chain have been garnering increasingly attention. 124 This paper contributes to literature on the following three aspects.
125 Firstly, one significant issue of this research is sustainable disaster supply chain. Kaivo-oja et al.
SC
126 (2014) and Dubey et al. (2016) portrayed that sustainability as a hot subject was being debated. 127 Different scholars from various fields have no a unified understanding of its definition and essence.
M AN U
128 Indeed, it has different meanings for different contexts. However, sustainability with the concern of 129 disaster or humanitarian context is only considered here. This issue in this context, although critical 130 can only be found in a few literature. For instance, Carter et al. (2008) used triple bottom line model 131 including social, economic, and ecological dimension to define sustainability. Weerawardena et al. 132 (2010) contended that sustainability could be understood as maintaining operations in non-profit
TE D
133 organization. Ibegbunam et al. (2012) mentioned that sustainability of humanitarian supply chain 134 involved responsible communication and coordination. Haavisto et al. (2013, 2014) described and 135 explained the sustainability of humanitarian supply chain from societal, beneficiary, supply chain and
EP
136 program viewpoints. Kuzn et al. (2015) discussed the sustainability of humanitarian supply chain 137 during rehabilitation phase. Dubey et al. (2016) identified the critical features of sustainable 138 humanitarian supply chain as agility, adaptability and alignment. Papadopoulos et al. (2017)
AC C
139 employed Big Data to explain disaster resilience and sustainability of supply chain. 140 Secondly, another critical and fundamental stream is relief distribution problem. Main topics of 141 the extant literature for disaster supply chain include relief distribution, facility location, vehicle 142 routing planning, mass evacuation, and casualty (Hoyos et al., 2015; Habib et al., 2016). The first 143 one is only discussed here. Fiedrich et al. (2000) integrated multi-depot, heterogeneous victims, 144 multi-commodity into resource allocation problem at crucial rescue stage. Sheu (2007) considered an 145 emergency logistics distribution problem simultaneously taking type of relief, vulnerabilities of 146 victims, multi-item, multi-depot, and demand fill rate into account. Balcik et al. (2008) addressed last 147 mile distribution problem of humanitarian relief considering equitable principle, single-depot, 5 / 30
ACCEPTED MANUSCRIPT 148 multi-item, and homogeneous receipts aspect. Huang et al. (2012) concentrated on equitable service 149 of relief supplies to all recipients, and they also captured the factors including single-item, 150 single-depot, sufficient supply. Huang et al. (2015) used demand fill fate to measure the equity of 151 humanitarian relief distribution with the concern of single-item, one-off demand, heterogeneous
RI PT
152 victims. Zhou et al. (2017) considered multi-item, multi-depot, multi-destination, multi-period into 153 emergency resource scheduling problem. Theeb et al. (2017) highlighted an integrated resource 154 distribution problem incorporating features of multi-commodity, multi-depot, multi-period. More 155 details can reference literature Anaya-Arenas et al. (2014), and Habib et al. (2016).
SC
156 Thirdly, this work also contributes to literature on multi-objective optimization and its solution 157 strategies. Hoyos et al. (2015) portrayed that mathematical programming method was very popular
M AN U
158 in the field of relief distribution. In addition to that Holguin-Veras et al. (2013) contended that the 159 multi-objective optimization was a very popular stream in humanitarian logistics. For instance, Lin et 160 al. (2011) developed multi-objective mixed-integer non-linear programming model (MINLP) to 161 minimize total unsatisfied demand, total travel time, and difference in the satisfaction rate, then 162 designed GA as well as decomposition and assignment approach to solve. Wilson et al. (2013)
TE D
163 employed Variable Neighborhood Descent metaheuristic to solve the MINLP model with minimizing 164 the fatalities, suffering and maximizing the efficiency. Huang et al. (2015) formulated emergency 165 resource allocation and distribution as a non-linear programming model to maximize lifesaving
EP
166 utility, minimize delay cost and difference of demand fill rates. Besides, an exact approach is used to 167 solve this model. Zhou et al. (2017) opined that the designed heuristic algorithm performed better in 168 solving multi-objective integer mathematical model, which formulates dynamic emergency resource
AC C
169 scheduling problems. Interested readers can find more details in literature Ozdamar et al. (2015), 170 Zheng et al. (2015a) and Gutjahr et al. (2016a). 171 In summary, Table 1 summarizes the related literature to relief distribution from various perspectives. 172 The first five columns and the seventh column present the already defined features (Anaya-Arenas et 173 al., 2014). ‘Depot’ column shows if a single- or multi-depot is considered into the problem. The 174 eighth column indicates objective functions of the corresponding model, which can be: (1) economic 175 (e.g. minimization of cost); (2) social cost (e.g. equity or similar); (3) rapidity (e.g. minimization of 176 spent time in transporting and distributing relief); (4) live-saving (e.g. minimization of fatalities, 177 managerial utility); (5) covering maximization (e.g. either distance/time or amount, and others); (6) 6 / 30
ACCEPTED MANUSCRIPT 178 others (e.g. delay risk or similar). ‘Model’ column represents the type of mathematical model, 179 including (1) non-linear; (2) linear; (3) integer; (4) mixed-integer; (5) mixed-integer non-linear. With 180 regard to ‘Vic. Feat.’ column, it shows whether or not heterogeneous and homogenous victims are 181 identified in relief distribution. Besides, the feature of victims may not be mentioned. The ‘Equity’
RI PT
182 column indicates if equitable principle is taken into account in relief distribution, and it includes two 183 dimensions, arrival times (AT) as well as amount of relief (RA). The ‘Sustain.’ column denotes 184 whether or not sustainability with the concern of disaster context is considered explicitly. 185 Table 1
187
EP
TE D
M AN U
SC
186 Summary of the literature pertaining to relief distribution of disaster supply chain.
AC C
188 The following conclusions can be made: 189 (1) Differing from commercial supply chain, sustainability regarding disaster context is considered 190 by only a few researchers, and being still in its early stage. They mainly focused on the sustainability 191 during recovery phase with a long-term period from the view point of different aspects. In contrast, 192 beneficiary perspective on sustainability of relief distribution during response phase with a short193 term period is the focus of this paper. 194 (2) Most of them employed empirical or qualitative approach to capture the sustainability. But here 195 MS/OR method is used to characterize sustainability from the point of view of beneficiary, which 196 manifests access, equity, and needs fulfilment. Specifically, the access refers to the differences across 7 / 30
ACCEPTED MANUSCRIPT 197 demand points and victim’s groups (Haavisto et al., 2014). It is regarded as urgency of demand and 198 heterogeneity of victim. Both weights and combinations of survival probability, piecewise decreasing 199 linear, time urgency function are employed respectively to capture them. Furthermore, both needs 200 fulfilment and equity are captured from the point of view of arrival times and amount of relief. Thus,
RI PT
201 victims’ perceived satisfaction (VPS) is used to measure beneficiary perspective on sustainability. 202 Besides, VPS is also treated as the result of equity with the concern of access and needs fulfilment. 203 (3) The extant literature is interested in one or more aspects but all depicted in Table 1. This paper 204 yet tries to take all aspects into account. Specifically, response phase is subdivided into golden rescue,
SC
205 buffer rescue, and emergency recovery stage, rather than only concentrating one sub-phase, or no 206 subdivision. And victims as the beneficiary in the affected areas are classified into those in hospitals
208 around lifeline rehabilitation areas (LRs).
M AN U
207 or on-the-spot rescued areas (HOSs), slight or no injuries in temporary settlement areas (TESs) and
209 (4) An integrated issue concerning dynamic relief distribution with periodical demands and supplies 210 under insufficient supply is formulated as a multi-objective MINLP model. The proposed model is 211 similar to other ones in literature such as Tzeng et al. (2007), Lin et al. (2011), Huang et al. (2012),
TE D
212 and Huang et al. (2015). Although both of them intend to achieve the goals of maximizing minimal 213 satisfaction or similar regarding equity, they are different with objectives of this paper. Equity or 214 similar as one of their objectives is only considered by them from a single perspective, but this paper
EP
215 aims to achieve objectives regarding VPS from three levels. 216 (5) It must be acknowledged that heuristic algorithm is a more popular than exact approach to solve 217 mathematical model with an increasing complexity. Besides, Zheng et al. (2015a) elaborated that GA
AC C
218 comparing with other algorithms received more attention in the field of disaster relief operations 219 based on a survey. It may be the following reasons. Firstly, though it has few parameters, a good 220 convergence can be performed (Su et al., 2016). Secondly, it also holds a better robust due to 221 multiple initial search points. Thirdly, intrinsic probabilistic mechanism can easily capture the 222 uncertainty and randomness of disaster relief operations. Fourthly, it has a wide extension with other 223 methods (Hamed et al., 2015), thus strengthening its ability to deal with complex real-world problem 224 regarding disaster. Of course, a relatively long history results in plenty of previous achievements that 225 can be leveraged and extended. Therefore, GA is also considered as the method of this paper. 226 3. Problem description 8 / 30
ACCEPTED MANUSCRIPT 227 Hoyos et al. (2015) highlighted multi-period models as an emerging topic could assist decision228 makers to cope with uncertainties or randomness in relief distribution. More comprehensive analysis 229 and new information can be included in the future periods. Simultaneously, Anaya-Arenas et al. 230 (2014) delineated response phase need to be refined harmoniously. Thus, to further capture the
RI PT
231 dynamic characteristic of this issue, response phase as the focus of this paper is subdivided into 232 golden rescue, buffer rescue, and emergency recovery stage. But due to space limitation, more proofs 233 and details are only provided in Appendix A.
234 One of critical tasks during response phase is to design an efficient relief distribution network
SC
235 (Anaya-Arenas et al., 2014). As it can to some extent help to save lives, reduce suffering of victims, 236 and contribute to development. Besides, a better support to respond quickly to disaster for
M AN U
237 decision-makers is provided. Responsiveness here means that it needs to distribute the greatest goods 238 for the greatest number to the beneficiaries at the right time (Balcik et al., 2008). Similar to Balcik et 239 al. (2008), a set of logistic activities from relief distribution centres (RDCs) to relief-demand points 240 (RDPs), then to affected specific areas (ASAs) are only considered. Fig.1 presents a framework of
243
EP
242
TE D
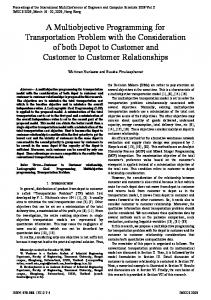
241 relief distribution network for SDSC.
Fig.1. A conceptual framework of relief distribution network.
244 More specifically, RDCs delivery relief received from external suppliers to the RDPs. And then,
AC C
245 relief distribution is implemented from RDPs to ASAs, such as HOSs, TESs and LRs (Fiedrich et al., 246 2000). In fact, ASAs represent a cluster of heterogeneous victims or beneficiaries. Unfortunately, 247 literature associated with ASAs in relief distribution network for SDSC is still limited, which is the 248 focus of this paper. In this context, on the condition of regional distribution rules, decision-makers 249 need to determine respectively amount of various relief from RDCs to RDPs, and then to ASAs. 250 Besides, they also have to make decision pertaining to the best routing selection, which is replaced 251 by interval number denoting arrival times of relief for simplification (Huang et al., 2012). 252 In addition, as decisions regarding relief distribution need to be made within a relatively reasonable 253 time, some necessary assumptions are used to simplify real-world case (Anaya-Arenas et al. 2014). 9 / 30
ACCEPTED MANUSCRIPT 254 Firstly, consequences resulting from secondary disasters are out of scope. Secondly, both amounts 255 and geographical locations of RDCs, RDPs, and ASAs are assumed to be known based on national 256 disaster management programs, which is similar to Sheu (2007). Thirdly, the amounts of relief of 257 each RDP or ASA can be satisfied by multiple transportations, namely a split delivery is considered.
RI PT
258 Fourthly, according to Camacho-Vallejo et al. (2015), four types of relief to be distributed and 259 managed in RDCs are included here. And the bundled necessary ratio of relief out of scope has been 260 obtained from similar cases. Fifthly, VPS is assumed to be merely correlated with amounts and 261 arrival times of relief.
SC
262 4. A mixed-integer nonlinear programming model formulation
263 Anaya-Arenas et al. (2014) addressed that a dynamic modeling approach can easily lead to a better
M AN U
264 performance of SDSC. In addition, Van Wassenhove (2006) highlighted that OR/MS technique could 265 provide a very useful method to improve disaster relief operations. In this context, on the basis of the 266 analysis already done above, relief distribution for SDSC is formulated as a MINLP model with 267 multiple objectives. The corresponding mathematical programming model is denoted by the 268 following formula (1) to (17). To make a clear statement for readers, necessary notations associated
arg max { χ 1s χ 1s = min[ f ks (π )], for all k }, ∀s
λ 2s arg min{χ 2s χ 2s λ 3 arg min {χ 3 χ 3 i
f ks (π ) - f ks' (π ) , ∀for all k , k ' '
φ s (π ) - φ s (π ) , ∀for all s , s '
j
EP
λ 1s
TE D
269 with model are presented in Appendix B.
s s s Zijk • Yijk • xijk
eks , / ∀k
K, s
K , and k ≠k ' }, ∀s
S , and s
s' }
(2) (3) (4)
S/
AC C
s.t.
(1)
i =1 j =1 j
s s Zijk • Yijks • xijk = j =1
m
s s s Zikm • Yikm • xikm , / ∀i
I,k
K, s
S/
(5)
m =1
j
Qis =
k
s s Zijk • Yijks • xijk , / ∀i
I, s
(6)
S/
j =1k =1 i
j s s Zijk • Yijks • xijk
Eks , / ∀k
K, s
S/
I, j
J,k
(7)
i =1 j =1
{
s s t ijm • max Yijks , Yikm
}
s T ijm , / ∀i
K,m 10 / 30
M,s
S/
(8)
ACCEPTED MANUSCRIPT s Z ijk
{0,1}, / ∀i
I, j
J,k
s Z ikm
{0,1}, / ∀i
I,k
K, m
K,s
(9)
S/
M,s
(10)
S/
{
}
β 1s = max max{ηms 1 (•)}, max{ηms 2 (•)}, max{ηms 3 (•)} , / ∀m1
0, / ∀i
I, j
J,m
M,s
S/
s x ijk
N , / ∀i
I, j
J,k
K,s
S/
I,k
K,m
M,s
S/
K,s
S/
s x ikm N , / ∀i s Y ijk
s Y ikm
{0,1}, / ∀i
I, j
J,k
{0,1}, / ∀i
I,k
K, m
M,s
S/
M 2 , m3
M 3, s
S/
S/
RI PT
s t ijm
M 1 , m2
M 3, s
SC
}
M 2 , m3
M AN U
{
β 2s = max η1s (•),L ,η ks (•),L ,η ks (•) , / ∀m1
M1 , m2
(11) (12) (13) (14) (15) (16) (17)
270 Herein, equations (1) to (3) present objective functions in MINLP model. Eq. (1) is to maximize the 271 lowest VPS for all RDPs at stage s from the perspective of single RDP level. It aims to improve the 272 worst case in the affected areas, which is Similar to Tzeng et al. (2007). Besides, each type of relief
TE D
273 is considered independently to avoid cross-impacts on perceived satisfaction. Eq. (2) is to minimize 274 the largest deviation on perceived satisfaction for any two RDPs at stage s from the perspective of 275 multiple RDPs level. It indicates that it is necessary to ration equitably relief, thus reducing
EP
276 unbalanced perceived satisfaction for all RDPs (Huang et al., 2012, Lin et al., 2011). In summary, the 277 aforementioned two objective functions characterize sustainability of relief distribution from two
279 f ks
1 (π
AC C
278 operational levels. Particularly, f ks (π )
is denoted by f ks (π ) = f ks→ 1 (π ) × f ks→ 2 (π ), ∀k , s , with
) = η ks ( x ), ∀k , s and fk 2(π) = (ηm1 (t) m1 k +ηm2 (t) m2 k +ηm3(t) m3 k ) s
s
s
s
αks ,∀k, s .
280 Eq. (3) intends to minimize the largest deviation on perceived satisfaction from the point of view of 281 lifecycle of response phase. The third objective function differing from the first and second one is 282 measured from a systematic perspective. Additionally, Huang et al. (2015) underlined that it was 283 difficult to make ad-hoc decisions at a sole time point due to uncertainties and dynamic evolving of 284 disasters. Thus, decisions ought to be made during several time periods, which to some extent results 285 in their mutual relationships (Rennemo et al., 2014).
11 / 30
ACCEPTED MANUSCRIPT 286 In this context, the perceived dissatisfaction obtained at last stage ( 1 - φ s -1 (•) ) is used to capture these 287 cross-impacts, and let it represent the weights of current sub-phase. Therefore, VPS at stage s can be
[
288 represented by φ (π )= 1 - φ s
][
][
]
(π ) × φ 1s(π ) × P1s β 1s × φ 2s (π ) × P2s β 2s ,∀s . Therein, φ 1s(π ) and φ 2s (π )
s -1
[
]
289 can be denoted by φ 1 (π ) = g 1 (π ) + g 2(π ) + g 3(π ) 3 , φ 2(π ) = g 4(π ),∀s , respectively. In addition, a s
s
s
s
s
RI PT
s
290 convex combination is considered here (Marler et al., 2005), thus P 1s + P 2s = 1 , and P 1s , P 2s∈[0.1,0.9] . 291 Doing like this is to avoid unexpected cases. To make it concise, critical equations regarding all 292 objective functions are presented in Appendix C.
SC
293 Formulas (4) to (17) represent all constraints. Constraints (4) indicate relief supply is insufficient for 294 each RDP k at stage s. Constraints (5) ensure that amounts of received relief type i equal those of
M AN U
295 distribution at RDP k at stage s. Constraints (6) define the total number of actual distribution as the 296 corresponding inventory of relief type iat stage s. Constraints (7) ensure that amounts of the received 297 relief at RDP k are no less than lower bound that victims can tolerate, and E k is calculated by twenty s
298 percent of expected amounts of relief. Constraints (8) account for the time spent by transporting and s
TE D
299 distributing relief from RDCs to ASAs within a given bound, and T ijm can be determined by the upper 300 bound of interval number that represents different arrival times of relief from different routings. 301 Constraints (9) to (10) define the indicator parameters that demonstrate objective case in relief
EP
302 distribution network for SDSC. They can be pre-determined. Constraints (11) and (12) register 303 auxiliary parameters to eliminate differences resulting from dimension. Constraints (13) to (17)
AC C
304 provide definitions for all decision variables. 305 5 A heuristic algorithm for dynamic relief distribution 306 This section first clarifies motivations for GA. Subsection 5.2 describes the key operators of GA. 307 Critical procedure of GA is presented in subsection 5.3. 308 5.1 Motivations for GA
309 As mentioned in section 2 ‘Literature review’, GA is widely used to solve mathematical model in 310 disaster relief operations. The following presents the reasons why GA is chosen as the methodology 311 in this paper. 312 Firstly, in practice, decision-makers need to develop relief distribution scheme within a relatively 12 / 30
ACCEPTED MANUSCRIPT 313 reasonable time to reduce various consequences (e.g. save lives, decrease suffering) as much as 314 possible. In terms of GA, multiple initial search points are simultaneously used to seek satisfactory 315 solution. It can to some extent improve the speed of search, thus saving run times. Therefore, this 316 characteristic of GA can assist decision-makers to develop a better relief distribution scheme within
RI PT
317 the limited time. 318 Secondly, there are plenty of uncertainties and randomness (e.g. time-varying demand and supply, 319 status of roads and bridges) existing in relief distribution for SDSC. They have a significant 320 influence on the performance of SDSC. Nevertheless, intrinsic probabilistic mechanism considered
SC
321 in selection, crossover and mutation operator of GA provides to a large extent a new idea to capture 322 the uncertainties and randomness in SDSC. It has the capability to simulate most of the scenarios in
M AN U
323 disaster relief operations.
324 Thirdly, some of researchers who focus on a similar problem to this paper demonstrate that GA 325 regarding specified situation has potential advantages on solution quality and computation time. For 326 instance, Zhang et al. (2016), Najafi et al. (2015), and Lin et al. (2011) compared respectively GA or 327 extensions against branch and bound approach, LINGO and CPLEX solver with the concern of
TE D
328 disaster context. They clarified GA was able to generate good quality solutions within a reasonable 329 time. Su et al. (2016) and Zhang et al. (2011) indicated an outstanding solution could be obtained by 330 GA. Besides, Zheng et al. (2015b) delineated that GA against tabu search could offer a better quality
EP
331 solution. Chang et al. (2015) opined that GA had the ability to obtain satisfactory solution within a 332 relatively short time. In this context, this paper leverages and extends their insights to design GA
AC C
333 discussed here.
334 5.2 Critical operators of GA
335 5.2.1 Representation and encoding 336 Regarding relief distribution for SDSC, the amounts of allocated relief and the corresponding arrival 337 times need to be determined. Its dimension is more than one, thus matrix encoding is considered here. 338 Fig. 2 presents the encoded rules concerning relief distribution scheme and chromosome. 339 It can be inferred that performance of GA with matrix encoding is essentially similar to that of st
340 traditional GA. One of the reasons may be that all decision variables are only located in 1 and 8
th
341 row in Fig.2. Others are only used to present an explicit iteration and respond to decoding. 13 / 30
ACCEPTED MANUSCRIPT 342 Specifically, the corresponding values of row 2 to 7 are fixed in terms of each column. Satisfactory st
th
RI PT
343 solution is obtained by changing the values of all decision variables in 1 and 8 row.
s s x ikm Y ikm
M AN U
SC
s s x ijk Y ijk
TE D
s t ijm
344
Fig.2. Representation for chromosome.
345
EP
346 In this context, each chromosome can be defined by a 8 × ( J I K M S ) matrix, which represents a 347 feasible relief distribution scheme for SDSC. For each chromosome, the 8 s
th
row denotes time
s
s
AC C
348 decision variable t ijm . the first row represents amount decision variables x ikm . Simultaneously, Y ikm is s
s s s s s 349 determined by x ikm . Specifically, if x ikm> 0 , then Y ikm= 1; if x ikm= 0 , then Y ikm= 0 . x ijk is calculated by
350 the sum of actual amounts of transported relief. That is, it is contingent on the sum of corresponding s
s
s
s
351 value of the first row for each RDP k . If x ijk > 0 , then Y ijk = 1 ; if x ijk = 0 , then Y ijk = 0 . Besides, the s
s 352 value of parameter Zikm and Zijk can be pre-determined with the concern of relief distribution network.
s
s
s s 353 The following constraints ought to be satisfied: Zijk + Zikm = 0 or if Z ijk = 0 , then Zikm = 0 . The s
354 corresponding time and amount decision variables are sufficiently large positive numbers if Zikm = 0 . 355 Thus, instance including two RDPs, one RDC and two types of relief and ASAs is illustrated. In 356 addition, AATR is short for ‘actual amounts of transported relief’ as well as AT is ‘actual time’. 14 / 30
ACCEPTED MANUSCRIPT 357 Another critical thing is how to link constraints of relief distribution model with representation for 358 chromosome. In this paper, Constraints (4) and (5) can be represented respectively by row 1, 2, and 3 359 as well as 1, 2, and 5 in Fig.2. The value of row 1, 5, and 6 simultaneously determine constraints (6). 360 Constraints (7) and (8) are indicated by 1
st
and 2nd row as well as 1st and 8th row, respectively.
RI PT
361 Constraints (11) and (12) are only to give the formulation of auxiliary parameter. Other constraints 362 can be found in last paragraph. 363 5.2.2 Initial population
364 To improve performance of GA regarding run time, this paper defines a feasible relief distribution
SC
365 scheme as an individual of initial population. Then, as a benchmark, other individuals of initial 366 population are produced by assigning different values to all decision variables on the condition of
M AN U
367 satisfying all constraints. Particularly, the feasible relief distribution scheme can be obtained from 368 decision-makers, who deal with disasters on the spot. Doing like this differing from the case that 369 initial population is produced randomly has the potential advantages on saving run times. In addition, 370 population size can be generally defined as 20 to 50. To simplify real-world case, instance regarding 371 two RDCs, three RDPs, three ASAs, four types of relief and three sub-phases is considered in section
TE D
372 6. Thus, each relief distribution scheme can be represented as a 8 × 216 matrix. 373 5.2.3 Individual fitness function
374 Individual fitness function is employed to evaluate each relief distribution scheme, and determine the
EP
375 members of next generation (Su et al., 2016). In general, it is defined by objective functions or their 376 extensions of relief distribution model. As a multi-objective optimization problem is considered,
AC C
377 strategies to handle this case have to be designed. In the extant literature, some methods such as the 378 weighted sum, epsilon-constraint, and Pareto optimality are proposed (Balaman et al., 2016; Najafi et 379 al., 2015; Marler et al., 2004). This paper leverages and extends their insights to provide a linear 380 weighted method to integrate three objectives into a scalar single one. In this context, individual 381 fitness function with maximal goal can be denoted by the following Eq. (18). 382
max ϕ (h, l ) = µ 1λ 1 + µ 2 × (1 λ 2 ) + µ 3 × (1 λ 3 )
(18)
383 Therein, ϕ (h, l ) denotes the value of fitness function of individual h in generation l . As three values for 384 the first and second objective will be respectively obtained from each feasible solution, a 385 transformation strategy into one value is necessary. According to the statistical knowledge, arithmetic 15 / 30
ACCEPTED MANUSCRIPT 386 mean is an effective method to achieve this goal regarding relief distribution model. Consequently, 387 let λ1 and λ2 denote respectively the arithmetic mean of the first and second objective. They are 388 denoted by λ1
(
)
(
)
= λ11 + λ12 + λ13 3 and λ2 = λ12 + λ22 + λ32 3 , respectively. Differing from the previous
389 two cases, the third objective has only one value, thus letting λ3
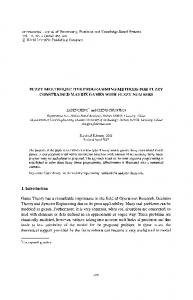
= λ3 .
RI PT
390 It must be acknowledged that their combinations also should be elaborated. Specifically, the first 391 objective and individual fitness function have the same trend. It indicates that λ1 can be directly 392 regarded as the first part of individual fitness function. Yet, the second and third objectives have an 393 opposite case to individual fitness function. An inverse method is employed to cope with this case
SC
394 (Gutjahr et al., 2016b). Thus, 1 λ 2 and 1 λ 3 are respectively defined as the second and third part. To
( )
(
)
(
)
M AN U
395 standardize each part, let coefficient of each part as µ1 = 1 λ1 max , µ2 = 1 1 λ2 max and µ3 = 1 1 λ3 max 396 for each generation l . Another reason doing like this is to eliminate the adverse phenomenon that ‘a 397 large number annihilating a small number’ in handling multi-objective problem. 398 5.3 Critical procedure of GA
399 The aforementioned operators of GA include representation and encoding, initial population and
TE D
400 individual fitness function. In addition to that other operators such as selection, crossover, and 401 mutation as well as termination criterion also should be highlighted. Fig.3 depicts the specific 402 procedure of GA discussed here.
403 Particularly, two termination criteria are highlighted. The first one is to obtain the satisfactory
EP
404 solution or relief distribution scheme on the given iterative times. The second one is that the value of
AC C
405 fitness function is convergence to a fixed value during the iterative process.
16 / 30
ACCEPTED MANUSCRIPT 1: Generate initial population or obtain initial feasible solution 2: Obtain initial relief distribution scheme from decision-makers and define it as the best practice 3: for l=1:L 4:
for h=1:H Calculate the value of individual fitness function
6:
Calculate value of fitness function of each individual by Eq.(18) and the sum of them is denoted by F(H,l)
7:
Obtain selection probability based on p(h, l ) = ϕ (h, l ) F ( H , l ) and the corresponding accumulated Probability is defined as:A(h, l ) = A(h - 1, l ) + p ( h, l )
8:
end
9:
for h=1:H
10:
Selection based on roulette method
11:
if A(1, l )
SC
13:
else
14:
Select individual h ' as next generation, and it should meet A(h - 1, l ) < r (h' , l )
M AN U
Select 1 individual as next generation
A(h, l ) and 2
h
H
end
16:
Crossover with single-point method
17:
Get crossover point by a integer at interval [1,215], then do this operation with crossover probability pc
18:
Correct the unfeasible individual by elimination and modification strategies, until all individuals are feasible
19:
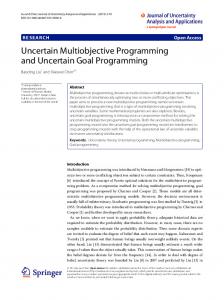
Mutation with uniform method
20:
Calculate the number of mutated gens by the length of chromosome and mutation probability pm
21:
s s s Then, determine which gens need to execute mutation, and do by x ikm + [ x ikm - x ikm ]× rand ()
22:
Do correction strategies in a similar way of line 18, until all individuals are feasible end
EP
26:
Until the termination criterion is satisfied
AC C
25: end
Return to line 3
TE D
15:
24:
407
r (h, l ) st
12:
23:
406
RI PT
5:
Fig. 3. Procedure of GA discussed here
408 6 Computational studies
409 To illustrate the proposed model and method, case study on a great earthquake that occurred in 410 Wenchuan of Sichuan province in China at 14:28 p.m., May 12, 2008 is considered. Main shock was 411 at magnitude 8.0 along with many aftershocks. It killed 69016 people, missed more than 18000 412 people and destroyed directly over 800 billion CNY worth of heavy property losses. It is reported 413 that there were 10 extremely severe affected areas, 41 heavily ones and 186 general ones. Due to the 414 limited space, both comprehensive description regarding case study and initial relief distribution 415 scheme is depicted in Appendix C. 17 / 30
ACCEPTED MANUSCRIPT 416 Particularly, initial relief distribution scheme from practical decision-makers is defined as the best 417 practice here. The method doing like this is also used by Wex et al. (2014), who regarded rescue units 418 assignment scheme obtained from the German Federal Agency of Technical Relief (THW) as the best 419 practice behavior of emergency operation centers. In addition, to evaluate the performance of the
RI PT
420 proposed model and methodologies, the following subsections presents the results from three 421 different perspectives. 422 6.1 Computational results obtained by GA
423 Mixed integer non-linear programming model (MINLP) and GA solved or implemented by using
SC
424 MATLAB (2012b). The program is run on 2.2 GHz 64-bit Core i5-5200U CPU machine under 425 Windows 8.1 Professional. In terms of operators of GA, crossover probability is 0.05, mutation
M AN U
426 probability, 0.002, population size, 50, and maximal iteration, 800. In this context, computational 427 results demonstrate that the value of fitness function is approximately converged to 2.7355 at 110
th
428 iteration, and average CUP time is 16.8 minutes. More information with the concern of satisfactory 429 relief distribution scheme is presented in Table D.3 of Appendix D.
430 Computational results indicate a relatively reasonable relief distribution scheme for SDSC can be
TE D
431 obtained by GA within the given iterations and limited time. It can be inferred that GA discussed 432 here can to some extent achieve the trade-off between solution quality and computation time, which 433 is line with the expectations. As clarified by Wex et al. (2014), decision support in practice has to be
EP
434 provided within 30 minutes by conforming in interviews with the German Federal Agency of 435 Technical Relief (THW). Thus, results further demonstrate that it is able to assist in improving the
AC C
436 performance of relief distribution of SDSC. Besides, these results and conclusions can be further 437 supported by Lin et al. (2011), Zheng et al. (2015b), Zhang et al. (2016), who concentrated on a 438 similar problem to this paper. Their specific insights can be found in subsection 5.1. 439 6.2 Computational results regarding cover range 440 Firstly, both initial and satisfactory relief distribution scheme are represented as a rectangle. It is 441 subdivided into 8 rows and 27 columns, thus resulting in 216 aliquot grids. Then, either black or 442 white circle can be filled in any grid. Specifically, a black circle shows a positive relationship of 443 relief delivered from RDCs or RDPs to ASAs. Otherwise, it is marked by a white circle. For any 444 RDC, the more the black circles are, the larger the cover range is. Besides, it also demonstrates the 445 corresponding relief distribution sub-network of SDSC is more decentralized, untargeted, and 18 / 30
ACCEPTED MANUSCRIPT 446 complicated as well as difficult to control. In contrast, a smaller one indicates it is more centralized, 447 targeted, and simple as well as relatively easy to control. But cover range mentioned here does not 448 involve their weights that represent the corresponding amounts of received relief by ASAs. This 449 subsection depicts computational results obtained by GA and the best practice from the perspectives
451 6.2.1 RDCs perspective
RI PT
450 of RDCs and relief types.
452 According to initial and satisfactory relief distribution scheme, the compared diagram of cover range 453 regarding relief types from the perspective of RDCs is depicted in Fig.4. (s = 1)
(s = 3)
(s = 2)
(s = 3)
454
Fig.4. Cover range regarding relief types from RDCs perspective.
AC C
455
EP
TE D
(s = 1)
M AN U
SC
(s = 2)
456 In terms of the best practice, the total number of fit between all relief types and ASAs is 101 out of 457 216. Thus, the corresponding average cover rate in total is calculated by 101/216
0.468. Wherein,
458 cover rate of Chengdu is 0.472 and Mianyang is 0.463. In a similar way, average cover rate of 459 satisfactory relief distribution scheme is computed by 70/216
0.324. Therein, cover rate of both
460 Chengdu and Mianyang is 0.324. It is obvious that average cover rate of the best practice is greater 461 than that of satisfactory relief distribution scheme, which indicates the structure of relief distribution 462 network of the best practice can be continuously improved by GA, even other heuristic algorithms. It 463 is also to a large extent observed by Wex et al. (2014), who devoted to developing emergency 464 resource allocation scheme based on multiple heuristic algorithms. Besides, cover rate of Chengdu 19 / 30
ACCEPTED MANUSCRIPT 465 and Mianyang under the two scenarios further consolidates this conclusion. However, it must be 466 acknowledged that the best practice and satisfactory relief distribution scheme have the same 467 workloads in total at each sub-phase. 468 To further investigate impacts of dynamic of relief distribution for SDSC on cover rate of RDCs,
RI PT
469 another experiment regarding lifecycle of response phase are conducted. Results obtained GA against
M AN U
SC
470 the best practice are presented in Fig.5.
471 472
Fig.5. Cover rate regarding lifecycle of response phase from RDCs perspective.
473 According to the aforementioned computational results, it can be concluded that cover rate of
TE D
474 Chengdu and Mianyang as well as their average of satisfactory relief distribution scheme have the 475 significant advantages against the best practice during all response sub-phase. The conclusion that a 476 relatively centralized, targeted and easy-to-control relief distribution network for SDSC is better is 477 supported again from a dynamic perspective.
EP
478 In this context, it can be inferred that a relatively centralized relief distribution network is more 479 efficient with the concern of specific context. Its significant advantages may manifest the following
AC C
480 aspects. Firstly, adequate vehicles to transport various type of relief can be guaranteed for 481 decision-makers. Secondly, such goals of SDSC to save lives, decrease suffering of victims, reduce 482 emergency costs and shorten travel distance are able to be achieved better. In addition to that Sheu 483 (2014a), Sheu et al. (2014b), and Valenzuela et al. (2014) support the aforementioned claim. For 484 example, Sheu et al. (2014b) focused on a centralized emergency supply network design regarding 485 psychological cost that reflects suffering of survivors in response to large-scale natural disasters. 486 Their results, which are similar to the results of methodologies of this paper, indicated that such a 487 centralized emergency supply network (especially distribution) had the potential superiority over a 488 decentralized one. 20 / 30
ACCEPTED MANUSCRIPT 489 6.2.2 Relief types perspective 490 In a similar way, by analyzing initial and satisfactory relief distribution scheme, the compared 491 diagram of cover range regarding RDCs from the perspective of relief types is presented in Fig. 6. (s = 2)
(s = 1)
(s = 2)
(s = 3)
M AN U
(s = 3)
TE D
492 493
SC
RI PT
(s = 1)
Fig.6. Cover range regarding RDCs from relief types perspective.
494 In Fig.6, with respect to satisfactory relief distribution scheme, Chengdu and Mianyang regarding the 495 same type of relief-supply has the significant differences. In contrast, Chengdu has a very similar
EP
496 situation to Mianyang for the best practice. In summary, computational results indicate the structure 497 of inventory relief in RDCs for best practice is able to be optimized by GA as the method of this
AC C
498 paper. It manifests the following points. Firstly, to a large extent, Chengdu and Mianyang have the 499 respective main areas taking into consideration supply of the same type of relief. As vehicle routings 500 from Chengdu and Mianyang to ASAs are different, it can benefit the elimination of waste regarding 501 human capital, costs and others. Secondly, it is able to avoid the unexpected cases (e.g. increasing 502 dissatisfaction, deaths) resulted from information asymmetry amongst suppliers of relief. Therefore, 503 the needs for optimizing inventory structure of relief for all RDCs are pressing. 504 To further validate the proposed methodologies of this paper, the weights that represent actual 505 amounts of relief are combined with their cover range. Thus, the weighted cover rate obtained by GA 506 over the best practice from the perspective of relief types is depicted in Fig.7. 21 / 30
(a) A scatter diagram of absolute value of difference
508
Type 3
Type 4
Type 1
s=1
Mianyang
Chengdu
Mianyang
Chengdu
s=2
Mianyang
Chengdu
Mianyang
Mianyang
s=2
s=3
Mianyang
Chengdu
Chengdu
Chengdu
s=3
Type 3
Type 4
Chengdu
Mianyang
Chengdu
Chengdu
Mianyang
Mianyang
Chengdu
Chengdu
Mianyang
Chengdu
Mianyang
Chengdu
M AN U
s=1
Type 2
SC
Type 2
(c) Type of supplied relief for the best practice
(b) Type of supplied relief for satisfactory solution
TE D
507
Type 1
RI PT
ACCEPTED MANUSCRIPT
Fig.7. The weighted cover rate obtained by GA against the best practice.
509 Fig.7 (a) demonstrates the differences of the weighted cover rate between Chengdu (marked 1#) and
EP
510 Mianyang (marked 2#). And its measurement is denoted by xis1 • cis1 - xis2 • cis2 , xis1 and xis2 represent 511 respectively amounts of relief type i delivered to Chengdu and Mianyang at stage s , and cis1 and cis2
AC C
512 denote their cover rates. Results indicate that both amounts and type of relief supplied by Chengdu 513 and Mianyang is significantly different for satisfactory relief distribution scheme over the best 514 practice. Fig.7 (b) and (c) with more detailed information consolidate this viewpoint. Fig.7 (c) 515 indicates that both Chengdu and Mianyang need to store and supply all types of relief during all 516 sub-phases of response, although there is a minor difference with regard to the first type of relief. 517 However, Fig.7 (b) supports to a large extent a better case. 518 In summary, the following conclusions can be made. Firstly, the benefit of an efficient strategy for 519 pre-disaster relief inventory management is to improve the performance of post-disaster relief 520 distribution for SDSC. It is also highlighted by Toyasaki et al. (2017), Rottkemper et al. (2011). For 22 / 30
ACCEPTED MANUSCRIPT 521 instance, Toyasaki et al. (2017) devoted themselves to enhancing the effectiveness of efficiency of 522 relief supply chains via horizontal cooperation among humanitarian organizations regarding disaster 523 relief inventory management. Secondly, establishment of RDCs regarding location, size and other 524 factors should be considered, thus enhancing the performance of relief distribution. It means that
RI PT
525 combinations of location of RDCs and distribution of relief are critical for SDSC. Importance of such 526 an emerging topic is also addressed by Anaya-Arenas et al. (2014), Gutjahr et al. (2016b). 527 6.3 Computational results regarding VPS
528 Subsection 6.2 has analyzed results obtained by GA and the best practice in detail from a traditional
SC
529 supply chain. However, a sustainability perspective is considered further to validate the results and 530 methodologies of this paper. As mentioned above, VPS is used to measure beneficiary perspective on
M AN U
531 sustainability regarding access, equity and needs fulfilment. In the meantime, VPS is reflected by 532 arrival times and amounts of relief. Thus, the following subsections present computational results on 533 sustainability from the point of view of RDPs and categorization of VPS reflected by ASAs. 534 Particularly, values in bracket represent the best practice, otherwise, those obtained by GA. 535 6.3.1 VPS from RDPs perspective
TE D
536 Similarly, computational results with the concern of VPS are summarized from the point of view of 537 RDPs. It is depicted in Table 2. 538 Table 2
AC C
EP
539 VPS obtained by GA against the best practice from RDPs viewpoint.
540 541 Following Table 2, it can be seen that average value of the lowest VPS gained by both GA and the 542 best practice is the same, 0.0006. There is no obvious improvement for the first objective resulting 543 from emergency recovery stage (May 24 to June 5). Values of largest deviation on VPS for all RDPs 544 (second one) and sub-phases (third one) are significantly improved by GA. In addition to that there is 23 / 30
ACCEPTED MANUSCRIPT 545 a highest VPS in total for Du Jiangyan, then Mianzhu and Guangyuan in order. 546 In summary, although this paper didn’t conduct additional experiments regarding methodologies of 547 literature such as Tzeng et al. (2007), Lin et al. (2011), Huang et al. (2012), Huang et al. (2015) with 548 a similar objective to this paper, some meaningful comparisons were still summarized. Firstly, RDPs
RI PT
549 with the lowest VPS and largest derivation require more attention. The reason is that those victims 550 may display extreme behaviors and disturb the order of society due to undertake more suffering. 551 Similar results are provided by Tzeng et al. (2011), Lin et al. (2011). Secondly, this paper aims to not 552 only evaluate validation of the proposed methodologies, but call for taking into consideration the
SC
553 vulnerability of RDPs that reflects one aspect of sustainability. Both Huang et al. (2015) and Huang 554 et al. (2012) show a better support to this point.
M AN U
555 6.3.2 VPS from ASAs perspective
556 Different from last subsection, VPS regarding arrival times and amounts of relief, which is obtained 557 by GA over the best practice is depicted in Table 3. 558 Table 3
AC C
560
EP
TE D
559 VPS obtained by GA against the best practice from ASAs viewpoint.
561 In terms of VPS towards amounts of relief, it is interesting that victims have the highest perceived 562 satisfaction at golden rescue stage. The reason may be that victims have a relatively larger marginal 563 utility, although only a small portion of relief is transported to ASAs in time. In contrast, there is yet 564 a lowest VPS at emergency recovery stage. This may result from shortage of relief within a short 565 time, inventory of RDCs being out of control huge amounts of relief-demand in large-scale natural 566 disasters. With regard to VPS towards arrival times of relief, the value is the largest from May 12 to 567 May 17 and smallest from May 24 to June 5. Specifically, victims located in TESs have the highest 568 perceived satisfaction towards arrival times of relief, and next is those located in HOSs. As the 24 / 30
ACCEPTED MANUSCRIPT 569 successful rehabilitation of lifeline infrastructures is the prerequisite to transporting and distributing 570 relief to ASAs, perceived satisfaction of victims around LRs towards arrival times of relief is the 571 relatively lowest taking into account hard and soft constraints. 572 Overall, firstly, VPS towards both amounts and arrival times of relief is the lowest at emergency
RI PT
573 recovery stage. It indicates that victims heavily suffer from shortage of relief and delay of arrival 574 time. Although only a few secondary disasters occurred and victims may remain a stable status, an 575 equal importance to relief distribution during this period should be highlighted (Hoyos et al., 2015). 576 Secondly, Haavisto et al. (2014) clarified that beneficiary perspective on sustainability manifested
SC
577 equity, need fulfilment, vulnerability of victim groups, and its consideration could improve the 578 performance of humanitarian supply chain. This paper further validates their conceptual framework
580 large extent support their insights. 581 7. Conclusions and recommendations
M AN U
579 by mathematical programming method. Although mixed results are obtained, this paper also can to a
582 This paper proposes a multi-objective MINLP model for dynamic relief distribution regarding 583 sustainability. Beneficiary perspective on sustainability manifests access, equity, and needs fulfilment,
TE D
584 and is captured by VPS towards amounts and arrival times of relief. The access to RDPs and victim 585 groups is respectively reflected by urgent level of relief-demand and severity of injuries, so that the 586 most needed ones can gain more attention. Equity with the concern of needs fulfilment involves
EP
587 amounts and arrival time of relief, and it is measured by actual value against expectations. Thus, the 588 suffering of victims is linked with the decisions on relief distribution to reduce social costs.
AC C
589 Furthermore, the dynamic of relief distribution during response phase is considered in a discrete 590 manner, so as to improve the performance. Specifically, response phase is refined into golden rescue, 591 buffer rescue, and emergency recovery stage. 592 The results from this paper provide several insights on theory and practice of relief distribution 593 regarding sustainability. A theoretical link between sustainability development and traditional relief 594 distribution even disaster relief operations is presented to alleviate the suffering of victims. Besides, 595 the conceptual framework regarding sustainability in disaster supply chain proposed by Haavisto et 596 al. (2014) is further validated here. 597 In practice, decision-makers intend to utilize a centralized relief distribution network during response 598 phase, unlike in commercial settings where different beneficiaries usually have the independent 25 / 30
ACCEPTED MANUSCRIPT 599 objectives and try to achieve them in a decentralized manner (Sheu et al., 2014b). In the context of 600 disasters, real-time information including vulnerability of victims, lifeline infrastructures, needed 601 commodities, relief inventory status, RDPs and RDCs usually unknown. Therefore, relief distribution 602 regarding sustainability may benefit from the easy-to-control centralized manner. In addition, results
RI PT
603 indicate that an efficient inventory strategy regarding relief type in response to large-scale natural 604 disasters can assist in improving the performance of relief distribution (Toyasaki et al., 2017). That is, 605 each type of relief should be stored in the right RDPs based on the aforementioned real-time 606 information. Of course, inventory strategy here refers to various type of relief need to be transported
SC
607 from RDCs. For instance, temporary professional equipment such as crane, hydraulic excavator 608 should be transported to relatively nearer RDCs with HOSs and LRs. However, daily-used relief such
M AN U
609 as sleeping bags, tents ought to be mainly stored in RDCs located in TESs. In disaster relief 610 environments, there are several indicators to capture sustainability (Dubey et al., 2016; Haavisto et al. 611 (2014)), and this paper merely focuses on beneficiary perspective regarding access, equity and needs 612 fulfilment. Although different researchers may have different insights and use different methods to 613 measure them, the proposed model here can easily integrate other indicators, such as ecological
TE D
614 dimension of sustainability. More specifically, arrival times of relief are first replaced by the distance 615 between RDCs and RDPs as well as ASAs. Then, average energy consumption can be computed 616 based on transportation mode. Thus, total carbon emissions as one of objectives are formulated.
EP
617 Furthermore, a reasonable relief distribution scheme is obtained within the limited time, and the best 618 practice can be continuously improved by GA. One reason may be that decisions regarding relief
AC C
619 distribution are often made in an unstructured manner, usually without the assistance of sophisticated 620 software embedded in mathematical models and algorithms. In addition, it is beneficial in improving 621 the sustainability of disaster supply chain by incorporating many factors into relief distribution 622 problem. However, it also presses more challenges on decision-makers to deal with the complex 623 issue. So the needs to develop and improve the logistic software in disaster management sectors are 624 pressing, especially in the era of Big Data (Zhong et al., 2016; Huang et al., 2012; Rolland et al., 625 2010). Since the proposed method of this paper is efficient and easy to understand. If it is embedded 626 in such software, valuable decision support might be provided for managers in practice. This insight 627 is found to be consistent with pervious findings in literature such as Zheng et al. (2015), who applied 628 heuristic algorithm into real case from Dingxi earthquake of China. Yet, it intends to only help 26 / 30
ACCEPTED MANUSCRIPT 629 managers to make decisions rather than fully substitute the practitioners. Particularly, the proposed 630 methodologies of this paper are expected to not only improve the performance of SDSC, such as 631 saving lives, decreasing suffering and contributing to development, but also address the importance 632 and urge of taking into account beneficiary perspective on sustainability for relief distribution.
RI PT
633 Valuable topics remain for further study. As mentioned above, only social dimension (or beneficiary 634 perspective) of sustainability is considered into relief distribution problem. The follow-up direction 635 can model such issue by incorporating economic and ecological dimension of sustainability. Another 636 promising topic is to further test and validate conceptual framework regarding sustainability in the
SC
637 context of disaster proposed by Haavisto et al. (2014) with other real cases, so as to strengthen the 638 results of this paper.
M AN U
639 Acknowledgements
640 This research is supported by the projects including National Natural Science Foundation of China, 641 Grant Nos. 71772075, 71672074 and 71401118, Twelfth Five-year Planning Project of Philosophy 642 and Social Science in Guangdong Province Grant Nos. GD15CGL07, the Department of Education 643 Project of Sichuan Province Grant Nos. 14ZA0026.
TE D
644 Supplementary materials
645 Supplementary materials related to this manuscript consists of Appendix A, B, C and D. And they as 646 a separate file are provided in EES. 647 References
EP
648 Altay, N., Green-III, W.G., 2006. OR/MS research in disaster operations management. Eur. J. Oper. Res. 175(1), 649 475-493.
AC C
650 Anaya-Arenas, A.M., Renaud, J., Ruiz, A., 2014. Relief distribution networks: a systematic review. Ann. Oper. Res. 651 223(1), 53-79.
652 Balaman, 2016. Investment planning and strategic management of sustainable systems for clean power generation: 653 an epsilon-constraint based multi objective modelling approach. J. Clean. Prod. 137, 1179-1190. 654 Balcik, B., Beamon, B.M., Smilowitz, K., 2008. Last mile distribution in humanitarian relief. J. Intell. Transport. 655 Syst. 12, 51-63. 656 Barbarosoglu, G., Arda, Y., 2004. A two-stage stochastic programming framework for transportation planning in 657 disaster response. J. Oper. Res. Soc. 55(1), 43-53. 658 Camacho-Vallejo, J.-F., Gonzalez-Rodriguez, E., Almaguer, F.-J., et al., 2015. A bi-level optimization model for aid 659 distribution after the occurrence of a disaster. J. Clean. Prod. 105, 134-145. 660 Carter, C.R., Rogers, D.S., 2008. A framework of sustainable supply chain management: moving toward new theory. 27 / 30
ACCEPTED MANUSCRIPT 661 Int. J. Phys. Distr. Logist. 38(5), 360-387. 662 Caunhye, A.M., Nie, X.F., Pokharel, S., 2012. Optimization models in emergency logistics: a literature review. 663 Socio-Econ. Plan. Sci. 46(1), 4-13. 664 Chang, F.S., Wu, J.S., Lee, C.N., et al., 2014. Greedy-search-based multi-objective genetic algorithm for emergency 665 logistics scheduling. Expert. Syst. Appl. 41(6), 2947-2956. 666 Chen, S., Luo, Z., Pan, X., 2013. Natural disasters in china: 1900-2011. Nat. Hazards 69(3): 1597-1605.
RI PT
667 Dubey, R., Gunasekaran, A., 2016. The sustainable humanitarian supply chain design: agility, adaptability and 668 alignment. Int. J. Logist.-Res. App. 19(1), 62-82.
669 Fiedrich, F., Gehbauer, F., Rickers, U., 2000. Optimized resource allocation for emergency response after 670 earthquake disasters. Safety Sci. 35(1-3), 41-57.
SC
671 Gutjahr, W.J., Dzubur, N.. 2016b. Bi-objective bilevel optimization of distribution center locations considering user 672 equilibria.Transport. Res. E-log. 85, 1-22.
673 Gutjahr, W.J., Nolz, P.C., 2016a. Multicriteria optimization in humanitarian aid. Eur. J. Oper. Res. 252, 351-366.
M AN U
674 Haavisto, I., Kovacs, G., 2013. Sustainability in humanitarian operations. Sustainable Value Chain Management: 675 Analyzing, Designing, Implementing, and Monitoring for Social and Environmental Responsibility, Gower 676 Publishing, 489-507.
677 Haavisto, I., Kovacs, G., 2014. Perspectives on sustainability in humanitarian supply chains. Disaster Prev. Manag. 678 23(5), 610-631.
679 Halldórsson, A., Kovacs, G., 2010. The sustainable agenda and energy efficiency: logistics solutions and supply
TE D
680 chains in times of climate change. Int. J. Phys. Distr. Log. 40(1/2), 5-13.
681 Habib, M.S., Lee, Y.H., Memon, M.S., 2016. Mathematical models in humanitarian supply chain management: a 682 systematic literature review. Math. Proble. Eng. In press. 683 Hamed, S., Govindan, K., 2015. A hybrid particle swarm optimization and genetic algorithm for closed-loop supply
EP
684 chain network design in large-scale networks. Appl. Math. Model. 39, 3390-4012. 685 Holguin-Veras, J., Perez, N., Jaller, M., et al., 2013. On the appropriate objective function for post-disaster 686 humanitarian logistics models. J. Oper. Manag. 31, 262-280.
AC C
687 Holland, J.H., 1975. Adaptation in natural and artificial systems: an introductory analysis with applications to 688 biology, control and artificial intelligence, MIT Press, Cambridge, MA, USA. 689 Hoyos, M.C., Morales, R.S., Akhavan-Tabatabaei, R., 2015. OR models with stochastic components in disaster 690 operations management: a literature survey. Comput. Ind. Eng. 82, 183-197. 691 Huang, K., Jiang Y.P., Yuan Y.F., et al., 2015. Modelling multiple humanitarian objectives in emergency to 692 large-scale disasters. Transport. Res. E-log. 75, 1-17. 693 Huang, M., Smilowitz, K., Balcik, B., 2012. Models for relief routing: equity, efficiency and efficacy. Transport. 694 Res. E-log. 48(1), 2-18. 695 Ibegbunam, I., McGill, D., 2012. Health commodities management system: priorities and challenges. Journal of 696 Humanitarian Logistic and Supply Chain Management, 2(2), 161-182. 697 Kaivo-oja, J., Panula-Ontto, J., Vehmas, J., et al., 2014. Relationships of the dimensions of sustainability as 28 / 30
ACCEPTED MANUSCRIPT 698 measured by the sustainable society index framework. Int. J. Sust. Dev. World 21(1), 39-45. 699 Kunz, N., Gold, S., 2017. Sustainable humanitarian supply chain management-exploring new theory. Int. J. 700 Logist.-Res. App. 20(2), 85-104. 701 Li, X.P., Batta, R., Kwon, C., 2017. Effective and equitable supply of gasoline to impacted areas in the aftermath of 702 a natural disaster. Socioecon. Plann. Sci. 57, 25-34.
704 aftermath of a disaster. Socioecon. Plann. Sci. 45(4), 132-145.
RI PT
703 Lin, Y.H., Batta, R., Rogerson, P.A., et al., 2011. A logistics model for emergency supply of critical items in the
705 Marler, R.T., Arora, J.S., 2004. Survey of multi-objective optimization methods for engineering. Struct. Multidiscip. 706 Optim. 26, 369-395.
707 Marler, R.T., Arora, J.S., 2005. Function-transformation methods for multi-objective optimization. Eng. Optim. 37,
SC
708 551-570.
709 Mohammadi, R., Ghomi, SMTF., Jolai, F., 2016. Pre-positioning emergency supplies for earthquake response: a 710 new multi-objective particle swarm optimization algorithm. Appl Math Model. 40(9-10), 5183-5199.
M AN U
711 Najafi, M., Farahani, R.Z., Debrito, M.P., et al. 2015. Location and distribution management of relief centers: a 712 genetic algorithm approach. Int. J. Inf. Tech. Decis. 14(4), 1-35.
713 Ozdamar, L., Ekinci, E., Kucukyazici, B., 2004. Emergency logistics planning in natural disasters. Ann. Oper. Res. 714 129(3), 218-219.
715 Ozdamar, L., Ertem, M.A., 2015. Models, solutions and enabling technologies in humanitarian logistics. Eur. J. 716 Oper. Res. 244(1), 55-65.
TE D
717 Papadopoulos, T., Gunasekaran, A., Dubey, R., et al. 2017. The role of Big Data in explaining disaster resilience in 718 supply chains for sustainability. J. Clean. Prod. 142, 1108-1118. 719 Rennemo, S.J., Rø, K.F., Hvattum, L.M., et al., 2014. A three-stage stochastic facility routing model for disaster 720 response planning. Transport. Res. E-log. 62(2), 116-135.
EP
721 Rottkemper, B., Fischer, K., Blecken, A., et al., 2011. Inventory relocation for overlapping disaster settings in 722 humanitarian operations. OR Spectrum 33, 721-749. 723 Sheu, J.B., 2007. An emergency logistics distribution approach for quick response to urgent relief demand in
AC C
724 disasters. Transport. Res. E-log. 43(6), 687-709. 725 Sheu, J.B., 2014a. Post-disaster relief-service centralized logistics distribution with survivor resilience 726 maximization. Transport. Res. B-meth. 68, 288-314. 727 Sheu, J.B., Cheng, P., 2014b. A method for designing centralized emergency supply network to respond to 728 large-scale natural disasters. Transport. Res. B-meth. 67, 284-305. 729 Su, Z., Zhang, G., Liu, Y., et al., 2016. Multiple emergency resource allocation for concurrent incidents in natural 730 disasters. Int. J. of Disast. Risk Re. 17, 199-212. 731 Sung, I., Lee, T., 2016. Optimal allocation of emergency medical resources in a mass casualty incident: patient 732 prioritization by column generation. Eur. J. Oper. Res. 252, 523-634. 733 Theeb, N.A., Murray, C., 2017. Vehicle routing and resource distribution in postdisaster humanitarian relief 734 operations. Int. T. Oper. Res. 24, 1253-1284. 29 / 30
ACCEPTED MANUSCRIPT 735 Toyasaki, F., Lean Silbermayr, E.A., Sigala, I.F., 2017. Disaster relief inventory management: horizontal 736 cooperation between humanitarian organizations. Prod. Oper. Manag. 26(6), 1221-1237. 737 Tzeng, G.H., Cheng, H.J., Huang, T.D., 2007. Multi-objective optimal planning for designing relief delivery 738 systems. Transport. Res. E-log. 43(6), 673-686. 739 Valenzuela, J.F., Legara, E.F., Fu, X.J., 2014. A network perspective on the calamity, induced inaccessibility of 740 communities and the robustness of centralized, landbound relief efforts. Int. J. Mod. Phys. C 25(6), 1-16.
RI PT
741 Van Wassenhove, L.N., 2006. Blackett memorial lecture-humanitarian aid logistics: supply chain management in 742 high gear. J. Oper. Res. Soc. 57(5), 475-489.
743 Weerawardena, J., McDonald, R.E., Mort, G.S., 2010. Sustainability of nonprofit organizations: an empirical 744 investigation. J. World Bus. 45(4), 346-356.
746 scheduling of rescue units. Eur. J. Oper. Res. 235(3), 697-708.
SC
745 Wex, F., Schryen, G., Feuerriegel, S., et al., 2014. Emergency response in natural management: allocation and
747 Wilson, D.T., Glenn, I.H., Graham, C., et al., 2013. A multi-objective combinatorial model of casualty processing in
M AN U
748 major incident response. Eur. J. Oper. Res. 230(1), 643-655.
749 Zhang, C., Liu, X., Jiang, Y., et al., 2016. A two-stage resource allocation model for lifeline systems quick response 750 with vulnerability analysis. Euro. J. Oper. Res. 250(3): 855-864.
751 Zhang, L.M., Lin, Y.H., Yang, G.F., et al., 2011. Emergency resources scheduling based on adaptively mutate 752 genetic algorithm. Comput. Human Behav. 27, 1493-1498.
753 Zheng, Y.J., Chen, S.Y., Ling, H.F., 2015a. Evolutionary optimization for disaster relief operations: a survey. Appl.
TE D
754 Soft. Comput. 27, 553-566.
755 Zheng, Y.J., Ling, H.F., Xu, X.L., et al., 2015b. Emergency scheduling of engineering rescue tasks in disaster relief 756 operations and its application in China. Int. T. in Oper. Res. 22(3), 503-518. 757 Zhong, R., Newman, S.T., Huang, G.Q., et al., 2016. Big data for supply chain management in the service and
EP
758 manufacturing sectors: challenges, opportunities, and future perspectives. Comput. Ind. Eng. 101, 572-591. 759 Zhou, Y.W., Liu, J., Zhang, Y.T., et al., 2017. A multi-objective evolutionary algorithm for multi-period dynamic
AC C
760 emergency resource scheduling problems. Transport. Res. E-log. 99, 77-95.
30 / 30
ACCEPTED MANUSCRIPT Highlights Beneficiary perspective on sustainability is incorporated into dynamic relief distribution problem during response phase. Sustainability regarding the access, equity and needs fulfilment is measured ultimately by
RI PT
victims’ perceived satisfaction (VPS).
An integrated relief distribution issue is formulated as a multi-objective mixed-integer nonlinear programming (MINLP) model.
SC
The goals are to maximize the lowest victims’ perceived satisfaction, and minimize respectively the largest deviation on victims’ perceived satisfaction for all demand points and sub-phases.
AC C
EP
TE D
their potential advantages.
M AN U
A case study from Wenchuan earthquake is used to illustrate the methodologies, and indicates