Indonesian Journal of Physics Vol 22 No. 2, April 2011
A Novel Technique for Particle Sizing by Image Analysis of the Diffraction Pattern R. Salah and Muzalhim Ibrahim Azawe* Department of Physics, College of Education, Mosul University, Mosul, Iraq e-mail:
[email protected] Received 10 February 2011, Accepted 12 April 2011 Abstract We analyze the image of an aggregate of particles based on laser diffraction technique for particle diameter calculations. The recorded image will be transferred to a matrix of pixels, depending on the size of the image, and these pixels will be correlated with each other and with surroundings in order to get the exact features of the image. Processing of the image through many steps in the software will allow finding the diameter. The diameter obtained by this technique will be compared with the diameter found from the image of the optical microscope. Keywords: Laser, Particle size analysis, Image processing data processing by assuming that the data will fit a given size distribution10). Exact position of the particle within the laser beam is not detrimental because of the light intensity distribution depends only on the scattered angles and particle size. A systematic increase or decreases in detector responsivity in progressing from the inner to outer detectors causes the computed size distribution to be smaller or larger, respectively, than the actual distribution11). The multiple scattering of particles is another problem which occurred in a dense spray where the scattering angle is higher causing the appearance of smaller particle diameter than the actual one. This error will give a broader size distribution than it is12). Image recording of the laser diffraction pattern will be the alternative procedure given in this article. The ability to acquire data rapidly allows many thousands of measurements to be averaged when reporting a single result, delivering excellent repeatability when compared to other techniques. In addition this technique offers a range of applicability such as sprays, dry powders, suspensions and sprays. This procedure will be illustrated in this article. The study will focus on the particle size calculation using software scanning the pattern of the scattered light. This process of breaking down the diffraction pattern into its constituent energy bands with the ultimate calculation of the size distribution is known as deconvolution of the scattering pattern13).
1. Introduction Particle characterization in both the research and development, and the manufacture and quality control of materials and products is very important of our everyday lives. Several conventional particle characterization methods, such as sieve analysis and sedimentation analysis, have gradually been replaced by non- invasive methods based on light- matter interaction1). One of the instruments used widely in sizing particle is the Malvern which based on laser diffraction technique; it is widely used in many industrial applications especially in combustion fuel spray, agriculture and chemical works2-4). Also, the technological progress in electronics permitted a wide use of laser diffraction method for particle size distribution measurement in soil, since particle size distribution affects many physical soil properties and processes taking place in soil5). Results from the sieve method and pipette method for measuring the grain size of soil and sediment samples were compared with results from laser diffraction size analysis, and from a point of view of laboratory efficiency, the laser sizing technique was far superior6). The laser diffraction gives more detailed particle size distributions than the any other techniques stated, provided that the method is non-destructive and non-intrusive and samples can be recovered if they are valuable. The faster laser diffraction can substitute the time consuming Andersen cascade impactor (ACI) for aqueous drug formulations at least for routine tests7). Laser diffraction-based particle characterization is widely accepted as a standard technique and quality control in pharmacy industry8) and in food industry. Laser pattern of the particles under test can be collected by a receiving optics system and projected onto a well position detector at the receiving lens focal point9). The advantage of using a diffraction pattern is that the dimension of the diffraction pattern is orders of magnitude larger than the diffracting spheres. Many commercial machines actually take short cuts in their
2. Theory Diffraction pattern is suitable for nearly spherical and monodisperse particles, even when the material’s optical properties are not known. The scattered light intensity distribution I(r,x), which depends on the particle diameter x and the radial distance to the optical axis r, is defined for a single particle as14):
41
42
IJP Vol. 22 No. 2, 2011 ⎡ ⎛ πrx ⎞ ⎤ ⎟⎟ ⎥ 2 J1 ⎜⎜ ⎢ 2 ⎛ πx ⎞ ⎢ ⎝ λf ⎠ ⎥ ⎟ I (r , x) = I 0 ⎜⎜ ⎟⎢ ⎥ ⎝ 4 fλ ⎠ ⎢ πrx ⎥ λf ⎦⎥ ⎣⎢
2
(1)
3. Results and Discussion
Where f is the focal length, J1 is a Bessel function of the first kind and first order, and λ is the wavelength of the light. For investigations of a particle collective, the scattered light intensities from the individual particles are superimposed. The particle size distribution of the sample can be calculated from the measured scattered light intensities14). Different particle size distributions are only directly comparable when they have been determined based on the property that they are monodisperse, i.e., when the diameters of the individual particles are within 10% of each other13). If the number density distribution q0(x) is determined via a counting technique, then as long as q0(x) is a continuous function, the volume density distribution qr(x) can be calculated as follows13): qr ( x ) =
x r q0 ( x ) x max
∫x
min
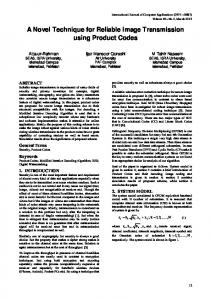
of the image is based on an analysis of the extracted features. This analysis is based on a mathematical model given above. A diffraction pattern of homogeneous particles, scattered from 1 mW laser (wavelength 0.6328 µm), was recorded as shown in Figure 1. As can be seen from the image, two bright spots were from two LED placed on the two sides of the screen. These two LED have a purpose, which will be illustrated. An assurance has been provided for the measured data as reproducible. Also, the sample's particle sizes that have measured with the laser diffraction will be compared with particle size taken with the microscopy as it is the most referee method. The most errors in size measurement arise through poor sampling and dispersion and not through instrument inadequacies14). The laser diffraction pattern will be studied thoroughly using software that was written for this purpose. This software, in the Matlab package, will take care of any difficulties that may be arising during scanning the image between the two spots of the LEDs.
(2)
x r q0 ( x)dx
Image pattern of the particles diffraction pattern, in term of light intensity distribution I(r,x) can be directly taken of the screen of the scattered light. The advantage of using a diffraction pattern is that, the dimensions of the diffraction pattern is orders of magnitude larger than the diffracting spheres. Twodimensional (2D) and three-dimensional (3D) information will be obtained in order to assess the particle size and the particle size distribution qr(x). Neither a photographic film, nor a charge-coupled device (CCD) nor video cameras and nor any other electronic sensors have used in recording the pattern, but only a simple digital camera, e.g., a cell phone camera. The setup consisting of the high resolution camera and the software all seamlessly integrated into an intuitive easy-to-use imaging workstation. Digital images are simply large arrays of numbers that represent picture elements (pixels) of various levels of gray or color, so image processing is perfectly well suited for computer implementation. Image enhancement techniques are sometimes used to improve clarity or to accentuate certain features within the image. The features of an image are generally regions of pixels that are darker or brighter than surrounding pixels and that are spatially correlated with each other15). More recently, optical coherence tomography was used to collect cross-sectional images of glass powder beds consisting of microspheres with diameters ranging from 8 to 175 µm, and the measured distributions are in good agreement with those obtained by laser diffraction16). After the features have been recognized, their size will be analyzed and recorded. The interpretation
Figure 1. The image of the diffraction pattern for the particles under study using He-Ne laser. The image will be transferred to the following shape after being processed with the software and transferred to a matrix depending on the size of the image, as can be seen in Figure 2. The two spots will then be removed from the figure serving the purpose of guiding the scan. The figure illustrates that the diffraction pattern had been transferred to the image and needs some more processing in order to find out the diameter of the particles. Computer programming takes very short time compared to other ways for calculating the size of the particles.
IJP Vol. 22 No. 2, 2011
43
Figure 2. The transfer of the diffraction pattern image into the 3D surface, with the software.
Figure 4. The final curve for obtaining the particle diameter.
The next step will be the removing of the two surfaces of the spots keeping only the surface area of the diffraction pattern of the particles. Also, in order to calculate the diameter of the particle, the distance between the two minima along an axis, filtering and trunk limiting through the peaks were performed in the software. The figure after these steps will be as shown in Figure 3. Still the axes were plotted in terms of pixels and the figure has to be processed further so that the diameter can be found. Only the surface along one axis was kept for the next procedure, as can be seen from the figure.
The image taken from the optical microscope is shown in Figure 5. It is clear from the figure that the particles were nearly homogeneous and spherical in shape. Other program was implemented in order to find the distribution of the similar particles with the same diameter and to find the diameter of the most. The diameter was (32µm). The error in calculating the diameter is due that the particles were not exactly homogeneous and spherical in shape.
Figure 5. Image of the optical microscope for the particles under study Figure 3. The 3D surface of the particles diffraction pattern. The remaining part of the calculations is to get the final curve, as shown in Figure 4, in order to calculate the diameter. Differentiating and finding the pixel ratio to mm will be the next in order to calculate the diameter. The final step is to use the diffraction equation to get the diameter. The diameter was found to be (26.5µm). This diameter will be compared with one that will be estimated from optical microscope image below.
4. Conclusions A new approach for determining the particle size was demonstrated from the recorded image of the diffraction pattern. Among the existing particle sizing techniques, this method is attractive for rapid measurements. This optical technique for size information is noninvasively and requires no extensive calibration and easy to monitor. No sample preparation is needed, reliable and flexible for convenience and can replace any sophisticated laser diffraction particle size analyzer. The software allows the data to be analyzed quickly and can be repeated for few seconds. The image of the diffraction pattern can be taken from any industrial location or firms without disturbing the aggregate of the particles.
44
IJP Vol. 22 No. 2, 2011
References 1. 2.
3.
4.
5.
6.
7.
8.
R. Xu, Particle Characterization: Light Scattering Methods, Kluwer Academic, New York, 2002. R. D’Amato et al., Synthesis of Si Nanoparticles with Controlled Size, Morphology and Crystallinity in a CO2 Laser Pyrolysis Reactor, Global Roadmap for Ceramics -ICC2 Proceedings, Verona, June 29-July 4, 2008. K. Stremple and R. Daniels, Effect of Preservation on the Stability of HPMC/SolutolStabilized O/W Submicron Emulsion, Proc. 4th World Meeting ADRTELF/APV/APGI, Florence 8/11 April, 2002. B. Neirinck et al., Porous Titanium Coatings Obtained by Electrophoretic Deposition (EPD) of Pickering Emulsions and Microwave Sintering, Advanced Eng. Mat., 10, 246, 2008. M. Ryżak, A. Bieganowski, and R.T. Walczak, Application of laser diffraction method for determination of particle size distribution of greybrown podzolic soil, Res. Agr. Eng., 53, 34, 2007. J. Ziegler and H. Wachtel, Comparison of Cascade Impaction and Laser Diffraction for Particle Size Distribution Measurements, J. Aerosol Med., 18(3), 311, 2005. M. Konert and J. Vandenberghe, Comparison of Laser Grain Size Analysis with Pipette and Sieve Analysis: a Solution for the Underestimation of the Clay Fraction, Sedimentology, 44(3), 523, 2008. P. Kippax, Appraisal of the Laser Diffraction Particle Sizing Technique, Pharmaceutical Technology. March 2005.
9.
10.
11. 12. 13.
14.
15. 16.
S. P. Alexander, An Integrated Microoptical Microfluidic Device for Agglutination Detection and Blood Typing, M.Sc. Thesis, North Carolina State University, 2007. B. Kaye et al., The Effect of Shape on Intermethod Correlation of Techniques for Characterizing the Size Distribution of Powder. Part I: Correlating the Size Distribution Measured by Sieving, Image Analysis, and Diffractometer Methods, Part. Part. Syst. Charact., 14, 219, 1997. B.H. Kaye, Characterization of Powders and Aerosols, Wiley-VCH Verlag GmbH, Weinheim, Germany, 1999. L. Simonot et al., Ray Scattering Model for Spherical Transparent Particles, J. Opt. Soc. Am., 25, 1521, 2008. U. Teipel, and J. K. Bremser, in : Energetic Materials Particle Processing and Characterization, Ed. by Ulrich Teipel, WILEYVCH Verlag GmbH & Co. KGA, Weinheim. 2005. M. Heuer and K. Leschonski, Results Obtained with a New Instrument for the Measurement of Particle Size Distributions from Diffraction Patterns, Part. Charact., 2, 7, 1985. T. Allen, Advances in Ceramics, Ceramic Powder Science, 21,721, 1987. J. Veilleux et al., Particle Size Measurement in Glass Powder Beds using Optical Coherence Tomography, Opt. Eng., 47, 033601, 2008.