XVIII Congreso Argentino de Bioingeniería SABI 2011 - VII Jornadas de Ingeniería Clínica Mar del Plata, 28 al 30 de septiembre de 2011
A novel time-domain signal processing algorithm for real time ventricular fibrillation detection G E Monte1, N C Scarone1, and P O Liscovsky Universidad Tecnológica Nacional, Facultad Regional Del Neuquén P Rotter S/N Plaza Huincul, ARGENTINA E-mail:
[email protected] Abstract. This paper presents an application of a novel algorithm for real time detection of ECG pathologies, especially ventricular fibrillation. It is based on segmentation and labeling process of an oversampled signal. After this treatment, analyzing sequence of segments, global signal behaviours are obtained in the same way like a human being does. The entire process can be seen as a morphological filtering after a smart data sampling. The algorithm does not require any ECG digital signal pre-processing, and the computational cost is low, so it can be embedded into the sensors for wearable and permanent applications. The proposed algorithms could be the input signal description to expert systems or to artificial intelligence software in order to detect other pathologies.
1. Introduction Ventricular fibrillation (VF) is a serious class of arrhythmia which requires immediate and correct detection to save lives. In normal conditions, the electrical activities in the heart are synchronized. Under certain circumstances, this synchronism is lost and the ventricles enter in a state known as fibrillation [1]. As a result, there is a chaotic behaviour showing uncoordinated activity with poor or no blood pumping. Collapse and sudden cardiac death will follow in minutes unless medical help is provided immediately. If treated in time, VF can be converted into normal sinus rhythm. This requires shocking the heart with a device called a defibrillator [2]. VF detection algorithms have been studying for more than three decades. A large number of techniques of digital signal processing have been applied to the detection of pathologies in ECG signals. In the time domain, are highlighted; the threshold crossing intervals algorithm (TCI) [3] where decisions are based on the number and position of signal crossings through a certain threshold. The Tompkins algorithm based on QRS complex detection using slope, amplitude and width information [4]. The autocorrelation algorithms that use the periodicities within the ECG to infer signal parameters [5]. On the other hand, in the frequency domain, the spectral algorithm (SPEC) [6] analyses the change of patterns during VF in frequency bands by means of Fourier analysis. Wavelet transform also has been proposed [7], and more recently the Hilbert transform has been applied successfully [8]. Artificial intelligence techniques such as neural networks [9] and genetic algorithms [10] have been used with good results, but they require training stages or the computational cost is excessive. 1
IDESIC research Group. UTN-FRN
XVIII Congreso Argentino de Bioingeniería SABI 2011 - VII Jornadas de Ingeniería Clínica Mar del Plata, 28 al 30 de septiembre de 2011
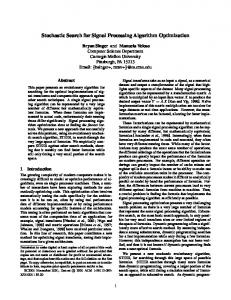
Each method has advantages and disadvantages. Techniques applied in time domain are more efficient than others, but they are very sensitive to noise and artifacts. Signal transformations to other domains achieve detection of specific patterns but they involve a high computational cost. Biomedical signals present a challenge to digital signal processing techniques. First, the signal to noise ratio is generally poor. Second, many artifacts are present like electromyographic noise, baseline drift, power line interference, radio frequency interference and skin-electrode interface noise. Such interferences can degrade the ECG signals; therefore the algorithms to analyze them must be smart enough to detect these artifacts or to avoid contaminated regions when the interference is excessively high. Figure 1 shows a simplified ideal ECG signal, where the important features are shape, relative position and duration of the expected waves. Figure 2 shows a real ECG waveform after filtering, sampling at the frequency of 128 Hz.
Figure 1. Ideal ECG waveform.
Figure 2. Real ECG signal from MITBIH Normal Sinus Rhythm Database record Nº 16265.
The electrical signals produced by the heart in each beat are known since the mid-19th century. In 1901, William Einthoven published the document “String Galvanometer”, which is considered the first electrocardiograph [11]. Throughout these years, Scientists, MDs and then Cardiologists have learned to infer the health state of the cardiovascular system analyzing the waveforms. ECG signals are timevariant; therefore almost any domain transformation requires windowing the signal. This window can include artifacts or noise mixed with normal signals. As a result, the signal should be pre-processed to discard regions of unwanted signals or to process regions of expected signals. The aim for digital signal processing is to extract knowledge from data. Most of the algorithms start from data to get knowledge, e.g. to detect some pathology. Our proposal is to obtain an intermediate stage from data with a standardized structure. Then, from this platform, processes the information to get knowledge. This intermediate stage is important if we have multiple goals, because we do not have to go back to data to start a new algorithm. Figure 3 shows graphically these concepts. This paper presents a time domain techniques for processing ECG signals that can be used to detect pathologies and to pre-process the signal to other more time-consuming processes. These techniques can be applied to any signal, as a result they conform a homogeneous platform for analysis.
XVIII Congreso Argentino de Bioingeniería SABI 2011 - VII Jornadas de Ingeniería Clínica Mar del Plata, 28 al 30 de septiembre de 2011
Figure 3. Above, classical approach: form data to knowledge. Below, our proposed scheme: from data to information and then to knowledge. It starts in the sampling process to get a uniform platform with embedded information. The entire process imitates a human being observing the signal. We will see that the segmentation and labeling process is the raw information to infer global behaviour and to extract important features of the signal. In the following sections, these techniques are presented and applied to detect ventricular fibrillation as a particular example of signal feature extraction.
2. Materials and Methods 2.1 Segmentation description If a human being watches the signal in figure 2, he can get information about the signal behaviour. We could conclude that the signal is “noisy” at the beginning. Then it reaches a maximum, a minimum and grows and falls rapidly with a spike like shape. After that, it starts to increase and then tends to a stable value. We can not measure the signal with precision but we are aware of the shape. We do not see isolated samples but the relationship among them. Therefore, we need a more complete sampling process in order to take into account samples sequences. The key process is to take into account how the signal trajectory between samples is. It is not necessary to do this for every pair of samples. Therefore, the first process is to segment the signal. Let x(t) the analog sensor signal band limited to B hertz and sampled at a frequency of Fs with uniform sampling, where Fs 2B. Since that the signal is oversampled, there will be redundancy between adjacent samples. The algorithm starts interpolating the sample between two samples, i.e. interpolates sample 2 from 1 and 3. Then, the error, as the difference between the real sample and the interpolated sample, is computed. If the error is less than a prefixed value, the sample has no relative importance because its value can be obtained from its neighbors. Now, the sample 3 is interpolated from 1 and 5 and so on. If the error exceeds a threshold, the sample is tagged as important and the process starts again, now from this sample. The interpolation is achieved by linear interpolation. If no important sample is found during N samples, the last sample is tagged and the process starts again from this sample. The tagged samples will be the left and right samples of the segment. The pseudo code of the algorithm called LIN1 is described in [12].
XVIII Congreso Argentino de Bioingeniería SABI 2011 - VII Jornadas de Ingeniería Clínica Mar del Plata, 28 al 30 de septiembre de 2011
As a result of the algorithm, two vectors are obtained, the tagged or essential samples vector mark(n), and the temporal index vector tempos(n) .The algorithm is extremely simple; nevertheless it allows real time signal segmentation and a platform for the segment shape analysis. Only a division by two is involved in the average computation. 2.2 Labeling description Each time the difference is computed in the interpolation process, the sign of the error is stored. When the segment ends, based on the majority of error signs accumulation, the behaviour inside the segment can be classified. The error sign is the clue to classify the segment. If the signal is oversampled, the trajectory of the real signal inside the segment is restricted by the interpolation error. Figure 4 shows an example of segmentation and labeling.
Figure 4. Example of segment class “g”. In this case, the interpolated samples are below of the real ones. Considering the value of the left and right samples and the sign of the interpolation error we have the simplified shapes shown in figure 5 and figure 6. In figure 5, the interpolation error does not reach a threshold so the segment ends due to it has reached the maximum size of N samples. In figure 6, the segments end due to interpolation error.
Figure 5. Class segments a,b and c. The interpolation error is less than the threshold and the segment ends, since it has reached the maximum length N.
XVIII Congreso Argentino de Bioingeniería SABI 2011 - VII Jornadas de Ingeniería Clínica Mar del Plata, 28 al 30 de septiembre de 2011
Figure 6. Class segments d,e,f,g and h. The segments are classified based on the error sign between real samples and the interpolated ones. A new vector, class(n), is added to the sensor signal description, whose elements are the segment class a, b, c, d, e, f, g, or h. The set of vectors mark(n), class(n) and tempos(n) in short MCT, conform the fundamental structure from which arises all the proposed algorithms and it is the proposed platform that captures information form data. The MCT vectors can be seen as a smart sampling process where the relationship among essential samples is clearly stated by the class vector. Why it is necessary an oversampling frequency? In order to get a uniform behaviour within the segment, i.e., most of the interpolation errors are all negative or they are all positive. Under conditions of oversampling and interpolation error approaching to zero, the probability of occurrence of segments a,b,c and h tend to zero. Therefore, only four classes of segments are important: d,e,f,g and the sequence of them indentifies the sensor signal. The vector class(n) is raw information in order to imitate a human observer. The vector class(n) is amplitude and time scale invariant. It captures only the shape information. For example, the pattern “gefd” or “gggeeeeffffddd”, captures a sinusoidal waveform and the sequence “ddddfffff” codifies a positive spike like signal. The frequency and amplitude can be obtained from the MCT vectors. In addition, the class(n) vector provides precise localization of the signal local maximums and minimums. Maximums occur at the union of “df”, “de”, “gf” and “ge” segments. Minimums occur at the union of “eg”, “ed”, “fg” and “fd” segments. We think that this vector is the “missing link” from the analog to the digital “world” in the traditional digitalization process, because it captures the shape information of the signal. Important signal features can be inferred from the sequence of segments. For example, a sequence of class “g” segments indicates that the signal has an exponential shape that tends to a steady state value if the length of the segments is increasing. A sequence of segments class “d” indicates that the signal is growing rapidly and class “f” that it is decaying quickly. Figure 7 shows some examples of waveform identification looking for sequences of segments.
XVIII Congreso Argentino de Bioingeniería SABI 2011 - VII Jornadas de Ingeniería Clínica Mar del Plata, 28 al 30 de septiembre de 2011
Figure 7. Examples of waveform identification through sequence of segments. The MCT set of vectors is our normalized information platform from which arises all the proposed algorithms. Matlab software was used to program the proposed algorithms. We tested the performance of pathologies detection using real data from the collection of recorded physiologic signals, freely available from PhysioNet [13]. 3. Algorithm for fibrillation detection One of the clues for detecting the chaotic behaviour of VF is the lack of regularity in the RR time interval. An additional characteristic is the increment in the heart beat frequency beyond normal limits. In episodes of ventricular tachycardia (VT) the heart beat frequency is high but there is regularity in the RR period with a spike like signals. Since that the RR time interval is a random variable, we will use the standard deviation as another parameter to infer VF. Therefore, we need a precise detection of the QRS complex which is presented in the next subsection. 3.1. QRS pattern detection The algorithm is based on the information provided by the MCT vectors. The class(n) vector has the property that easily locates maximums and minimums of the segmented signal. Figure 8 shows a real QRS complex and the output of the segmentation and labeling processes. The red line is the linear interpolation from the tagged samples. This interpolation is not part of the process; it is shown only to remark the segments.
XVIII Congreso Argentino de Bioingeniería SABI 2011 - VII Jornadas de Ingeniería Clínica Mar del Plata, 28 al 30 de septiembre de 2011
Figure 8. Segmentation and labeling applied to test signal (426m.dat from MIT-BIH Malignant Ventricular Arrhythmia database, interpolation error=3, Fs=250 Hz. Below, the resultant MCT vectors showing the maximums and minimums. QRS pattern detection begins looking for the trio min-max-min. Then, five conditions must be satisfied in order to qualify as a normal pattern: a) The raising section must be class “d” dominant segment. b) The falling section must be class “f” dominant segment. c) The difference of the min values must be a fraction of the difference between the max value and the average of the min values. d) The difference between the height and the base should be greater than a preset value. e) The energy of the impulse, estimated as the area of a triangle should be inside a range.
Figure 9. QRS pattern candidate and its nomenclature. Specifically, for the PhysioNet database with a sampling frequency of 250 Hz and using the nomenclature of the figure 9, we employ: a) The raising section should contain at least two class “d” segments. b) The falling section should contain at least two consecutive class “f” segments.
XVIII Congreso Argentino de Bioingeniería SABI 2011 - VII Jornadas de Ingeniería Clínica Mar del Plata, 28 al 30 de septiembre de 2011
c)
dif _ bases [abs( mark (max) base _ average)] Where, dif _ bases abs[ mark (min L) mark (min R)] base _ average [mark (min L) mark (min R )]/ 2
(1) (2) (3)
abs[( mark (max) base _ average) / base _ width] Where, base _ width tempos (min R) tempos (min L )
(4) (5)
d)
e) (6) 2 Energy 1 (7) Where, Energy base _ width * ( mark (max) base _ average) / 2 For the experimental results shown in this paper, we have used: 0.42; 2.0; 1=1200; 2=6000. Figure 10 shows experimental results of QRS detection. The proposed algorithm has an excellent performance even with base line drift and noise.
Figure 10. QRS detection applied to 426m.dat from MIT-BIH Malignant Ventricular Arrhythmia database, interpolation error=3, Fs=250 Hz. “+” implies detection. If we analyze the reason of QRS pattern rejection, it is possible to detect other pathologies. For example, figure 11 shows a zoom of the lower part of figure 10 where pattern were rejected due to excessive difference between minimum values that could point out premature ventricular contraction (PVC).
Figure 11. Zoom of the lower part of figure 11 showing rejected patterns that could indicate PVC (Premature Ventricular Contraction). 3.2. Ventricular fibrillation detection Figure 12 shows the algorithm applied to an ECG signal with VF. We can observe the change of pattern showing increment of frequency content and an irregular shape.
XVIII Congreso Argentino de Bioingeniería SABI 2011 - VII Jornadas de Ingeniería Clínica Mar del Plata, 28 al 30 de septiembre de 2011
Figure 12. Transition to VF episode, from MIT-BIH Malignant Ventricular Arrhythmia database, interpolation error=3, Fs=250 Hz. Record 426. “+” implies QRS detection. Figure 13 shows the instantaneous heart beat. During the VF episode the QRS detection follows the chaotic behaviour of the signal. If VF persists the detection usually tends to zero.
Figure 13. Instantaneous beat per minute for the signal in figure 13. Therefore, the proposed algorithm for VF detection is shown in figure 14. There are two temporal windows, one for VF episode and one for back to normal state. Once we have detected a frequency in the range of, for example 200-500 BPM, the VF window is open to discard interference. In this state, VF is confirmed by two parameters. First, the estimated variance of the instantaneous heart beat should be high or the hear beat should tend to zero due to the algorithm is not detecting pulses. If none of these conditions are met, we open temporal window to go back to the normal state. These windows should be in the range from 2 to 5 seconds.
4. Conclusions A normalized platform was proposed to analyze ECG signals. In this paper the focus was on ventricular fibrillation detection as an application of the proposed techniques. These algorithms can be seen as a complete sampling process followed of a morphological treatment. All the results shown in this paper were obtained from real ECG signals of the PhysioNet database without any prefiltering. VF detection was used as an example of simplicity and versatility of the proposed techniques. This paper shows only preliminary results. Adding other algorithms based on MCT vectors would allow us to achieve sensory knowledge fusion to infer more accurately the different pathologies present in an ECG signal.
XVIII Congreso Argentino de Bioingeniería SABI 2011 - VII Jornadas de Ingeniería Clínica Mar del Plata, 28 al 30 de septiembre de 2011
Figure 14. Algorithm for VF detection.
5. References [1] [2] [3]
[4] [5] [6]
[7]
[8] [9] [10] [11] [12] [13]
Valentinuzzi M E 2010 Cardiac Fibrillation-Defibrillation: Clinical and Engineering Aspects. In Series on Bioengineering and Biomedical Eng. World Scientific Publishers, Singapore http://www.americanheart.org/presenter.jhtml?identifier=4784 Thakor N V, Zhu Y S, and Pan K Y 1990 Ventricular tachycardia and fibrillation detection by a sequential hypothesis testing algorithm. IEEE Transaction on Biomedical Engineering, 37(9):837–43 Pan J and Tompkins W J. 1985 A real-time QRS detection algorithm. IEEE Trans Biomed Eng, 32(3):230–6 Chen S, Thakor N V, and Mower M M 1987 Ventricular fibrillation detection by a regression test on the autocorrelation function. Med Biol Eng Comput, 25(3):241–9 Barro S, Ruiz R, Cabello D, and Mira J 1989 Algorithmic sequential decision-making in the frequency domain for life threatening ventricular arrhythmias and imitative artefacts: a diagnostic system. J Biomed Eng, 11(4):320–8 S. M. Szilagyi, Z. Benyo, L. Szilagyi and L David 2003 Adaptive wavelet transform based ECG waveforms detection, Proceedings of 25th Annual IEEE EMBS International Conference, No. 24, pp. 12-15 Amann A, Tratnig R and Unterkofler K S, 2005 A New Ventricular Fibrillation Detection Algorithm for Automated External Defibrillators, Computers in Cardiology, 32:559-4 Clayton R H, Murray A and Campbell R W 1994 Recognition of Ventricular Fibrillation Using Neural Networks, Medical and Biological Engineering and Computing,Vol 32(2) 217-220 Poli R, Cagnoni S and Valli, G 1995 Genetic design of optimum linear and nonlinear QRS detectors, IEEE Transaction On Biomedical Engineering, Vol. 42, pp. 1137-1141 Geddes L A and Roeder R A 2002 The First Electronic Electrocardiograph Cardiovascular Engineering Vol 2 Number 2 pp 73-79 Monte G Sensor Signal Preprocessing Techniques for Analysis and Prediction 2008 , IECON 2008 34th Annual Conference of IEEE. pp 1788-1793 Massachusetts Institute of Technology, MIT-BIH arrhythmia database http://www.physionet.org/physiobank/database/mitdb