Developing Custom Signal Processing Algorithm with LabView FPGA and Compact RIO to Detect the Aortic Stenosis Disease B Al-Naami1, J Chebil1, B Trabsheh1, H Mgdob2 1
Hashemite University, Zarqa, Jordan University of Sussex, Brighton, UK
2
background information about heart sound auscultation. An overview of wavelet analysis is given in Section 3. Description of reconfigurable I/O (RIO) technology, Field-Programmable Gate Arrays (FPGAs), the data and the methodology used in the analysis are discussed in Sections 4 and 5. Description of the data and the methodology used in. Section 6 discusses the results obtained. Finally, Section 7 concludes the paper.
Abstract FPGAs provide an ideal template for run-time reconfigurable (RTR) designs. Only recently have RTR enabling design tools that bypass the traditional synthesis and bit stream generation process for FPGAs become available. Heart auscultation which is the interpretation of sounds produced by the heart is a fundamental tool in the diagnosis of heart disease. It is the most commonly used technique for screening and diagnosis in primary health care. This study aims at utilizing the discrete wavelet packet transforms in early detection of an Aortic Stenosis (AS) using heart sound data collected at Sussex University Hospital in England. From the data analysis, a criteria has been proposed for the detection of the AS disease from the heart sound data.
1.
2.
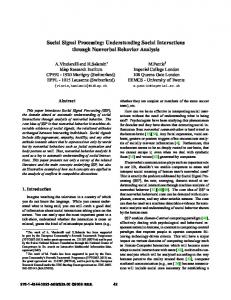
The technique of listening to the sounds produced by organs and vessels of the body is called auscultation. Phonocardiography (PCG) consists of the registration of the vibrations originating in the heart and associated blood vessels in order to obtain a visual record of the phenomena. Many studies attempted to extract features from heart sounds in order to understand their mechanisms as well as aiding in diagnosis. The techniques for recording and analysis have been changing as new electronic devices and signal processing techniques have become available. The heart sounds are those generated as a result of mechanical vibrations due to contraction and relaxation of the heart cavities. The heart sounds have been described and classified, basically in terms of duration and pitch, in order to identify them. The first and the second heart sounds are related to complete closure of the Atrioventricular (AV) and semilunar valves, respectively (Figure 1a). The first heart sound (S1) marks the beginning of mechanical systole. It consists of two intense high-frequency bursts of vibrations at the time of the AV closure and a few variable low-intensity vibrations [1]. The two components are known as M1 and T1 corresponding to the mitral and tricuspid components. The second heart sound (S2) marks the beginning of mechanical diastole. It consists of two high-frequency components that relate to the closure of the aortic and pulmonic valves, A2 and P2 respectively. The detection of the two components, their intensity, and time relation provide valuable diagnostic clues [1-3].
Introduction
Development of auscultation techniques for the diagnosis of heart disease and disorders is still growing. Experience gives the cardiologists the ability to detect abnormalities such as the presence of murmurs, which may indicate a pathological condition. The description of murmurs is an important task and, when auscultation is carried out, the cardiologist's notes are the sole record of the patient's condition. These facts are subjective and can be interpreted in different ways. In order to eliminate subjectivity a signal processing method is needed for the representation of the first heart sound S1, second heart sound S2 and murmurs. Since 1991, many researchers have shown that continuous wavelet analysis can provide an adequate representation of the primary heart sounds. For most applications, however, the goal of signal processing is to represent the signal efficiently with fewer parameters. This paper considers the representation of murmurs by exploring the use of discrete wavelet packet transform (DWPT) using the wavelet base Daubechies ‘db4’. The paper is structured as follows. Section 2 presents
ISSN 0276−6547
Heart sound and auscultation
193
Computers in Cardiology 2006;33:193−196.
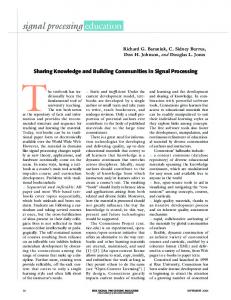
Murmurs can be pathologic, when they are produced by an abnormal heart (Figure 1b). The most common symptoms are congestive heart failure, angina pectoris, and syncope. When the symptoms of aortic stenosis appear in a patient they indicate the point at which the left ventricle can no longer generate the elevated systolic pressure required. Among the valvular diseases, the patients with aortic stenosis show the shortest survival. The average survival after the development of symptoms in individuals with untreated aortic stenosis is 1.5 to 3 years [4]. Sudden death may also occur, 3 to 5 % of patients may die suddenly during the asymptomatic period as well as in 15-20 % of symptomatic patients [5].
of the signal. For most applications, however, the goal of signal processing is to represent the signal efficiently with fewer parameters. The use of the discrete wavelet transform (DWT) can reduce the time bandwidth product of the wavelet transform output. Performing a wavelet transform consist of convolving the signal with time shifted and dilated. The result of wavelet transform will be a set of coefficients, which are function of time and scale. These coefficients can be used to form a set of features that unambiguously characterize different types of signals [6].
DWPA
1 0.8 0.6
Normalized output
0.4 0.2
L1
0
H1
-0.2 -0.4 -0.6
LL2
-0.8 -1
0
0.1
0.2
0.3
0.4 0.5 Time in second
0.6
0.7
0.8
heart
Beat
0.6
0.2 Normalized output
HLL3 LHL3
HHL3 LLH3
HLH3 LHH3 HHH3
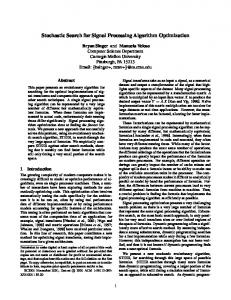
The dilation function of the DWT can be represented as a tree of low and high pass filters, with each step transforming the low pass filter into further lower and higher frequency components. The original signal is successively decomposed into components of lower resolution, while the high frequency components are not analysed any further. In contrast with the regular DWT, the discrete wavelet packet analysis (DWPA)can significantly increase the versatility (Fig.2) and power of the discrete wavelet transform. Unlike the DWT, which only decomposes the low frequency components, the discrete wavelet packet analysis utilises both the low frequency components, and the high frequency components [7]. From these frequency components and using entropy-based criterion, a method for choosing the optimum scheme for the identification of Aortic Stenosis Disease can be developed. Entropy is a common concept in signal processing. Classical entropy-based criteria describe information related properties for an accurate representation of a given signal [8]. There are many entropy criteria among them: Shannon entropy, energy entropy, norm entropy and
0.4
0 -0.2 -0.4 -0.6 -0.8
0
0.1
0.2
0.3
0.4 0.5 Time in second
0.6
0.7
0.8
0.9
Figure 1. b)Heart Beat for AS patient.
3.
HH2
Figure 2. Filter bank representation of the DWPA decompositions. [10]
0.8
-1
LH2
0.9
LLL3
Figure1.a)Normal
HL2
Wavelet analysis
The continuous wavelet transform maps a onedimensional time signal to a two–dimensional time-scale joint representation. The time bandwidth product of the continuous wavelet transform output is the square of that
194
FPGA threshold entropy [9]. In this study, norm entropy is used to extract some features from the PCG signals.
4.
PCG signal/RI O
Reconfigurable I/O (RIO) Technology
With NI RIO technology, you define your own custom measurement hardware circuitry using reconfigurable FPGA chips and LabView graphical development tools. Now you can take advantage of reconfigurable FPGA technology to automatically synthesize a highly optimized heart sound detection implemented of your input/output system fig. 3.a.
VI Code For Feature Extraction
VI Code for Features Classifica
Figure 3.b General procedure for the identification of aortic stenosis disease three processes as described in Fig. 3.b. The first step in processing the PCG signals is to clean it from noise associated with PCG systems. Noise is caused by breast sounds; contact of the stethoscope with skin, ambient noise that may corrupt the heart sounds [11]. The data is filtered with high-pass Butterworth filter to eliminate noise. The Butterworth filter is selected because it has the least steepness of the amplitude response in the transition region. In the second stage, the DWPT (Fig. 2) is used to extract features that can be useful in the classification stage. The wavelet base Daubechies ‘db4’ is used since it has oscillations very similar to those of a PCG signals. In the last step, the norm entropy-based criterion is used for the classification of PCG signals.
Figure 3.a Reconfigurable I/O technology
6. 5.
VI Code for Data Cleanin g
Field-Programmable Gate Arrays
Results and discussion
The PCG signals were normalized in energy to take into account the disparity in magnitude due to the different amplification used during acquisition as well as the variation induced by the lead sites. We determine the DWPT coefficients at level 6 for all nodes k=0,1, 2,.., 64. For DWPT level 6, the frequency band is divided into equal interval of length 32 Hz. Each node covers a frequency band, for example the 1st node cover the frequency range 0 to 32 Hz, the second node covers the frequency range 32 to 64 Hz and so on. The frequency bands that are not very prominent in the original signal will have very low amplitudes, and these bands can be ignored without major loss of information. For the PCG signals, it is sufficient to study its behavior for the frequency range 30-256Hz which corresponds to DWPT nodes k=2, 3, …, 8. Then the entropy is computed at each node but at four time intervals: τ1: Time duration of S1 sound τ2: Time duration of S2 sound τ12: Time interval between S1 and S2 τ21: Time interval between S2 and the next S1 Let’s denote by E1, E12, E2 and E21 the entropy computed for the time intervals τ1, τ12, τ2 , and τ21 respectively. An example of the variation of E1, E12, E2 and E21 for each frequency band is shown in Figures 4 and 5. The variation of the entropy with respect to the time interval and for each frequency band is studied for all the available data in order to determine some criteria to
(FPGAs) FPGA devices are widely used by control and acquisition system vendors because of their performance, reconfigurability, small size, and low engineering development costs. FPGA based devices have been traditionally vendor defined rather than user defined because of the complexity of the electronic design tools. Now you can take advantage of user-programmable FPGAs to create highly optimized reconfigurable control and FPGA devices feature a reconfigurable digital architecture with a matrix of configurable-logic blocks (CLBs) surrounded by a periphery of I/O blocks. Signals can be routed within the FPGA matrix in any arbitrary manner by programmable interconnect switches and wire routes. Compact RIO offers 4 and 8-slot chassis with options for either 1million or 3 million gate FPGA chips. Representation of murmurs from pathologic and nonpathologic subjects has been acquired from 20 patients with aortic stenosis and with different degrees of valve competence. The PCG data is collected at a sampling frequency of 4096 Hz. The algorithm of processing and identification of aortic stenosis disease implemented by the LabView package-signal processing toolkit, and can be divided into
195
Entropy
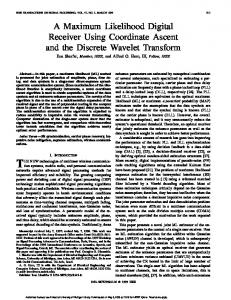
distinguish between normal and aortic stenosis signal. It is observed that for normal data beat, E1 is larger than E2 and E12 and E21 are generally smaller for the frequency bands 32 to 128 Hz. 1.00E+06 9.00E+05 8.00E+05 7.00E+05 6.00E+05 5.00E+05 4.00E+05 3.00E+05 2.00E+05 1.00E+05 0.00E+00
disease.
7.
Heart auscultation can be improved considerably by using modern digital signal processing techniques. This study utilizes the discrete wavelet packet transforms and the FPGA PXI 7831R in early detection of an Aortic Stenosis(AS) using heart sound data collected at the Hashemite University in Jordan . From the analysis of the data, a criteria has been proposed for the detection of the AS disease from the heart sound data. However, the number of data is limited and more is needed to validate the proposed criteria.
E1 E12 E2 E21
1
2
3
4
5
6
7
8
References
Frequency bands
Figure 4. Typical Norm Entropy for a normal PCG signal obtained by the FPGA and RIO.
[1] Braunwald E. Heart Disease, Second Edition. Philadelphia: WB Saunders, 1984;409-446. [2] Tilkian AG, Conover MB. Understanding Heart Sounds and Murmurs with an Introduction to Lung Sounds, third edition, Philadelphia WB. Saunders Company, 1993; 204237. [3] Leatham A. Auscultation of the Heart and Phonocardiography, 2d ed. Edinburgh; New York: Churchill Livingstone, 1975; 1–178. [4] Ahumada GG. Cardiovascular Pathophysiology, Oxford University Press 1987. [5] Schlant RC, Alexander RW. The Heart, eighth edition, McGraw Hill, 1994;1637-45. [6] V. Giurgiutiu, A. Cuc, P. Goodman “Review of vibrationbased helicopters health and usage monitoring methods”, 55th Meeting of the Society for Machinery Failure Prevention Technology, Virginia Beach, VA, April 2001. [7] Altmann J, Mathew J. Multiple band-pass autoregressive demodulation for rolling-element bearing fault diagnosis, Mechanical Systems and Signal Processing, Volume 15, Issue 5, pp. 963-977, September 2001. [8] Coifman RR, Wickerhauser MV. Entropy-based algorithm for best basis selection. IEEE Trans. On Information Theory, March 1992; 38, 713-718. [9] Misiti M, Misiti, YG, Oppenheim JM, Poggi . Matlab wavelet toolbox User’s Guide. The MathWorks, Inc., 2001. [10] Noel G, Chebil J, Mesbah MM, Deriche MM and Mathew J. Diagnosis of faulty ball bearing using wavelet decomposition. Proceedings of The Tenth Asia-Pacific Vibration Conference (APVC 2003), Gold Coast, Australia, 12th - 14th November 2003;.520-525. [11] Messer SR, Agzarian J and Abbott D. Optimal Wavelet Denoising for Phonocardiograms. Microelectronics Journal 2001; 32: 931-941.
350
E1 E12
300
E2 E21
Entropy
250 200 150 100 50 0 1
2
3
4 5 6 Frequency bands
7
Conclusion
8
Figure 5. Typical Norm Entropy for a AS PCG signal obtained by the FPGA and RIO. This result is expected since the normal PCG signal has higher energy during the heart sound S1 and S2 which corresponds to higher value of E1 and E2. In addition, the amplitude of E1 and E2 is highest in the band 32-96 Hz, then it decreases respectively in the band 96128, 64-96, and 128-160Hz. For the frequency band 160255 Hz, the entropy values are generally small. For the aortic stenosis data, it is noted that E1 is larger than E12 and E2 and E21 are generally smaller for the frequency bands 32 to 160 Hz. This indicates that the signal has more energy between the heart sound S1 and s2 due to systolic mummer. Moreover, the amplitude of E1 and E12 is highest in the band 0-32, 160-256 Hz, and then it decreases respectively in the band 32-160. For the frequency bands 160-256 Hz, the value of E1 and E12 is comparatively higher than that of a normal PCG signal. From these observations, we can propose the following criteria. If E1 is larger than E2 and both are larger than E12 and E21, then the heart sound signal is normal. If E1 is larger than E12 and both are larger than E2 and E21, then the heart sound signal has the symptom of aortic stenosis
Address for correspondence Dr. Bassam Al-Naami Department of Biomedical Engineering The Hashemite University Zarqa- Jordan
[email protected]
196