active learning of logistic regression classi- fiers. A-optimality has attractive theoretical properties, and empirical evaluation confirms that it offers a more robust ...
A-Optimality for Active Learning of Logistic Regression Classifiers∗
Andrew I. Schein and Lyle H. Ungar Department of Computer and Information Science Levine Hall, 3330 Walnut Street Philadelphia, PA 19104-6389 {ais,ungar}@cis.upenn.edu
Abstract Over the last decade there has been growing interest in pool-based active learning techniques, where instead of receiving an i.i.d. sample from a pool of unlabeled data, a learner may take an active role in selecting examples from the pool. Queries to an oracle (a human annotator in most applications) provide label information for the selected observations, but at a cost. The challenge is to end up with a model that provides the best possible generalization error at the least cost. Popular methods such as uncertainty sampling often work well, but sometimes fail badly. We take the A-optimality criterion used in optimal experimental design, and extend it so that it can be used for pool-based active learning of logistic regression classifiers. A-optimality has attractive theoretical properties, and empirical evaluation confirms that it offers a more robust approach to active learning for logistic regression than alternatives.
1
INTRODUCTION
A recent trend in machine learning has focused on pool-based settings where unlabeled data is inexpensive and available in large supply, but the labeling task is expensive. Pool-based active learning methods attempt to reduce the “cost” of learning in a pool-based setting by using a learning algorithm trained on the existing data and selecting the portion of the remaining data with the greatest expected benefit. In classification settings benefit is measured in terms of the generalization accuracy (or error) of the final model. The University of Pennsylvania Department of Computer and Information Science Technical Report No. MSCIS-04-07 ∗
In this paper we derive an objective function, called A-optimality, for measuring the expected benefit of labeling an example for logistic regression. In the design of experiments (DOE) literature (Fedorov, 1972; Chaloner & Verdinelli, 1995), other special cases of the same function have proven useful for designing linear regression and location/scale logistic regression experiments. We will evaluate A-optimality in training more general forms of logistic regression models in classification settings where the goal (or “experimental objective”) is to build a classifier with the least generalization error. Active learning methods are typically implemented as a greedy procedure that iteratively pick a new example from a pool for labeling according to a black box scoring function. Since the distinguishing characteristic between active learning methods is the function used to pick the next example, we will frequently refer to alternative active learning methods in terms of their example-scoring functions. Scoring functions may explicitly attempt to maximize an objective function, as is the case for A-optimality. Alternatively, they may consist of heuristics with no explicit objective function, as is the case for uncertainty sampling and (most) query by committee methods of active learning. There are many possible example scoring functions with varying performance characteristics and computational costs. In evaluating the quality and risks of an active learning method we look for two important traits: 1. The method must, in general, lead to attractive performance gains over random sampling from the pool. 2. The method must, in almost all cases, give performance that is at worst the quality of random sampling from the pool. Our empirical evaluations on four data sets demonstrate that A−optimality for logistic regression satisfies both of these desiderata. We derive and evaluate A−optimality in training binary logistic regression classifiers, however the method generalizes to multi-
category classifiers.
2
BACKGROUND AND RELATED WORK
graphical model structure (Tong & Koller, 2001) and probabilistic models for information retrieval (Zhang & Chen, 2002). Space limitations will prevent us from exploring these strains of research in detail.
3 Hasenj¨ager (Hasenj¨ager, 2000) divides active learning methods into heuristic approaches and optimization (or objective function) approaches, a categorization scheme we will follow in this section. The most often employed methods are the heuristic methods: uncertainty sampling and query by committee. In the uncertainty sampling method proposed by Lewis and Gale (Lewis & Gale, 1994), the existing model predicts class labels over the unlabeled pool and takes the example with the least certain classification for labeling. In probabilistic classifiers, uncertainty can be measured by the entropy of the predictions. The query by committee method (Seung et al. , 1992) generates a committee of classifiers and picks examples with high committee disagreement for human labeling. The query by committee method is derived along with analytical performance bounds for Gibbs classifiers in noise-free classification domains, however it is mostly evaluated as a heuristic method in domains where the theory does not apply, for example, document classification using naive Bayes (McCallum & Nigam, 1998). Since the seminal work, several researchers have proposed alternative measures of disagreement and alternative methods for building an ensemble of classifiers, for instance (McCallum & Nigam, 1998). The optimization strain of research attempts to derive objective functions from the underlying assumptions of specific machine learning algorithms. This is the approach we take in this paper in defining an objective function that minimizes the variance of a logistic regression model’s predictions. An analogous criteria was derived for reducing the variance portion of error in a feedforward neural networks (MacKay, 1991; Cohn, 1994), as well as the variance of other statistical models (Cohn et al. , 1996). These techniques may all be classified under the rubric of “prediction variance minimization methods,” and they appear widely applicable to methods that use error as an objective function (e.g. neural networks) and maximum likelihood methods (e.g. logistic regression). Minimizing the variance is one of a handful of objective functions used to derive a criterion for active learning for various classifier algorithms (c.f. (MacKay, 1991; Roy & McCallum, 2001)). In recent years, optimization and heuristic approaches have been applied to a broader array of models and learning tasks including learning: large margin classifiers (Schohn & Cohn, 2000; Tong & Koller, 2000),
FROM SCIENTIFIC MODELING TO CLASSIFICATION
Experimental design research for logistic regression has focused on the two parameter, single predictor model (Chaloner & Larntz, 1989; Davis & Prieditis, 1999): 1 , 1 + exp(−α(x − µ)) α ∼ U(a, b) µ ∼ U(a′ , b′ )
P(y = 1|x, α, µ)
=
(1) (2) (3)
where the response variable y takes on the class labels {0, 1}. This is a Bayesian model with a uniform distribution on the parameters. The parameter µ is called the ‘location parameter’, and it takes on the value of x s.t. P(y = 1|x, α, µ) = 0.5. The parameter α, called the “scale parameter,” encodes the change in probability with respect to x. Chaloner and Larntz (Chaloner & Larntz, 1989) generalize several of the classic experimental design objective functions for linear regression to this class of models for answering such questions as: For what value x does P(y = 1|x) = γ, where γ ∈ (0, 1). Note that the goal of the experiment described above is to learn something about x and therefore the underlying model that generates the response variable. In contrast, the goal of active learning is to build a model with the best generalization accuracy/error. This subtle difference in emphasis between the optimal experimental design community and the active learning community boils down to the observation that the optimal design researchers believe their models actually generate the response variable when deriving criteria for designing experiments, and therefore they can learn something about a natural process by conducting an experiment. For our experiments in active learning, the logistic regression uses more than two parameters. The parametric form of the model is : = σ(x′ β), where 1 σ(θ) = 1 + exp(−θ)
P(y = 1|x, β)
β
∼ N (0, σp2 I).
(4) (5) (6)
The term x′ β denotes the dot product of two vectors: x, the predictors, and β, the model parameters.
In the two-parameter case, Equations 1 and 4 are equivalent, modulo the different choice of priors. Defining the shorthand σn = σ(x′n β) for observation n, the log-likelihood of the model we use for training classifiers is given by: " # X L = yn log σn + (1 − yn ) log(1 − σn ) (7)
choosing which examples to label is defined as: X X ˆ = ˆ − σ(x′ β)]2 . (10) Var(σ(x′n β)) E[σ(x′n β) n n∈Pool n∈Pool In other words, we want the model predictions over the entire pool to be as close as possible to the predictions of the “true” model, in the squared loss sense.
n
−
1 ||β||2 . 2σp2
The penalized log likelihood of Equation 7 can be viewed as a consequence of the prior on β, or equivalently the prior can be viewed as the Bayesian interpretation of the regularization term 2σ1 2 ||β||2 . In exp perimental design it is necessary to take the Bayesian viewpoint in order to start with a model with no training data and pick a training set. In active learning we do not necessarily begin biased sampling with the first observation; we can start with a random seed of examples. In this paper we take the regularization view of the model (c.f. (Cessie & Houwelingen, 1992)) rather than the Bayesian view. Our Gaussian priors over parameters build in no domain knowledge, but are instead a potential interpretation of the parametric form of the regularization.
4
A-OPTIMALITY FOR LOGISTIC REGRESSION
We now derive an objective function for active learning of logistic regression classifiers. Denote by β the true parameter values and by βˆ the maximum likelihood (ML) estimates of the model parameters. Since we believe by and large that the response distributions are not parameterized by the model, true parameters β can be viewed as the values the parameters take in the limit as the training set increases. A consequence of the representation of logistic regression in its exponential family form is that: ˆ −1 ) asymptotically, θˆ ∼ N (θ, I(X, θ)
(8)
ˆ denotes the observed Fisher information where I(X, θ) matrix of the regularized logistic regression model: " # X £ ¤−1 ′ ˆ I(X, θ) = (9) xn x σn (1 − σn ) + σ 2 I n
p
n
and X denotes the training set predictor matrix, often called the design matrix. The observations xn are vectors formed from the rows of the training set matrix X. The objective function we seek to minimize when
We approximate Equation 10 using two steps of a Taylor expansion around σ(x′ β): ˆ ≃ σ(x′ β) + c′ (βˆ − β), where σ(x′n β) n n ∂ ∂ σn , . . . , σn )′ cn = ( ∂β1 ∂βd
(11) (12)
is the gradient vector for σn . Using the Taylor series approximation we have: ˆ Var(σ(x′n β))
≃ Var(c′n (βˆ − β)) (13) ′ −1 ˆ ≃ cn I(X, β) cn from (8) (14)
Equation 14 is known as c-optimality, which minimizes the prediction variance overPa single observation. Defining An = cn c′n and A = n An we derive a formula for minimizing the variance over the pool: o n X X ˆ −1 cn = ˆ −1 c′n I(X, β) tr An I(X, β) n∈Pool n∈Pool o n ˆ −1 (15) = tr AI(X, β) . = φ(X, y).
(16)
Equation 15 is the A−optimality objective function for logistic regression with the A matrix that gives the method its name. Frequently the A matrix will be noˆ in order to make explicit tated in the literature as A(θ) the dependency of the matrix on the model parameters (or equivalently the labeling of the training set) that we have left implicit in our own notation. We use instead the φ(X, y) notation to show the dependency of the criterion on the response value of the training set in what follows. Equation 15 shows how to compute the utility of a labeled training set. We now need to derive a quantity that describes the expected benefit of labeling a new observation. We denote the labels of the training set by y and the training set predictors (encoded by a design matrix X) by T . Then using the current estiˆ mated model P(y|x), the expected benefit of labeling observation xn is: ˆ n = 1|xn )φ(T ∪ {xn } , y ∪ {1}) φ(T , y, xn ) = P(y ˆ n = 0|xn )φ(T ∪ {xn } , y ∪ {0}). + P(y (17)
Ignoring model-fitting, the worst-case computational cost associated with picking a new example is: O(KN D2 +KD3 )1 , where N is the number of pool examples used to create the A matrix, K is the number of candidates evaluated for inclusion in the training set and D are the number of predictors in the model. The N term may be reduced using Monte Carlo sampling from the pool.
5
ALTERNATIVE ACTIVE LEARNING METHODS
We evaluate A−optimality against two alternative methods: uncertainty sampling and expected log loss reduction (ELLR). 5.1
UNCERTAINTY SAMPLING
Uncertainty sampling (introduced in Section 2) in our implementation uses prediction entropy to select examples for labeling. The motivation for the approach is that observations with uncertain predicted labelings are more likely to be misclassified than observations with certain predicted labelings. As pointed out by Lewis and Gale, the method has several theoretical failings including: “underestimation of true uncertainty, and biases caused by nonrepresentative classifiers” (Lewis & Gale, 1994). In the Evaluation section we demonstrate an additional failing of the uncertainty sampling: that even a model that has been trained with large representative data sets may diverge towards an inferior model when fed additional examples by this method. Using uncertainty sampling, the computational cost of picking an example from K candidates is: O(KD) where D is the number of predictors. 5.2
EXPECTED LOG LOSS REDUCTION
Expected log loss reduction (ELLR), advocated by (Roy & McCallum, 2001), is a technique for more directly minimizing a loss function of interest than the uncertainty sampling or query by committee heuristics. The technique is general to a large class of loss functions, however the authors demonstrate success with the log loss function: X ˆ L(X, y) = − P(y|x) log P(y|x) (18) x∈Pool where P(y|x) denotes the probability of the hypothetˆ ical “true” model, and P(y|x) denotes the probability using the current model. Unfortunately, the “true” 1 We assume the most naive of implementations for the matrix calculations.
probabilities P(y|x) are unknown and so an ad-hoc ˆ approximation of using the current model P(y|x) is employed instead: ˆ L(X, y) = −
X
ˆ ˆ P(y|x) log P(y|x).
(19)
x∈Pool
Measuring the benefit of adding an observation is computed by an expectation similar to Equation 17. ˆ Using the current model probabilities P(y|x) may cause problems for ELLR due to variance in predictions, causing and early bias that takes a partially trained model astray early in the learning curve. Roy and McCallum introduce bagging to cut down the variance affect in naive Bayes. MacKay proposes an objective function equivalent to Equation 19 for active learning of logistic regression classifiers, but with variance handled analytically (in a Bayesian framework) at the expense of implementation complexity (MacKay, 1991). A−optimality takes the alternative approach of making minimization of this variance the objective function for active learning. Excluding the cost of model fitting, implementation of ELLR is at worst: O(BKN D), where B is the number of classifiers in the bag, N is the number of observations from the pool used to compute the benefit of adding an observation, D is the number of predictors, and K is the number of candidates evaluated for labeling. An approximation that is used for ELLR as in computing the A matrix of A−optimality is the sum over the pool; Monte Carlo sampling reduces this burden.
5.3
METHOD RELATIONSHIPS
The ELLR method can be interpreted as a cousin to uncertainty sampling. Uncertainty sampling chooses examples with the most entropic prediction values. ELLR on the other hand picks examples such that the predictions of the pool remainder are least entropic. A−optimality can be interpreted as a method that combines components of both example uncertainty and prediction certainty. Example uncertainty plays a role in A−optimality because uncertain examples have a larger impact in defining I(X, β) (see Equation 9), so uncertain examples have a tendency to decrease the function φ(X, β) when all other factors held constant. The probabilities of the predictions play a role as well since the elements of the A matrix have a tendency to decrease as Equation 19 decreases. As the entries of A decrease in magnitude so does the criterion φ(X, y) when all other factors are held constant.
Table 1: Descriptions of the data sets used in the evaluation. Included are counts of: the number of observations (OBS), the number of predictors (PRED) and the number of observations in the majority class (MAJ) DATA SET FCT WDBC TD SJGS
6
OBS 20,000 569 711 3190
PRED 54 30 21 36
MAJ 10,210 357 400 1655
EVALUATION
We evaluate the method on four data sets chosen from the UC Irvine data repository (Blake & Merz, 1998): Forest Cover Type (FCT), Wisconsin Diagnostic Breast Cancer (WDBC), Splice Junction Gene Sequence (SJGS), and Thyroid Domain (TD). The data sets were converted to a binary classification task by merging all but the most representative class label into a single class. Table 1 describes the data set characteristics after formatting while the individual processing steps are described below. In all evaluations we train a binary logistic regression including a bias term using the regularization σp2 = 1 until convergence. For computation of the A−optimality score we use the same prior (i.e. our model for active learning exactly matches the model we train). ELLR was trained without bagging. A bag size of 5 dramatically slowed down the evaluation, sometimes helping but also increasing the number of cases where ELLR performs worse than random sampling. We suspect that stability of logistic regression (compared to decision trees or naive Bayes) in combination with a small bag size was behind the case where bagging hurt performance. Since a bag size of 20 or 30 was impractical, we eliminated bagging from the experiments altogether. 6.1
DATA SET PREPARATION
The Forest Cover Type (FCT) data set consists of measurements of 30x30 meter cells of forest land conducted by the US Forest Service. The task associated with the data set is to predict, using the measurements, which of 7 tree categories is growing in the cell. According to the data only one type of tree grows in each cell. The original number of records, 581, 012, is massive and so we randomly sampled the data set to reduce it to 20,000 observations. The number of predictors in the data set is 54. The lodgepole pine variety of tree happens to represent about 50% of the observations and
so we merge all other tree types into a single category. The Wisconsin Diagnostic Breast Cancer (WDBC) data set consists of evaluation measurements (predictors) and final diagnosis for 569 patients. The goal is to predict the diagnosis using the measurements. The number of predictors is 30. The Thyroid Domain (TD) data set (called “thyroidann” in the repository) consists of patient evaluation measures and three classes: underactive thyroid, overactive thyroid and normal thyroid. We merge the underactive and overactive thyroid classes into a single class. The number of predicts is 21 and the number of observations is: 711. The Splice Junction Gene Sequences (SJGS) consists of 3190 short sequences of DNA. The goal is to predict the presence of an intron/exon boundary (IE), an exon/intron boundary (EI) or no boundary. We merge the IE and EI classes into a single class. The sequences are converted into 6 predictors consisting of nucleotides plus the two other descriptors used in the data set, where the predictors are the number of times the nucleotide occurred in the sequence. We add the 30 interaction terms for these sequences to create a data set with 36 predictors.
6.2
PRIMARY EVALUATION DESIGN
We perform evaluation over 100 train/test splits on each of the four data sets comparing the A−optimality criterion against uncertainty and ELLR methods. We decided on 100 repetitions since many of the data sets have a generalization accuracy in the high 50’s, and such a low generalization accuracy can be associated with higher variance of the learning curve. Train/test splits were created by splitting the entire data sets (described in Table 1) in half at random. On each of the 100 runs, 10 random examples were given as “seed examples” to each learner which proceeded to use their example scoring function to select the next 90 examples. The 10 seed examples contained at least 2 examples from each category label, ensuring a reasonable starting point for active learning. Though the pool sizes vary across data sets, 100 training examples is equal to less than half the pool in each case. At each iteration of observation selection, 10 candidates were chosen at random from the pool and scored according to the active learning scoring function. Ties in the scores of candidate observations were broken at random. We report accuracy as a measure of performance since in these data sets the marginal counts of the different classes are roughly equal (illustrated in Table 1).
6.3
PRIMARY EVALUATION RESULTS Forest Cover Type (FCT) -- Pool Size: 10,000 0.58
0.57
0.56
Accuracy
Evaluations took under 24 hours for the longest experiment of the four data sets, FCT, to run. We used Monte Carlo sampling of 1000 observations from the pool in computing the A matrix and ELLR objective function in order to speed up the evaluation. This was only necessary for the FCT data set since the pool sizes for the other data sets were already relatively small.
0.55
0.54
0.53
entire pool random uncertainty A-optimality ELLR
0.52
0.51 10
20
30
40
50
60
70
80
90
100
90
100
90
100
90
100
Number of Observations Wisconsin Diagnostic Breast Cancer (WDBC) -- Pool Size: 284 0.93
0.92
0.91
0.9 Accuracy
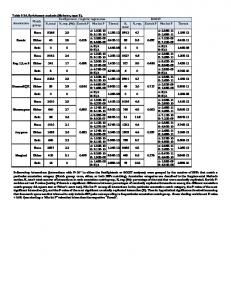
Figure 1 shows the learning curves of the three active learning methods on all four data sets. Random sampling from the pool supplies a baseline. On all four data sets, A−optimality outperforms random noticeably, demonstrating that the method gives attractive performance. In contrast, uncertainty sampling diverges radically below random on the SJGS and FCT data sets. A−optimality and ELLR both appear to match or beat random performance in these evaluations. By the end of the learning curves the standard deviations of the accuracy were below 0.035 on all data sets for all methods, so at 100 trials the 95% confidence intervals had size less than 0.007 at the right hand side of the curve. The confidence intervals are larger for smaller training set sizes.
0.89
0.88
0.87
entire pool random uncertainty A-optimality ELLR
0.86
0.85 10
In creating the training, pool, and test sets from Table 2, we used expected counts of each of the rows and outcomes of the table in what would otherwise be a random sample of 400 (train), 40 (pool), and 40 (test) respectively. The pool is sampled with replacement during evaluation to imitate having an infinite pool of data. Also, during evaluation we randomly break any ties in the estimated benefit of labeling examples to prevent deterministic outcomes due to ordering of observations in the pool. Using 40 examples in the test set with the expected values of each row/outcome computed from the table mimics the expected proportions of a very large sample from the table.
30
40
50
60
70
80
Splice Junction Gene Sequence (SJGS) -- Pool Size: 1595 0.59
0.58
0.57
Accuracy
In addition to the primary evaluation, we explore the possibility that each of the active learning methods will cause a well-trained model to diverge towards a weaker performing model. We built an artificial data set shown in Table 2 consisting of two binary predictive features plus a bias term (a predictor that always takes the value 1). Feature 2 determines whether we enter a region of feature space with good predictive ability. When feature 2 is off, feature 1 determines the outcome with high probability. When feature 2 is on feature 1 has no predictive ability over the outcome. This is an example of a data set that does not match the distribution of a maximum likelihood logistic regression model.
20
Number of Patients Diagnosed
LIMIT PERFORMANCE EVALUATION
0.56
0.55
0.54
entire pool random uncertainty A-optimality ELLR
0.53
0.52 10
20
30
40
50
60
70
80
Number of Labeled Genes Thyroid Domain (TD) -- Pool Size: 355 0.74 0.72 0.7 0.68 0.66 Accuracy
6.4
0.64 0.62 0.6
entire pool random uncertainty A-optimality ELLR
0.58 0.56 0.54 0.52 10
20
30
40
50
60
70
80
Number of Patients Diagnosed
Figure 1: Empirical evaluation of A−optimality, uncertainty sampling, ELLR, and random sampling on four data sets.
Limit Performance Evaluation -- Pool Size: Unlimited 8.65
8.6
training set random uncertainty A-optimality ELLR
8.55 SSE
Table 2: An artificial data set to test whether an active learning scheme can actually cause a well-trained model to diverge dramatically. Each row of the table is given equal weight in creating seed, pool and test sets that truly represent the underlying distribution of the data. The top two rows encode signal, the bottom two rows encode no signal.
8.5
P(y 0.1 0.9 0.5 0.5
6.5
OUTCOMES = 1|x) P(y = 0|x) 0.9 0.1 0.5 0.5
PREDICTORS x1 x2 bias 0 0 1 1 0 1 0 1 1 1 1 1
LIMIT PERFORMANCE RESULTS
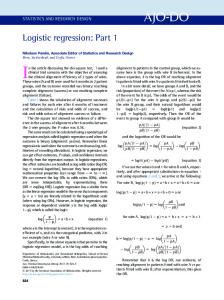
Figure 2 shows the results of performing the limit performance evaluation averaged over 25 runs. Initializing the model with 400 observations, we add 600 additional observations according to the active learning criteria, with random sampling included as a baseline. Here we measure the sum of squared errors of prediction from the true class label. Examining Figure 2, we see that A−optimality performs on par with random sampling. Uncertainty sampling has a tendency to pick the “noisy” examples which, in turn, drag the parameters associated with feature 1 and the bias feature from their optimal values. The squared error using the uncertainty sampling rises monotonically achieving a 3.0% increase at 1000 observations. ELLR also exhibits a noticeable increase in squared error, though not as large. Examining the choice of examples picked by ELLR we saw that observations from row 1 of Table 2 was grossly overrepresented while row 3 was grossly underrepresented. It is attempting to attribute the results of Table 2 to the use of squared error as the evaluation metric, however the same qualitative effect is observed if log-likelihood is employed instead.
7
DISCUSSION
Based on the empirical evaluation we see that A−optimality is a very attractive objective function for active learning. The method always performs about as well as random sampling from the pool at a minimum. In most cases, A−optimality leads to substantial performance improvements. For instance, on the forest cover data set, the improvement of the method indicates that one example picked with A−optimality is worth almost two random examples. In contrast, uncertainty sampling has two data sets in the evaluation (FCT, SJGS) where the performance drops below random in a dramatic fashion. Compar-
8.45
8.4 400
500
600
700 Number of Observations
800
900
1000
Figure 2: Sum of squared error (SSE) empirical evaluation of A-optimality, uncertainty sampling, ELLR, and random sampling on a data set consisting of an infinite pool sampled from Table 2.
isons to ELLR on the natural data evaluations do not lead to conclusions about the performance of the two methods in relation to each other. One might wonder why ELLR performs worse than random sampling on the synthetic data when Equation 18 appears to more correctly reflect the true objective function of interest: matching the predictions of the true model. Equation 18 is minimized when the ˆ KL divergence KL(P(y|x)||P(y|x)) is minimized. However, the approximation made in Equation 19 is minimized when the predictions over the pool are closest to 0 and 1. Equation 19 may potentially bi-pass the true model P(y|x) in its effort to make its probabilistic predictions close to 0 and 1, and this is either a good or bad idea depending on the quality of the initial model with respect to the complexity of the learning task. In contrast, the A−optimality criterion of Equation 15 is much more conservative; it attempts to make the model predictions as close to the “true” model as possible, according to the squared loss function. The greatest impediment to applying A−optimality to arbitrary data sets is the computational cost of picking the next example. Parallelism, numerical optimization and numerical approximation can all play a role in reducing the computational cost of employing A-optimality. Future work will look at methods for making evaluations on larger data sets more practical. In the evaluations of this paper, the single largest computational cost was model fitting. It was model fitting computational time that prevented us from employing bagging in the ELLR method. We expect this cost might be significantly diminished by seeding parameters with a previous solution rather than starting
model fitting from scratch. If model fitting could be reduced to constant time, we would expect computation of the A−optimality criterion to be the bottleneck of the evaluation.
8
SUMMARY
We have presented a novel method for active learning of logistic regression classifiers based on the A-optimality objective function from the optimal experimental design literature. Empirical evaluations on four data sets demonstrate that A-optimality gives attractive performance gains, and does not perform worse than random sampling. We believe that active learning methods must offer solid performance gains in addition to robust performance in the worst case in order to be accepted in industrial applications. The performance of A−optimality suggests that expected variance reduction objective functions for regression models contain both of these properties.
Acknowledgments Andrew Schein was supported by NSF ITR-EIA0205448. The authors thank Isabella Verdinelli for a helpful discussion on optimal experimental design results.
References Blake, C.L., & Merz, C.J. 1998. UCI Repository of machine learning databases. Cessie, S. Le, & Houwelingen, J. C. Van. 1992. Ridge Estimators in Logistic Regression. Applied Statistics, 41(1), 191–201. Chaloner, Kathryn, & Larntz, Kinley. 1989. Optimal Bayesian Design Applied to Logistic Regression Experiments. Journal of Statistical Planning and Inference, 21, 191–208. Chaloner, Kathryn, & Verdinelli, Isabella. 1995. Bayesian Experimental Design: A Review. Statistical Science, Vol. 10, No. 3, 273–304. Cohn, David A. 1994. Neural Network Exploration Using Optimal Experiment Design. Pages 679–686 of: Cowan, Jack D., Tesauro, Gerald, & Alspector, Joshua (eds), Advances in Neural Information Processing Systems, vol. 6. Morgan Kaufmann Publishers, Inc. Cohn, David A., Ghahramani, Zoubin, & Jordan, Michael I. 1996. Active Learning with Statistical Models. Journal of Artificial Intelligence, 4, 129–145. Davis, Robert, & Prieditis, Armand. 1999. Designing Optimal Sequential Experiments for a Bayesian Classifier. IEEE Transactions on Pattern Analysis and Machine Intelligence, 21(3).
Fedorov, Valeri V. 1972. Theory of Optimal Experiments. Academic Press, New York. Hasenj¨ ager, Martina. 2000. Active Data Selection in Supervised and Unsupervised Learning. Ph.D. thesis, Universist¨ at Bielefeld. Lewis, David D., & Gale, William A. 1994. A sequential algorithm for training text classifiers. Pages 3–12 of: Croft, W. Bruce, & van Rijsbergen, Cornelis J. (eds), Proceedings of SIGIR-94, 17th ACM International Conference on Research and Development in Information Retrieval. Dublin, IE: Springer Verlag, Heidelberg, DE. MacKay, David J. C. 1991. Bayesian Methods for Adaptive Models. Ph.D. thesis, California Institute of Technology. McCallum, Andrew K., & Nigam, Kamal. 1998. Employing EM in pool-based active learning for text classification. Pages 350–358 of: Shavlik, Jude W. (ed), Proceedings of ICML-98, 15th International Conference on Machine Learning. Madison, US: Morgan Kaufmann Publishers, San Francisco, US. Roy, Nicholas, & McCallum, Andrew. 2001. Toward Optimal Active Learning through Sampling Estimation of Error Reduction. Pages 441–448 of: Proc. 18th International Conf. on Machine Learning. Morgan Kaufmann, San Francisco, CA. Schohn, Greg, & Cohn, David. 2000. Less is More: Active Learning with Support Vector Machines. Pages 839– 846 of: Proc. 17th International Conf. on Machine Learning. Morgan Kaufmann, San Francisco, CA. Seung, H. S., Opper, Manfred, & Sompolinsky, Haim. 1992. Query by Committee. Pages 287–294 of: M.K., Warmuth, & Valiant L.G., Eds. (eds), Proceeedings of the Fifth Annual Workshop on Computational Learning Theory. Tong, S., & Koller, D. 2001. Active Learning for Structure in Bayesian Networks. In: Proceedings of the International Joint Conference on Artificial Intelligence. Tong, Simon, & Koller, Daphne. 2000. Support Vector Machine Active Learning with Applications to Text Classification. Pages 999–1006 of: Langley, Pat (ed), Proceedings of ICML-00, 17th International Conference on Machine Learning. Stanford, US: Morgan Kaufmann Publishers, San Francisco, US. Zhang, C., & Chen, T. 2002. An Active Learning Framework for Content-Based Information Retrieval. IEEE Trans. on Multimedia, Special Issue on Multimedia Database, 4(3), 260–268.