Alexander L. Wolman ... and 1999), and parts can serve as background for Khan, King, and Wolman ... King, and Wolman (2000) contains such an application.
A Primer on Optimal Monetary Policy with Staggered Price-Setting Alexander L. Wolman
I
f the monetary authority can make a binding promise concerning future monetary policy, what policy should it follow? If the monetary authority cannot make such a promise, how should it behave on a period-by-period basis? How one answers these questions reflects one’s beliefs about how the economy works, what monetary policy is feasible, and how outcomes should be evaluated. Economists work with explicit models of the economy and impose explicit welfare criteria in order to answer questions about optimal policy. This approach facilitates reasoned debate. If one disagrees with a policy being advocated, that disagreement necessarily reflects disagreement with the economic model, the welfare criterion, or assumptions about institutional features of policy. Conditional on one model of how the economy works that is currently popular and is based on optimizing behavior by households and firms, I will discuss three different notions of optimal monetary policy.1 Because economists have not reached a consensus about the appropriate model of the macroeconomy to be used for monetary policy analysis, this article cannot provide definitive answers to questions about optimal policy. The distinctive feature of the model is that firms do not continuously adjust the prices of goods they sell. Instead, the price of any individual good changes only periodically. Such price stickiness is observed for many goods (see the The author thanks Mike Dotsey, Andreas Hornstein, Tom Humphrey, Bennett McCallum, and Pierre Sarte for helpful comments and discussions. This article does not necessarily represent the views of the Federal Reserve Bank of Richmond or any branch of the Federal Reserve System. 1 Parts of this article summarize research described in more detail in King and Wolman (1996 and 1999), and parts can serve as background for Khan, King, and Wolman (2000 and 2001). Goodfriend and King (1999 and 2000) contains much complementary discussion of monetary policy in the type of model used in this article.
Federal Reserve Bank of Richmond Economic Quarterly Volume 87/4 Fall 2001
27
28
Federal Reserve Bank of Richmond Economic Quarterly
survey in Wolman [2000]) and forms an important channel through which monetary policy can affect aggregate economic outcomes. As in the work of Kydland and Prescott (1977) and Barro and Gordon (1983), policy surprises have the potential to improve welfare under certain conditions; there is a time-consistency problem for monetary policy. In contrast to that work, however, here the current-period policy problem is affected by the nature of future policy because the model involves multiperiod pricing. Unlike much work on optimal monetary policy, the model in this article does not generate welfare losses associated with the area under the money demand curve; that is, there are no shoe leather costs of inflation.2 This modeling choice allows us to focus on issues related to staggered price-setting. The same approaches described here can easily be applied to models in which there are both staggered price-setting and shoe leather costs of inflation. Khan, King, and Wolman (2000) contains such an application. The model delivers two important results regarding optimal policy. First, it is beneficial for the monetary authority to be able to make binding promises about its future behavior. As in Kydland and Prescott (1977) and Barro and Gordon (1983), if binding promises are not feasible, we should expect a relatively high inflation rate. Under current arrangements, it is not possible for the Federal Reserve to make binding promises. If it were possible, the model prescribes that in the long run, inflation should either be zero or just slightly positive, depending on whether the policy objective is present value welfare or steady state welfare.
1. THE MODEL ECONOMY As is standard in modern economic models, the fundamental assumptions of this model concern who the agents are, their preferences and endowments, the technology to which they have access, and the market structure. Here there are three types of agents: households, firms, and the government. I will give an overview of the model before describing it in mathematical terms. There is a large number of identical households. Households are assumed to live forever and to obtain utility from leisure time and from consuming goods produced by firms. Consumption and leisure in the present are preferred to the same amount of consumption and leisure in the future. Households’ endowments consist of one unit of time in each period and ownership of the firms. Time is allocated between labor supply to firms—in exchange for wage income—and leisure. Households also demand government-supplied money in an amount identical to their nominal consumption spending. 2 Shoe leather costs of inflation are the resource costs individuals and firms incur in order to
economize on holdings of currency, which does not bear interest. See Bailey (1956) and Friedman (1969).
A. L. Wolman: Optimal Monetary Policy
29
Firms produce consumption goods using a technology that relies only on labor. Their objective is to maximize the present value of profits distributed to households, and to achieve this objective they set prices and hire labor. It is also assumed that firms may only adjust their prices every two periods (I assume that a period is three months). This shortcut imposes price stickiness of a magnitude arguably lower than that observed in the United States. As for market structure, in this model there is a large number of firms producing under conditions of monopolistic competition. Each firm produces a distinct good and faces a constant elasticity demand curve, with the elasticity common across firms. The government’s sole role is to supply money. Money enters the economy in the form of lump-sum transfers from the government to consumers.
Households Households’ preferences for consumption (ct ) and leisure (lt ) in the present and future are given by a concave utility function u (c, l) and a discount factor β < 1: ∞ �
β t u (ct , lt ) ,
(1)
t=0
where the subscript t indexes time. For the examples below, I will specify the utility function to be u (c, l) = ln c + χ · l,
(2)
where χ > 0 is a fixed parameter. The household’s total consumption is an index of consumption of a unit measure of different goods. In keeping with the market structure and pricing behavior described below, we need to keep track of only two types of goods, each with measure 1/2: those with prices set in the current period, indexed by 0, and those with prices set in the previous period, indexed by 1: ε
ε−1 � � 1 ε−1 1 ε−1 ε ε ct = c c0,t , c1,t ≡ · c + · c1,t . (3) 2 0,t 2 This consumption index implies that households have constant elasticity demands for each individual good:
Pj,t −ε cj,t = ct , j = 0, 1, (4) Pt where Pj,t is the nominal price of a good with price set in period t − j, and Pt is the price index, given by
1 1−ε 1 1−ε 1/(1−ε) Pt = + P1,t . (5) P 2 0,t 2
30
Federal Reserve Bank of Richmond Economic Quarterly
For derivations of (4) and (5), see the appendix to Wolman (1999). The household’s budget constraint requires that consumption spending not exceed the sum of wage income and firms’ profits (Dt ): Pt ct ≤ Pt wt nt + Dt ,
(6)
where wt is the real wage. The household’s time constraint requires that its labor supply and leisure time not exceed its endowment of one unit of time: lt + nt ≤ 1,
(7)
where total labor supply (nt ) is the sum of labor supplied to the two types of firms, � 1 � (8) nt = · n0,t + n1,t . 2 The sum is multiplied by 1/2 because nj,t is labor hired per j -type firm, and half the firms are of each type. Households also demand government-supplied money in an amount identical to their nominal consumption spending: M t = P t ct ,
(9)
where Mt is nominal money balances. The key equation from the household’s side of the model is optimal labor supply, which can be determined by maximizing u (ct , lt ) subject to the budget constraint and time constraint: wt · uc (ct , lt ) = ul (ct , lt ) ,
(10)
and, for the preferences in (2), wt = χ. (11) ct If the household were to marginally increase the quantity of labor it supplies, the utility-denominated value of additional labor income would be exactly offset by the utility loss associated with the decrease in leisure time.
Firms There is a continuum of monopolistically competitive firms, each producing a unique differentiated product. As mentioned above, firms set their price for two periods—which implies P1,t = P0,t−1 —and half of the firms adjust their price in any given period. This pattern is known as staggered price-setting. Each firm has the same production technology: cj,t = nj,t , j = 0, 1.
(12)
When firms adjust, they choose a price that will maximize their present discounted profits over the two periods for which the price is fixed. As owners of the firms, consumers instruct firms to value current and future profits using
A. L. Wolman: Optimal Monetary Policy
31
the marginal utility of income, which is uc (ct , lt ) for the current period and uc (ct+1 , lt+1 ) for the next period. The optimal price satisfies �
� uc (ct , lt ) ct wt + βuc (ct+1 , lt+1 ) ct+1 wt+1 π εt+1 ε P0,t · = , (13) Pt ε−1 uc (ct , lt ) ct + βuc (ct+1 , lt+1 ) ct+1 π ε−1 t+1 where the inflation rate in period t + 1 is given by π t+1 ≡ Pt+1 /Pt . This expression makes the marginal present discounted value of profits zero for an adjusting firm.3 Firms would like to charge a price that is a constant markup of ε/ (ε − 1) over marginal cost, and in this model marginal cost is equal to the real wage. Because the price level may change over time and prices are set for two periods, it is generally impossible for a firm to achieve this ideal markup in every period. Firms do the best they can, which typically means setting a markup higher than ε/ (ε − 1) in periods when they adjust. If they were to choose the ideal markup, they would maximize profits in the first period of each price cycle, but in the next period profits would be low because inflation would erode the firm’s real price. The profit function is concave, so it is optimal to sacrifice some profits in both periods rather than maximizing profits in one period. Another way to view the optimal price is that it achieves the ideal markup with respect to a quasi-weighted average of marginal cost in the two periods of the price cycle.
Equilibrium In equilibrium, the wage rate and the prices of individual consumption goods are such that households maximize present discounted utility with their labor supply and consumption demand decisions, and firms maximize present discounted profits with their price-setting decisions. In addition, equilibrium requires a specification of monetary policy. We can use many of the equations stated above to eliminate variables so that a complete description of equilibrium reduces to as few as two difference equations in the two variables c0,t and c1,t . One of those equations is firms’ optimal pricing equation (13), and the others are determined by monetary policy. The appendix shows how the optimal pricing equation can be expressed in terms of a relationship between c0,t , c1,t , c0,t+1 , and c1,t+1 . That relationship can be summarized by a function x () which is defined in the appendix: � � � � (14) 0 = x c0,t , c1,t + βx c1,t+1 , c0,t+1 . 3 A detailed derivation is provided in Wolman (1999). See also Yun (1996). Note that in
Wolman (1999), the factor � discounts nominal profits, so that the different exponents on inflation in that article are offset by a different discount factor (i.e., the expressions are equivalent).
32
Federal Reserve Bank of Richmond Economic Quarterly
� � � � The sum x c0,t , c1,t + βx c1,t+1 , c0,t+1 is the present discounted marginal profit of a firm choosing its price in period t, and optimal pricing behavior requires present discounted marginal profit to be zero. In (13) I solved this equation for the optimal price P0,t /Pt , but it will be easier to work with in the form shown in (14). The function x (a, b) is the equilibrium value of current marginal profit (with respect to price) for a firm that sells quantity a, when prices and demands are such that half sell quantity a and the other � of all firms � half sell quantity b. Specifically, x c0,t , c1,t is the marginal profit in period t of a firm setting its price in period t; that firm sells quantity c0,t , as do all other firms setting their price, while firms charging a price set in the previous period sell quantity c1,t . The form of the other equation(s) needed to characterize equilibrium is determined by monetary policy.
Two Distortions to Summarize Outcomes Consumption and leisure are the fundamental variables that households in the model care about. Thus, good monetary policy makes consumption and leisure behave in ways that households like. It is important to stress that in this model the central bank does not directly control consumption and leisure. Nonetheless, the central bank’s choices regarding the money supply affect some relative prices in the model—in particular, the relative prices of goods set in the current and previous periods—and these relative prices in turn affect consumption and leisure. By focusing on households’ preferences and the technology for producing goods, we see there is an optimal allocation that serves as a useful benchmark for policy. Analyzing this outcome leads us to define two measures of distortions, summarizing deviations from the optimal allocation. The relative price distortion effectively makes the economy operate inside its production possibility frontier. The markup distortion acts as a tax on labor input, placing the economy at an inefficient point on the production possibility frontier. If the two distortions are eliminated, the optimal allocation is attained. The monetary policy problem can then be thought of as minimizing these distortions. The optimal allocation is referred to as the first-best. To find the first-best, maximize utility subject to the constraints imposed by factor endowments and the production technology: max
c,l,c0 ,c1 ,n0 ,n1
u (c, l) ,
subject to (3), (7), (8), and (12). Note that this problem is entirely static; the only dynamic element of the model involves price-setting, and the firstbest overcomes price stickiness. The six first-order conditions to this problem make it clear that c0 = c1 = c and n0 = n1 = n. The solution for consumption and leisure is a constant pair, which I will denote cf b , l f b , implicitly given by
A. L. Wolman: Optimal Monetary Policy
33
the following equations: � � � � uc c f b , 1 − c f b = u l c f b , 1 − c f b , l
fb
(15)
= 1−c . fb
In the first-best, the technology for producing aggregate output is identical to the technologies for producing individual outputs (12). The marginal product of aggregate labor in the production of aggregate output is thus 1.0. In addition, the marginal rate of substitution between consumption and labor (ul /uc ) equals the marginal product of labor. This condition is reflected in (15). Referring back to the full staggered price-setting model, there are two ways in which outcomes can deviate from the first-best. First, the implicit technology for producing aggregate output may not be identical to the technologies for producing individual outputs. That is, ct < nt because c0 �= c1 . In addition, the marginal rate of �substitution may � not �be equated to�the marginal product of labor. That is, uc cf b , 1 − cf b �= ul cf b , 1 − cf b , or equivalently wt �= 1. Deviations from the equality of consumption and labor input will be denoted by ρ t and referred to as the relative price distortion: ρt ≡
nt 1 − lt = . ct ct
(16)
Deviation of the real wage from unity will be denoted by µt and referred to as the markup of price over marginal cost: µt ≡
1 uc (ct , lt ) = . wt ul (ct , lt )
(17)
Because the real wage is equal to real marginal cost in this model, (17) shows that the markup is simply the inverse of real marginal cost. These two equations allow us to move between working in terms of consumption and leisure and working in terms of the relative price distortion and the markup. In other words, given consumption and leisure, (16) and (17) allow us to compute the two distortions, and given the two distortions, the same two equations allow us to compute consumption and leisure implicitly. To see why the relative price distortion is so named, replace the denominator of (16)� with the aggregator, replace the numerator with � � consumption � 1 1 + n + c n = c , and divide numerator and denominator by 0,t 1,t 0,t 1,t 2 2 c1,t :
c0,t −1 ε−1 + 1 c1,t 1 ρt = ε .
ε−1 ε−1 2 ε c0,t +1 c1,t
34
Federal Reserve Bank of Richmond Economic Quarterly
Finally, replace the consumption ratios with price ratios, using (4): −ε � � � ε−1 −1 �
ε−1 1 P0,t 1−ε P0,t −ε +1 +1 . ρt = 2 P1,t P1,t
(18)
From (18), if prices of both types of good are the same (P0,t = P1,t ), the relative price distortion is eliminated, meaning ct = nt . Furthermore, knowing c P the ratio c0,t (or P0,t ) is sufficient for determining the relative price distortion. 1,t 1,t In a flexible price model with perfect competition, the markup and the relative price distortion would both equal unity (ρ t = µt = 1). With flexible prices but the monopolistic competition structure of the model, the relative price distortion would still be unity, but the markup would exceed unity (µt = ε > 1): with monopoly power, firms set prices above marginal cost. With ε−1 staggered price-setting as well as monopolistic competition, the relative price distortion and the markup generally exceed unity. But with staggered pricesetting, monetary policy can affect these distortions. Policy’s leverage over the relative price distortion is straightforward: the more variability in the price level, the greater the relative price distortion. There are two components to policy’s leverage over the markup. First, the markup is affected by the level of inflation even if the inflation rate is constant; this relationship will be detailed in Section 3. Second, with some prices predetermined, policy surprises will affect the level of real activity and the markup. This second mechanism is conventional, yet quite complicated. Suppose that instead of the pricing structure in our model, all prices were reset every period, but in every period they were chosen before any other information was revealed. Then it would be obvious that surprise increases in money raise output, simply from the money demand equation (9). The price level would be treated as fixed, so increases in money would correspond to increases in consumption. In our model, however, only some prices are predetermined. So, again referring to the money demand equation, whether a surprise monetary expansion results in an expansion in output depends on how the firms that set their price in the current period respond to the expansion. And, because those firms set their price for two periods, their response depends on their expectations about the behavior of price setters and monetary policy in the next period. Extending this line of reasoning, one can see that the entire path of future policy matters.
2.
DIFFERENT APPROACHES TO OPTIMAL POLICY
Even for a particular explicit model of the private macroeconomy, there is not just one reasonable notion of optimal monetary policy. The reasons for this ambiguity were suggested at the outset; they involve disagreements about the appropriate welfare criterion and about the nature of policy institutions. A welfare criterion is used to rank different policies, and the rankings will
A. L. Wolman: Optimal Monetary Policy
35
generally differ according to the welfare criterion. Institutions matter because they affect the range of feasible policies. I will discuss three common notions of optimal monetary policy as they apply to the staggered pricing model. The first and second differ according to whether the welfare criterion is steady state welfare or present value welfare, whereas the second and third differ according to an institutional assumption that changes the set of feasible policies. In each case, I ignore shocks to the economy, so the only changes that occur over time are due to monetary policy. Perhaps the simplest notion of optimal policy is the idea of an optimal steady state inflation rate: view the monetary authority as choosing the inflation rate, and ask what constant inflation rate is best. With a constant inflation rate, outcomes in each period are identical. Because there is no uncertainty in the model, and there are no fundamental state variables that affect the set of feasible outcomes, it seems sensible to require that the central bank pick a constant inflation rate. However, it would also be interesting to check whether in fact the policymaker would choose a constant inflation rate. Thus, a second natural approach to optimal policy involves assuming that the policymaker has the same welfare criterion as households. One can then ask how inflation would behave over time: would it be constant, and would it end up at the optimal steady state inflation rate? Both of these approaches to optimal policy maintain that the policymaker (central bank) can credibly promise (commit to) how it will behave in current and future periods. This is not a trivial assumption. For instance, the Fed does not make explicit, detailed promises as to how it will behave in the future. Factors such as reputation may make for implicit commitments in the Fed’s behavior, but these factors are probably not strong enough to make either of the first two approaches to optimal policy practically relevant in the current institutional environment. I therefore consider a third notion of optimal policy, which maintains the assumption that the policymaker’s welfare criterion is identical to the representative agent’s, and further assumes that policy cannot commit in any way to future actions. Each period, the central bank acts in the best interests of society. The central bank cannot dictate what its behavior will be in the next period, but it foresees what form that behavior will take. These three approaches to optimal policy do not have the same implications. In the first two cases, the results differ in an interesting qualitative dimension, although quantitatively they are quite close. When the welfare criterion is steady state welfare, the central bank will choose a small but positive level of inflation, as this reduces the markup distortion. In contrast, when the central bank is allowed to behave in a time-varying manner and still can commit to future policies, optimal policy leads in the long run to zero inflation. This pair of results has an analogue in the golden rule versus modified golden rule idea in growth theory, which is explained in Section 4.
36
Federal Reserve Bank of Richmond Economic Quarterly
If, as in the third case, the central bank cannot commit, the nature of optimal policy changes more dramatically. The steady state equilibrium in this case involves rather high inflation. Loosely speaking, because the central bank in the current period cannot affect the behavior of the next period’s central bank, it takes what it can get in the current period. The central bank chooses to exploit firms that set their price in the past, as a way of trying to drive down the markup.
3.
OPTIMAL POLICY I: STEADY STATE WELFARE
Our first notion of optimal policy has as its criterion the steady state level of welfare. Examining steady state welfare as a function of inflation answers the question, What average level of inflation should a central bank target? This is a sensible policy question, though not the most obvious one to ask in the context of models like the one used here. I will return to this point in Section 4. To determine the optimal steady state inflation rate, I will first derive steady state allocations for an arbitrary inflation rate. In a steady state equilibrium, all real variables are constant. Nominal prices grow at a constant rate, the steady state inflation rate. If π is the steady state inflation rate, we find the steady state values of all variables by eliminating time subscripts on the real variables in the equilibrium conditions and setting π t = π . From the consumption aggregator, the demand function, and the optimal pricing equation ((3), (4), and (13)), we can derive an expression for the real wage in steady state:
ε−1 1 1 ε−1 1/(ε−1) 1 + βπ ε−1 ss w = · · + π . (19) ε 2 2 1 + βπ ε In addition, from (4) for j = 0 and 1, c0ss /c1ss = π −ε .
(20)
The level of consumption is implicitly determined by substituting the previous two expressions into the consumer’s labor supply equation (28): � �
ul c1ss · π −ε , c1ss ε−1 1 1 ε−1 1/(ε−1) 1 + βπ ε−1 � �= · + π . (21) ε 2 2 1 + βπ ε uc c1ss · π −ε , c1ss For a given specification of preferences (u(c, l), which determines the functions uc and ul ), (20) and (21) allow us to compute c0ss , c1ss and thus css , l ss and the two distortions as functions of the steady state inflation rate. Imposing u (c, l) = ln (c) + χ l, the steady state levels of consumption and leisure are
ε−1 1 1 ε−1 1/(ε−1) 1 + βπ ε−1 ss c (π ) = · + π εχ 2 2 1 + βπ ε
A. L. Wolman: Optimal Monetary Policy
37
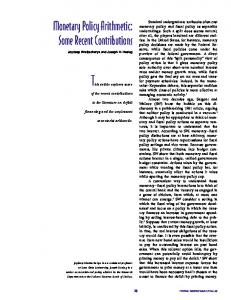
Figure 1 Steady State Relative Price Distortion as a Function of Inflation
The variable π is the gross quarterly inflation rate.
and 1 l (π ) = 1 − · css (π ) · 2 ss
1 1 ε−1 + π 2 2
−ε
ε−1
· (1 + π ε ) .
The steady state relative price distortion and markup for this example are, respectively, � � −ε −1 ε−1 π +1 1 ss (22) ρ = � ε � 2 π 1−ε + 1 ε−1 and
µ = ss
ε ε−1
1 + βπ ε 1 1 ε−1 1/(1−ε) · · + π . 2 2 1 + βπ ε−1
(23)
Figures 1 and 2 plot the steady state markup and relative price distortions as functions of the steady state inflation rate. The relative price distortion is minimized—and in fact eliminated—at zero inflation, whereas the markup is minimized but not eliminated at a very low positive inflation rate. Zero inflation eliminates the relative price distortion because it results in all nominal prices being constant and equal. It is less obvious why a low positive inflation rate should minimize the markup. To understand the relationship between steady state inflation and the markup, it is helpful to begin by using the price level definition (5) to write
38
Federal Reserve Bank of Richmond Economic Quarterly
Figure 2 Steady State Markup Distortion as a Function of Inflation, Normalized to µ(1.0) = 1.0
The variable π is the gross quarterly inflation rate.
the markup as 1 �
1−ε
1−ε � 1−ε P P 1 1 0 1 + , µss = 2 MC 2 MC
(24)
where MC is nominal marginal cost. The effect of inflation on the markup depends on the effect of inflation on the markups charged by the two types of firms. In steady state, the markup of type one firms is simply the markup charged by type zero firms divided by the inflation rate: P1 P0 1 = · , MC MC π because P1 = P0 /π . Using (23) and (24) it is easy to show that the markup of type zero firms is increasing in the inflation rate (except at high rates of deflation). This is also intuitive: to protect themselves from the real price erosion caused by inflation in the next period, firms set a higher markup when they do adjust. Thus, whether the aggregate markup increases in inflation depends on whether the effect of inflation on P0 /MC is strong enough to overwhelm the erosion effect of inflation on P1 /MC. It turns out that for very low inflation, the erosion effect dominates, so the aggregate markup falls with inflation. But for even moderately high inflation, the effect of inflation on adjusting firms’ prices is strong enough that the aggregate markup rises.
A. L. Wolman: Optimal Monetary Policy
39
Figure 3 Steady State Welfare as a Function of Inflation
The variable π is the gross quarterly inflation rate.
Returning now to optimal policy, the optimal steady state problem is � � max u css (π ) , l ss (π ) . π
Using the expressions for steady state consumption and leisure, we could analytically characterize the optimal steady state inflation rate. It is more revealing, though, to look at a picture. Just as Figures 1 and 2 plot the markup and relative price distortions as functions of the steady state inflation rate, Figure 3 plots steady state welfare as a function of inflation. The vertical dashed line indicates the inflation rate that minimizes the markup (for ε = 4), and the vertical solid line indicates the inflation rate that minimizes the relative price distortion (zero inflation). As we should expect, the welfare maximizing inflation rate is between the two that each minimize a distortion. It is notable that the optimal steady state inflation rate is positive in this model, but it is only slightly positive—at approximately 0.4 percent per year—for ε = 4.
4.
OPTIMAL POLICY II: PRESENT VALUE WELFARE WHEN THE POLICYMAKER CAN KEEP ITS PROMISES
Steady state welfare is an intuitively appealing welfare criterion, but it is not the only natural choice for our model. Present discounted welfare, defined by (1), is another natural welfare criterion. I will henceforth refer to this simply as optimal policy. If there is an initial period to the policy problem, then optimal policy may not involve choosing a steady state—if it did, we would
40
Federal Reserve Bank of Richmond Economic Quarterly
get the same answer as that in the previous section. In fact, under present value welfare maximization, inflation does vary over time, and it converges to a rate in which steady state welfare is lower than was found in Section 3 in the best steady state (King and Wolman [1999] first presented this result). Period welfare during the transition to steady state is higher than it is in the best steady state. Note that the optimal policy problem is viewed as being solved once and for all in an initial period, and initial periods are more important than later periods precisely because the future is discounted. To find the inflation behavior that maximizes welfare, I use what is known in optimal taxation problems as the primal approach. Under the primal approach, instead of searching for the policy behavior that maximizes welfare, one first searches for the optimal allocations that are feasible for the policymaker and then (as a secondary step not provided here) determines a rule that would achieve those allocations. Recall the discussion of equilibrium above. There I showed that an equilibrium was described by at least two difference equations: one representing optimal price-setting and the other(s) depending on policy. Here the additional difference equation(s) must be generated by optimality conditions for policy. To find those optimality conditions, write down the policy problem as maximizing present discounted utility, ∞ �
� � � � �� β t u c c0,t , c1,t , l c0,t , c1,t ,
t=0
subject to the optimal price-setting condition being satisfied in each period, � � � � 0 = x c0,t , c1,t + βx c1,t+1 , c0,t+1 , t = 0, 1, . . . by choice of sequences for c0,t and c1,t . The Lagrangian for this problem is L =
∞ �
� � � � �� β t u c c0,t , c1,t , l c0,t , c1,t
t=0
+
∞ �
� � � � �� β t φ t x c0,t , c1,t + βx c1,t+1 , c0,t+1 .
t=0
The first order conditions are as follows: for c0,t when t = 0:
c0,t uc () ct
− 1ε
� � 1 − ul () + φ t x1 c0,t , c1,t = 0; 2
for c0,t when t = 1, 2,. . . :
c0,t uc () ct
− 1ε
� � � � 1 − ul () + φ t x1 c0,t , c1,t + φ t−1 x2 c1,t , c0,t = 0; 2
A. L. Wolman: Optimal Monetary Policy
41
for c1,t when t = 0:
c1,t
c1,t : uc () ct
− 1ε
� � 1 − ul () + φ t x2 c0,t , c1,t = 0; 2
and for c1,t when t = 1, 2, . . . :
1 � � � � c1,t − ε 1 uc () − ul () + φ t x2 c0,t , c1,t + φ t−1 x1 c1,t , c0,t = 0. ct 2 In these expressions, uc () (ul ()) refers to the partial derivative of the utility function with respect to consumption (leisure), and xj () refers to the partial derivative of the function x () with respect to its j th argument. The first-order conditions for c0 and c1 in period zero have a different form than the first-order conditions in all later periods. This reflects the fact that in period zero there is no previous policy commitment to be honored, so policy takes advantage of preset prices to expand output.4 After period zero, the first-order conditions for c0,t and c1,t contain a term that involves the optimal pricing condition for the previous period (t − 1). It might seem odd that the optimality conditions for some period t > 0 should take into account a response of firms in the previous period. The explanation is that policy is determined in period zero for all subsequent periods. Firms choosing their price in period t − 1 act not only in response to current variables, but also in anticipation of period t variables, and the period zero policymaker takes this effect into account when choosing period t variables. If prices were set for more than two periods, policy with regard to period t variables would affect behavior more than one period in advance, and there would be more than one initial period for which the optimality conditions differed from their eventual form. The fact that the first-order conditions for optimal policy take on a different form in period zero than in all other periods is indicative of a time-consistency problem: the optimal behavior to which the policymaker committed in period zero would not be maintained if the policymaker were allowed to reoptimize in a later period. That later period would effectively become a new “period zero,” differing from all subsequent periods. But if reoptimization were believed to be a possibility, the policy problem would not make sense as written above. Firms would not believe that a binding policy commitment had been made, and the policymaker would be unable to determine anything but the current period outcome. I return to the lack-of-commitment scenario in Section 6. For now I maintain the assumption that the policymaker can credibly commit to his or her behavior into the infinite future. 4 For a more detailed discussion of this type of optimization problem, see Kydland and Prescott (1980) and Marcet and Marimon (1999).
42
Federal Reserve Bank of Richmond Economic Quarterly
The difference equations described by the first-order conditions for c0,t and c1,t , together with the pricing constraint, describe a complicated dynamic system. However, King and Wolman (1999) show that this system has a particularly simple limit point with unique local dynamics, namely zero inflation. In simple terms, if the policymaker’s optimality criterion is present discounted utility, then he or she will choose a path that approaches zero inflation in the long run. It is somewhat surprising that optimal policy approaches a steady state with lower welfare than may be attainable in steady state. However, this result has an analogue in growth theory that can help us understand what is going on. The result from growth theory involves what are known as the golden rule and the modified golden rule. Under the golden rule, the stock of capital is that which supports the highest possible steady state consumption. However, a planner maximizing present value utility would not choose to build up or maintain this level of capital stock. Instead, the planner would choose to accumulate less capital; while this would lead to lower consumption in the long run, in the short run consumption could be higher as the excess capital was converted to consumption goods. Because present consumption is assumed to be preferred to future consumption, such a plan is optimal (see Blanchard and Fischer [1989, 45] and McCallum [1996, 49]). A similar phenomenon occurs in the staggered pricing model. In the long run, the economy will approach a steady state with a higher markup and hence lower consumption than is feasible. However, this is optimal because the transition path generates higher consumption and a lower markup than can be achieved in the optimal steady state described in the previous section.5 The long-run limiting behavior under optimal policy with commitment corresponds to what Michael Woodford (1999) has called a timeless perspective. Under the timeless perspective, the policymaker behaves each period in the way he or she would have promised to behave if asked to commit in the long-distant past. Woodford advocates that the long-run limiting behavior under the full-commitment solution be adopted in every period by policymakers who can commit, in part because that behavior leads to stationary outcomes over time: period zero is not treated as special. However, optimality of the long-run limit is inextricably linked to the high welfare levels in transitional start-up periods; specifically, the long-run limit is optimal only as part of an entire path that includes the start-up periods.6 If commitment is feasible and 5 Unpublished work by the author suggests that the transition path can be complicated, for example displaying nonmotonic behavior of the markup. It is clear, however, that there are some periods during the transition in which the markup is lower and utility is higher than in the optimal steady state. 6 Woodford conducts his analysis in a different model, where the steady state is unaffected by monetary policy. The distinction between the golden rule and modified golden rule steady states thus does not exist in Woodford (1999).
A. L. Wolman: Optimal Monetary Policy
43
the optimality criterion requires that policy be stationary, then optimal policy in the current model is represented by the optimal steady state of Section 3. Rotemberg and Woodford (1999) take this approach.7
5.
OPTIMAL POLICY III: PRESENT VALUE WELFARE WITHOUT COMMITMENT
Maintaining the natural welfare criterion of the previous section, suppose that no promises are credible. Policy cannot commit to future actions, and thus the current policymaker cannot affect expectations about future outcomes. Effectively, there is a new policymaker each period. One can again use the primal approach to study this problem. The current period policymaker will choose c0,t and c1,t subject to the constraint imposed by optimal price-setting, with the location of this constraint determined by the expected levels of c0,t+1 and c1,t+1 . Once the problem has been thus expressed, it is straightforward to interpret the policymaker’s choice variables as the two distortions (markup and relative price), rather than the two consumption levels. If policy can commit to future actions, optimal policy varies over time. In the initial period the policymaker optimally takes advantage of preset prices by expanding output. Pricing behavior anticipates all future actions, so no surprises are possible after the initial period. Nonetheless, the dynamic path does not immediately reach the long-run limit. In contrast, when the policymaker cannot commit, the current period does not differ from any other period: every period is an initial period. The policy problem is stationary, and this leads me to look for a stationary equilibrium with discretionary optimization.8 Before discussing the details of characterizing equilibrium, I will briefly relate the analysis to Barro and Gordon (1983), with which some readers may be familiar. There, equilibrium was determined by analyzing how current policy responded to expectations about current policy. In contrast, I will analyze how current variables (which are determined by current policy subject to the pricing constraint) optimally respond to the expected future variables (which determine the location of the pricing constraint). A fixed point of this relationship is a steady state equilibrium with discretionary policy. In Barro and Gordon’s model, as long as one abstracts from reputational considerations, there is no reason for future policy to play a role in equilibrium because prices are not set for multiple periods. Furthermore, all relevant expectations 7 For an interesting and detailed discussion of the timeless perspective, see Dennis (2001). 8 Without commitment, there may be many equilibria. We describe the unique Markov-Perfect
equilibrium (see Krusell and Rios-Rull [1999]), meaning the equilibrium that is determined by the economy’s natural state variables. Because there are no state variables in our model, the MarkovPerfect equilibrium is a steady state. Khan, King, and Wolman (2001) discuss a variant of this model where prices are set for three periods and there is thus one natural state variable. They find multiple equilibria.
44
Federal Reserve Bank of Richmond Economic Quarterly
are determined simultaneously with the policy action. Herein, on the other hand, future policy directly affects current behavior, and the timing is more complicated. The policymaker takes as given the prices set by firms in the previous period, but current price-setting firms make their decisions after the policymaker. These differences dictate using a forward-looking approach to solve the model. I express the model in terms of variables in the current period (for example c0 and c1 ) and variables in the next period (c0 and c1 ). A stationary equilibrium under discretionary optimal policy (i.e., no commitment) consists of scalars v ∗ , c0∗ , and c1∗ , which solve (P1) when v = v ∗ , c0 = c0∗ , and c1 = c1∗ : � � v = max u (c (c0 , c1 ) , l (c0 , c1 )) + β · v (P1) c0 ,c1
subject to
� � 0 = x (c0 , c1 ) + βx c1 , c0 c0 , c1 , v given.
(25)
In principle, it is straightforward to work with this formulation. However, it is easier to develop intuition by transforming the problem so that the choice variables are the two distortions introduced earlier, instead of c0 and c1 . To express c0 and c1 implicitly as functions of µ and ρ, use (16) and (17). The appendix derives c1 /c0 = � (ρ), c0 = � (µ, ρ), and hence c1 = � (ρ) · � (µ, ρ). Problem (P1) can then be written � � v = max � u (µ, ρ) + β · v µ,ρ
(P1 )
subject to
� � 0 =� x (µ, ρ) + β� x µ , ρ ρ , µ , v given.
(26)
It is easy to analyze this transformed problem graphically. Figure 4 illustrates the nature of (P1 ) and its equilibrium for the same example used above. The markup is on the horizontal axis, and the relative price distortion is on the vertical axis. The figure is similar to the indifference curve/budget constraint graphs common in microeconomics with three important exceptions. First, welfare is increasing toward the origin because the two distortions can be thought of as bads not goods. Second, unlike in textbook examples from microeconomics where the budget constraint is a fixed line, here there are many constraints (a continuum, with only three constants shown in the figure) because there are many possible outcomes in the next period, and outcomes next period determine the location of the constraint (µ and ρ appear in (26)). Finally, recall from microeconomics that optimal behavior implies a tangency between the budget constraint and an indifference curve. The multiple constraints here create the possibility of multiple tangencies, so
A. L. Wolman: Optimal Monetary Policy
45
Figure 4 Stationary Equilibrium without Commitment
in order to identify the equilibrium among these tangencies (assuming the equilibrium is unique), one needs more information. The locus of steady state points provides this information. The mildly concave downward sloping curves are indifference curves associated with the indirect utility function in (P1 ); welfare is increasing toward the origin, at which point both distortions would be eliminated. The indifference curves slope downward because both objects are bads; if the markup rises, the relative price distortion must fall for welfare to be unchanged. The convex parabolic curves are pricing constraints for three different assumptions about the future markup and relative price distortion (µ and ρ ). To explain the shape of the pricing constraints, I will focus on the flat points that occur for each constraint at ρ = 1. When ρ = 1, it is also the case that c0 = c1 = c and P0 = P1 = P : all firms charge the same price and sell the same quantity. For the constraint corresponding to a given pair (µ , ρ ), the ρ = 1 point reveals the current markup (and thus real marginal cost) for which a relative price equal to unity maximizes the present value of profits. Now vary real marginal cost either up or down; from equation (13) the optimal price will change, necessarily moving away from the price set by firms in the previous period. With the two types of firms charging different prices, the relative price distortion is necessarily greater than one. The further marginal cost moves from the level associated with no relative price distortion, the greater the relative price distortion that must be accepted. This explains why the relative price distortion rises along every constraint as we move away from the point where ρ = 1.
46
Federal Reserve Bank of Richmond Economic Quarterly
The curve that slices through the middle of the figure—apparently positively sloped—is the locus of points that correspond to steady state equilibria; to compute this locus, I impose a steady state and vary the money growth rate, tracing out the (ρ, µ) locus that results. Along the steady state locus, moving upward usually corresponds to raising the steady state inflation rate. At higher rates of inflation, the dispersion—and hence distortion—in relative prices increases. The average markup also usually rises with the steady state inflation rate: higher markups by adjusting firms more than offset the increased markup erosion experienced by nonadjusting firms.9 A policymaker in the current period takes as given firms’ expectations about the future. These expectations determine the relevant pricing constraint, and the policymaker chooses levels of the current distortions such that an indifference curve is tangent to the relevant pricing constraint. At such a point, the rate at which firms’ behavior allows the policymaker to trade off the markup against the relative price distortion is equated to the rate at which the policymaker’s welfare function trades off the markup against the relative price distortion. The former rate is given by the slope of the pricing constraint, and the latter is given by the slope of the indifference curve. As indicated above, for arbitrary expectations about the future, a tangency point does not represent an equilibrium. Given the future outcome, a single tangency point does represent optimal policy and private sector equilibrium in the current period, but there is no guarantee that the future outcome taken as given is an equilibrium. If the future outcome and the current outcome are identical, then we have an equilibrium: the outcome taken as given in the future is found to be optimal in the current period, and because the future looks just like the present, that outcome will be optimal in the future. Suppose firms expect � � that in the next period the markup will be at its static level µ = ε/ − 1) and the relative price distortion will be eliminated (ε � � ρ = 1 . This is the outcome in a steady state with zero inflation, and it is also the long-run limit point under optimal policy with commitment. This point is helpful in understanding the nature of equilibrium even though it is not itself an equilibrium. The current period policymaker then faces the dashed pricing constraint, which passes through the steady state locus at µ = ε/ (ε − 1) and ρ = 1. It is feasible for the current policymaker to achieve the same outcome 9 Some readers will correctly infer from Figures 1 and 2 that the steady state locus in Figure 4 is nonmonotonic and has a second branch not shown in the figure. The argument goes as follows. As the steady state inflation rate falls from high levels, the markup and the relative price distortion fall together, but at a low positive inflation rate shown in Figure 2, further decreases in inflation lead to higher markups, whereas the relative price distortion continues to fall until inflation turns into deflation. There is a small downward sloping portion of the steady state locus that corresponds to the low inflation region where the relative price distortion is rising with inflation and markup is falling with inflation. There is also a second branch of the locus—upward sloping—that lies to the right of the branch in Figure 4. One can show that no steady state equilibrium lies on this branch.
A. L. Wolman: Optimal Monetary Policy
47
expected in the future. Because that outcome is the limit point of optimal policy under commitment, it is indicated with a heart in Figure 4. Because the relative price distortion is eliminated, the pricing constraint passes through this point with zero slope. Immediately this point can be ruled out as an equilibrium because the indifference curves have negative slope everywhere. A policymaker contemplating the heart outcome would see that he or she could do better by accepting some relative price distortion in exchange for a lower markup. Specifically, a policymaker facing µ = ε/ (ε − 1) and ρ = 1 would choose the point marked with a slashed circle; it is on the same pricing constraint but tangent to an indifference curve with higher welfare. This tangency is not an equilibrium, though, because it implies a different outcome in the current period than in the future.10 A steady state discretionary equilibrium is a point on the steady state locus at which an indifference curve is tangent to a constraint. The point marked with a smile is the unique steady state equilibrium. The relative price distortion is fairly high, so the pricing constraint is steeply downward sloping and at this point is tangent to an indifference curve. It is feasible for the policymaker to reduce the markup from this point, but doing so would require an increase in the relative price distortion big enough to make welfare fall.11 The high relative price distortion corresponds to a high inflation rate (around 15 percent annually). Comparing the steady state equilibrium under discretion to the heart-shaped point, which represents the limiting behavior under commitment, it is clear that in the long run the economy is worse off without commitment. Even though the discretionary policymaker acts in society’s best interest, society would be better off if the policymaker could credibly commit to future policy actions.
6.
CONCLUSIONS
There has been an explosion of research in recent years on sticky-price models with optimizing agents (see Taylor [1998]). At least three notions of optimal monetary policy are natural in these models: the optimal steady state inflation rate; the path that maximizes present value welfare when policy can commit to future actions; and the equilibrium that occurs when each period’s policymaker 10 To be clear, equilibrium does not necessarily imply constant outcomes over time. In the current model, however, with optimal discretionary policy there are no exogenous forces leading to changing outcomes over time. Thus, a Markov-Perfect equilibrium involves constant outcomes. 11 Peter Ireland (1997) shows that when all firms set their price before the policymaker moves and for just one period, in an otherwise similar model there is no interior Markov-Perfect equilibrium. Because all firms charge the same price, unexpected monetary expansions have no cost to the policymaker in Ireland’s model. No matter how high an inflation rate is expected, the policymaker would always choose to bring down the markup by making inflation even higher. Here there is an interior Markov-Perfect steady state because higher inflation exacerbates the relative price distortion.
48
Federal Reserve Bank of Richmond Economic Quarterly
maximizes present value welfare, but no policymaker can commit to future actions. In one model where nominal factors affect real allocations only because of staggered price-setting, I obtain the following results. The optimal steady state inflation rate is slightly positive (less than 1 percent) because a very small amount of constant inflation decreases the economy’s average markup. A policy that maximizes present value welfare under commitment leads toward zero inflation, for the higher markup that will result in the long run is preceded by a lower markup in early periods that are weighted more heavily. When policy cannot commit, the inflation rate that results from optimizing behavior is quite high, on the order of 15 percent. Corresponding to the higher inflation rate without commitment is a lower level of welfare for the representative agent. If staggered price-setting in fact represents the primary channel through which monetary policy affects real variables, the results in this article indicate the value to society of institutions that allow the monetary authority to credibly commit to future behavior.12
APPENDIX
1.
EQUILIBRIUM PRICING CONSTRAINT
From the optimal pricing condition (13) we can derive (14), an equation in c0,t , c1,t , c0,t+1 , and c1,t+1 only. The first step is to use the demand function for c0,t to write the left hand side of (13) in terms of c0,t and c1,t : � � ��−1/ε , P0,t /Pt = c0,t /c c0,t , c1,t � � where the function c c0,t , c1.t is given by the consumption aggregator (3). For the right hand side, again use the consumption aggregator � � to eliminate ct and ct+1 , and use the time constraint to write leisure lt+j in terms of c0,t+j and c1,t+j : � � � � � 1� c0,t+j + c1,t+j . l c0,t+j , c1,t+j = 1 − n c0,t+j , c1,t+j = 1 − 2
(27)
12 Practically speaking, a specific commitment about the nature of future policy could never be completely credible. However, feasible institutional arrangements can tie the policymaker’s hands somewhat, decreasing the severity of the time consistency problem. For a comparative study of institutional arrangements for monetary policy in various countries, see Bernanke et al. (1999).
A. L. Wolman: Optimal Monetary Policy
49
Next, use the labor supply equation (10) to write the real wage in terms of c0 and c1 : � � � � � � � � �� � � �� w c0,t , c1,t = ul c c0,t , c1,t , l c0,t , c1,t /uc c c0,t , c1,t , l c0,t , c1,t , (28) and use the demand functions for c0 and c1 to write the inflation rate in terms of current and past c0 and c1 : � � P0,t /Pt = (29) π t+1 c0,t , c1,t , c0,t+1 , c1,t+1 ≡ Pt+1 /Pt = P0,t /Pt+1 � � � �−1/ε c0,t /c c0,t , c1,t P0,t /Pt � � = . P1,t+1 /Pt+1 c1,t+1 /c c0,t+1 , c1,t+1 Substituting all of these relationships into (13) yields �
where Nt
c0,t � � c c0,t , c1,t
�−1/ε
=
ε ε−1
� � N c0,t , c1,t , c0,t+1 , c1,t+1 � �, D c0,t , c1,t , c0,t+1 , c1,t+1
(30)
� � � � � �� � ≡ ul c c0,t , c1,t , l c0,t , c1,t · c c0,t , c1,t + � � � � �� � � β · ul c c0,t+1 , c1,t+1 , l c0,t+1 , c1,t+1 · c c0,t+1 , c1,t+1 · � � � �−1 c0,t /c c0,t , c1,t � � c1,t+1 /c c0,t+1 , c1,t+1
� � � � �� � � ≡ uc c c0,t , c1,t , l c0,t , c1,t · c c0,t , c1,t + � � � � �� � � β · uc c c0,t+1 , c1,t+1 , l c0,t+1 , c1,t+1 · c c0,t+1 , c1,t+1 · � � � � 1−ε ε c0,t /c c0,t , c1,t � � . c1,t+1 /c c0,t+1 , c1,t+1 � �� � Next, multiplying both sides of (30) by (ε − 1) · c0,t /c c0,t , c1,t · Dt , and collecting terms according to whether they contain β factors, we arrive at �−1/ε � c0,t � � − ε · ul,t + (31) 0 = c0,t · (ε − 1) · uc,t · c c0,t , c1,t �−1/ε � c1,t+1 � � − ε · ul,t+1 . β · c1,t+1 · (ε − 1) · uc,t+1 · c c0,t+1 , c1,t+1 Dt
This yields (14) in the text, with �
−1/ε � a x (a, b) ≡ a · (ε − 1) · uc (c (a, b) , l (a, b)) · c(a,b) . −ε · ul (c (a, b) , l (a, b))
(32)
50
Federal Reserve Bank of Richmond Economic Quarterly
(Note that c (a, b) ≡ c (b, a) and � l�(a, b) ≡�l (b,� a) and that �� in (31) I have used abbreviated objects such as uc c c0,t , c1,t , l c0,t , c1,t by writing them as uc,t .)
2. c0 AND c1 AS FUNCTIONS OF THE TWO DISTORTIONS The definitions of the two distortions immediately imply µ = a/w = a ·
uc (c (c0 , c1 ) , l (c0 , c1 )) ul (c (c0 , c1 ) , l (c0 , c1 ))
(33)
(1 + c1 /c0 )
ε . ε−1 ε−1 1 + (c1 /c0 ) ε
(34)
and 1
ρ = 2 ε−1 ·
From (34), it is clear that the ratio c1 /c0 depends only on ρ. That is, c1 /c0 = � (ρ), where � (ρ) is the function defined implicitly by (34). Substitute this function into (33) to get uc (c (c0 , � (ρ) · c0 ) , l (c0 , � (ρ) · c0 )) µ=a· , (35) ul (c (c0 , � (ρ) · c0 ) , l (c0 , � (ρ) · c0 )) which implicitly gives c0 as a function of µ and ρ. That is, c0 = � (µ, ρ), and hence c1 = � (ρ) · � (µ, ρ).
REFERENCES Bailey, Martin J. 1956. “The Welfare Cost of Inflationary Finance.” The Journal of Political Economy 64 (April): 93–110. Barro, Robert, and David B. Gordon. 1983. “A Positive Theory of Monetary Policy in a Natural-Rate Model.” Journal of Political Economy 91 (August): 589–610. Bernanke, Ben S., Thomas Laubach, Frederic S. Mishkin, and Adam S. Posen. 1999. Inflation Targeting: Lessons From the International Experience. Princeton N.J.: Princeton University Press. Blanchard, Olivier Jean, and Stanley Fischer. 1989. Lectures on Macroeconomics. Cambridge, MA: MIT Press. Dennis, Richard. 2001. “Pre-Commitment, the Timeless Perspective, and Policymaking from Behind a Veil of Uncertainty.” Manuscript, Federal Reserve Bank of San Francisco.
A. L. Wolman: Optimal Monetary Policy
51
Friedman, Milton. 1969. “The Optimum Quantity of Money,” in The Optimum Quantity of Money and Other Essays. Chicago: Aldine Publishing Company. Goodfriend, Marvin, and Robert G. King. 2001. “The Case for Price Stability.” Working Paper 01-2. Federal Reserve Bank of Richmond. . 1997. “The New Neoclassical Synthesis and the Role of Monetary Policy.” In NBER Macroeconomics Annual, ed. Ben Bernanke and Julio Rotemberg. Cambridge, Mass.: MIT Press: 231–95. Ireland, Peter. 1997. “Sustainable Monetary Policies.” Journal of Economic Dynamics and Control 22 (November): 87–108. Khan, Aubhik, Robert G. King, and Alexander L. Wolman. 2000. “Optimal Monetary Policy.” Working Paper 00-10. Federal Reserve Bank of Richmond. . 2001. “The Pitfalls of Monetary Discretion.” Working Paper 01-8. Federal Reserve Bank of Richmond. King, Robert G., and Alexander L. Wolman. 1996. “Inflation Targeting in a St. Louis Model of the 21st Century.” Federal Reserve Bank of St. Louis Review 78 (May/June): 83–107. . 1999. “What Should the Monetary Authority do When Prices are Sticky?” In Monetary Policy Rules, ed. John B. Taylor. Chicago: University of Chicago Press: 349–98. Krusell, Per, and Jose Victor Rios-Rull. 1999. “On the Size of U.S. Government: Political Economy in the Neoclassical Growth Model.” American Economic Review 89 (December): 1156–81. Kydland, Finn, and Edward C. Prescott. 1980. “Dynamic Optimal Taxation, Rational Expectations and Optimal Control.” Journal of Economic Dynamics and Control 2 (February): 79–91. . 1977. “Rules Rather than Discretion: The Inconsistency of Optimal Plans.” Journal of Political Economy 85 (June): 473–92. Marcet, Albert, and Ramon Marimon. 1999. “Recursive Contracts.” Manuscript. http://www.iue.it/Personal/Marimon/recursive399.pdf. McCallum, Bennett T. 1996. “Neoclassical vs. Endogenous Growth Analysis: An Overview.” Federal Reserve Bank of Richmond Economic Quarterly 82 (Fall): 41–72. Rotemberg, Julio J., and Michael Woodford. 1999. “Interest Rate Rules in an Estimated Sticky Price Model.” In Monetary Policy Rules, ed. John B. Taylor. Chicago: University of Chicago Press: 57–119.
52
Federal Reserve Bank of Richmond Economic Quarterly
Taylor, John B. 1999. “Staggered Wage and Price Setting in Macroeconomics.” In Handbook of Macroeconomics, vol. 1B, eds. John B. Taylor and Michael Woodford. Amsterdam: Elsevier Science B.V.: 1009–50. Wolman, Alexander L. 1999. “Sticky Prices, Marginal Cost, and the Behavior of Inflation.” Federal Reserve Bank of Richmond Economic Quarterly 85 (Fall): 29–48. . 2000. “The Frequency and Costs of Individual Price Adjustment.” Federal Reserve Bank of Richmond Economic Quarterly 86 (Fall): 1–22. Woodford, Michael. 1999. “Commentary: Monetary Policy at Zero Inflation.” In New Challenges for Monetary Policy. Kansas City: Federal Reserve Bank of Kansas City: 277–316. Yun, Tack. 1996. “Nominal Price Rigidity, Money Supply Endogeneity, and Business Cycles.” Journal of Monetary Economics 37 (July): 345–70.