London, UK, 1997. Springer-Verlag. [3] A. Gray, P. Sallis, and S. MacDonell. Identified (integrated dictionary-based extraction of non-language-dependent to-.
A Probabilistic Approach to Source Code Authorship Identification Jay Kothari, Maxim Shevertalov, Edward Stehle, and Spiros Mancoridis Department of Computer Science College of Engineering Drexel University 3141 Chestnut Street, Philadelphia, PA 19104, USA {jayk, ms333, evs23, spiros}@drexel.edu
Abstract
of source code. We are motivated by, and build upon, the vision preThere exists a need for tools to help identify the author- sented by Gray et. al. [3] in which they describe the necesship of source code. This includes situations in which the sity of tools to help determine authorship of source code. ownership of code is questionable, such as in plagiarism Our paper presents an approach that uses author characteror intellectual property infringement disputes. Author- ization in order to perform author identification. Our apship identification can also be used to assist in the ap- proach determines the likeliest developer of unidentified prehension of the creators of malware. In this paper we source code by matching key characteristics about coding present an approach to identifying the authors of source style and presence of character sequences. code. We begin by computing a set of metrics to build proThe main applications of this research are in the legal files for a population of known authors using code sam- domain. The first application is in the area of plagiarism ples that are verified to be authentic. We then compute and intellectual property violations. Given disputes over metrics on unidentified source code to determine the clos- the ownership of source code we can determine the likeliest matching profile. We demonstrate our approach on a hood of developers’ claims to authorship. case study that involves two kinds of software: one based The second use of this technique relates to detecting on open source developers working on various projects, the authors of malicious code. Given a database of known and another based on students working on assignments malware, and their authors; when new malware appears, with the same requirements. In our case study we are able we can determine the likelihood that it is written by one to determine authorship with greater than 70% accuracy or more of the authors that have previously authored such in choosing the single nearest match and greater than code. Knowing which developer authored the malicious 90% accuracy in choosing the top three ordered nearest code is useful in more than just apprehending the culprit, matches. but also in neutralizing the malware since it is likely that the approach taken in the malware undergoing scrutiny is similar to that used in previously studied malware [5].
1
Introduction
There are certain patterns that developers inherently produce based on their particular style of coding while still following the guidelines, rules, and grammar of the language. Similar to analyzing prose for authorship [4, 7] we identify certain peculiarities in the styles of software developers and use these styles to determine the authorship
2
Computing developer profiles
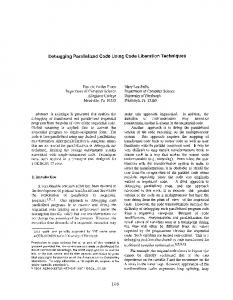
To determine the authorship of source code, we first develop profiles for a population of known developers. Figure 1 depicts the tool-chain for developing a database of profiles. The profiles describe inherent characteristics
Figure 1: Process of computing developer profiles; (a) Source code samples of known developers, (b) Metric extraction tool, (c) Metric evaluations per developer, (d) Metric filtering and selection tool, (e) Database of profiles. found in the source code of developers. We begin by obtaining several samples of code from a population of developers. We associate the samples to their respective developers and process them through one or more metric extraction tools. For each developer we obtain a list of metrics and their values. We process these metric lists through a filtering tool in order to determine, for each developer, which metrics are most effective in their characterization. Lastly, we store the filtered metrics as profiles in a database for use in determining authors of unclassified source code. In our approach we restricted ourselves to using only character based metrics to characterize developers. In particular we used two types of metrics; the first type is style based (Section 2.1), and the second type is based on patterns of character sequences (Section 2.2) that exist in the source code samples provided. Section 2.3 describes how we select metrics that are effective in classifying specific developers.
2.1
Style based metrics
The first set of metrics we consider are style based character metrics: • • • • • •
of the line sizes for a particular developer. The developer’s sample source code exhibits line sizes varying from zero characters to 120 characters, as can be see on the horizontal axis. The vertical axis indicates how many times line sizes of a given value (length) was observed. Each line size value is considered a unique metric. Similarly, we compute the distributions for all style metrics for all developers.
Distribution of line size Distribution of leading spaces Distribution of underscores per line Distribution of semicolons Distribution of commas per line Distribution of tokens (words) per line
For each developer we compute a histogram for each distribution. For example, Figure 2 shows the histogram
Figure 2: Histogram of line sizes; Horizontal axis indicates the exhibited line size values, and vertical axis indicates the normalized frequency, or count, of that line size value for the particular developer.
2.2
Text distribution metrics
We present a distrubtion of chararacter sequences in a histogram. For each developer we determine all possible n consecutive character sequences, and the frequency at
which each sequence occurs. Consider the code: x=x+1
(1)
If we take n=2, that is all possible 2 character sequences, then the observed sequences are: x(space), (space)=, =(space), (space)x, (space)+, +(space), and (space)1. The sequence x(space) is observed twice, and all others are observed once. In our case study we computed the distribution of n-character patterns for n=2 to n=10. We determined that n = 4 provided the best results based on the selection criteria defined in Section 2.3.
2.3
case, leading spaces of 0, 7, 14, 21 and 28 spaces exhibit high individual consistency entropy since the developer consistently uses leading spaces of those lengths. However, leading spaces of length between 0 and 7, are poor choices since the individual consistency entropy is zero as leading spaces of these lengths are never observed.
Metric filtering and selection
Having computed the set of histograms for each developer, we determine, for each developer seperately, which metric values are characteristic of that developer. For our selection criteria we employ Shannon’s information entropy [8], which is calculated by the following equation: Figure 3: Entropy distribution of leading spaces for a sin(2) gle developer; The horizontal axis indicates the observed i number of leading spaces, and the vertical axis indicates where x is the metric whose entropy we wish to calculate, the percentage of maximum entropy for the metric. 0, i is the classification basis, and p(i|x) is the probability 7, 14, 21 and 28 leading spaces exhibit high individual function that given metric x, class i will be chosen. As consistency entropy, indicating the developer consistently we will describe, i is either a developer or a source code uses leading spaces of these lengths. file. The probability function p(i|x) is determined by the Population consistency entropy is calculated for all source files provided by developers, which can be seen in Figure 1(a). The probability that the metric x is classified metrics using the source files of all developers, therefore to i is calculated as the observed frequency of the instance class i, from Equation 2, represents an individual develof metric x in the source code sample of class i divided by oper . In this case we wish to minimize the entropy withthe total number of times we observe that metric across out going to zero. Lower entropy indicates that very few instances of this metric are observed, and are sufficiently all classes. For each metric we compute two entropy values. The unique across all developers. An entropy of zero indicates first entropy value is the individual consistency entropy that a particular developer could be classified solely using and the second is the population consistency entropy. In- the metric being calculated. However, based on our obserdividual consistency indicates how consistently a devel- vations this occurs most often due to project-specific texoper’s code exhibits a specific metric. This is calculated tual features in the source files provided by developers. using only a single developer’s source, and therefore class For this reason we discount all metrics with an entropy i, from Equation 2, represents the developer’s source code value of zero. Consider Figure 4 which depicts the dissample. That is, we want to find a metric value whose tribution ofleading spaces across all developers. Instances entropy is maximized, since that represents a consistency where leadings spaces are 14 or 21 have a low population in the behavior of the developer. For example let us con- consistency entropy since very few developers use leading sider the leading spaces metric, which measures the num- spaces of these lengths. Therefore they would be relevant ber of spaces that begin a line. Figure 3 shows the dis- for classification. Using these two entropy values, we develop a selection tribution of leading spaces for a single developer. In this E(x) = −
n X
p(i|x) log p(i|x)
oper consistently uses leading spaces of these lengths, and seems to be one of few who have leading spaces of these lengths in the developer population. On the other hand, although the developer has high individual consistency entropy for leading spaces of 0 and 7 characters, the population consistency entropy is also high indicating that it is not useful for distinguishing authorship.
3
Identifying the authorship of source code
Figure 4: Entropy distribution of leading spaces across all developers; Drops in the population consistency entropy, for metrics such as 14 and 21 leading spaces, are potentially good choices for some developers since the low entropy indicates that few developers exhibit this textual phenomenon. criterion to choose which metrics to use in creating a developer’s profile: S(d, m) =
IndividualConsistency(d, m) P opulationConsistency(m)
(3) Figure 5: Process of classifying authorship of source code; (a) Input of source code with unidentified author where d represents a developer and m represents a metric. and database of developer profiles, (b) Metric extraction We compute the selection criteria S(d,m) for all metrics of tool, (c) Classification tool, (d) Classified author. every developer. We choose the top 50 metrics for each Now that we have a database of profiles we use it to developer based on the values of the selection criteria. This provides us with metrics that are consistent for that identify who authored unidentified source code. Figure 5 particular developer while also being sufficiently unique describes the process of using the database and a classito distinguish the developer from all other developers. It fication tool to determine the authorship of source code. is important to note that since the selected metrics for each Given the unidentified source code, we compute all the developer are based on this selection criterion, the metrics metrics using the metric extraction tool that we used prethat define a developer’s profile are specific to each devel- viously in building the database of developer profiles. We present the database of developer profiles and the calcuoper. Considering the population consistency entropy for the lated metrics of the unidentified source code to a clasdeveloper population shown in Figure 4 and the individ- sification tool. This tool will rank the likelihood that a ual consistency entropy for the developer represented in known developer is the author of the unidentified source Figure 3, we can determine which are good choices to de- code by computing the similarity of their profile and the fine the developer’s profile. For example if we look at the corresponding metrics of the source code in question. The distribution of leading spaces for a specific programmer highest similarity is chosen to be the most likely author. we find that 14 and 21 leading spaces both have very low We used two different classification tools, which are population consistency entropy and very high individual implemented in the WEKA toolkit [9]. The first classiconsistency entropy, therefore making them good choices fier we used in our approach was the Bayes classifier [1]. for this developer’s profile. This is because the devel- The Bayes classifier is probabilistic and uses Baye’s theo-
Rank 1 2 3
Bayes Style Char 18% 61% 29% 67% 39% 71%
VFI Style Char 30% 76% 46% 80% 50% 82%
Rank 1 2 3
Bayes Style Char 36% 69% 57% 91% 63% 95%
VFI Style Char 27% 59% 47% 84% 56% 90%
Table 1: Percentage of successful classifications within a given rank from the sample of open source developers. Bayes and Voting Feature Interval(VFI) classifiers are used with style based metrics (Style) as well as 4character pattern based distribution metrics (Char).
Table 2: Percentage of successful classifications within a given rank from the sample of students. Bayes and Voting Feature Interval (VFI) classifiers are used with style based metrics (Style) as well as 4-character pattern based distribution metrics (Char).
rem. The other classification tool we used was the Voting Feature Intervals (VFI) classifier [2]. VFI partitions each metric into intervals such that all of the metrics for each developer fall into exactly one interval.
nificantly lower, with the first, second, and third choices having a success rate of 18%, 29%, and 39%, respectively. When using the VFI classifier and the 4-character patterns, the unidentified source code is correctly classified to its author 76% of the time. 80% of the time, the correct author is in the top two choices, and 82% in the top three choices. Comparatively, using style based metrics the first, second and third rankings yield lower results at 30%, 46% and 50% ,respectively. Table 2 presents the results of classifying the test sample for students. The table we can see that using 4character pattern distributions with the Bayes classifier correctly classified the unidentified source code to its author 69% of the time. 91% of the time, the correct author is in the top two choices for author; and 95% in the top three choices. However using style based metrics the success rate is significantly lower, with the first, second, and third choices having a success rate of 36%, 57%, and 63%, respectively. Using the VFI classifier and the 4-character patterns, the unidentified source code is correctly classified to its author 59% of the time. 84% of the time, the correct author is in the top two choices, and 90% in the top three choices. Comparatively, using style based metrics the first, second and third rankings yield lower results at 27%, 47%, and 56%, respectively. Based on these results, in both studies, we observe that the 4-character pattern based metrics significantly outperform the style based metrics. This may be true because the character sequences metrics might capture the information within the style based metrics as well as information such as variable and method naming conventions and
4
Case Study
To demonstrate our approach we conducted a case study based on two distinct sets of developers. The first set consists of twelve developers with more than two open source projects where they are the sole developer. We used all but one project from each of the developers to create the profile database, and the remaining project to test our classification mechanism. This provided us with 1287 source code samples (i.e., files) to create profiles for all the developers, and 823 samples to test our approach. The second set of developers consisted of eight students from an undergraduate programming course. All students submitted three assignments. The requirements were the same for all students for each assignment. We used the first two assignments to build developer profiles for each of the students, and tested our approach with the third assignment of each student. This provided us with 108 source code samples (i.e., files) to build the profile database and 112 samples to test our approach. Table 1 presents the results of classifying the test sample for open source developers. The table shows that using 4-character pattern distributions with the Bayes classifier correctly classified the unidentified source code to its author 61% of the time. 67% of the time, the correct author is in the top two choices, and 71% in the top three. However using style based metrics the success rate is sig-
use of library functions. It is important to note that we discounted any 4character sequence that was not present in the sample files of at least two developers. The rationale behind this choice was that, although a unique pattern may be present in a developer’s known source samples it is likely to be a textual pattern that is unique to the project that the sample was obtained from, such as a project name. Despite the fact that the VFI classifier produced better results in the case study involving open source developers, it was not better in the case study involving students. We observed, however, that both VFI and Bayes classifiers correspondingly increase in the success of classification. VFI has a distinct advantage over Bayes in the time required to classifying authorship [2].
5
Future work
In addition to processing a larger number of developers and samples, we plan to extend our work in several ways. First, we would like to study different metrics. We also plan to move beyond character based metrics to software metrics that are computed by parsing the source code. We also would like to consider other classification mechanisms such as histogram moments [6]. Lastly, we wish to be able to determine if multiple developers have authored a single piece of source code, and automatically partition the code based on authorship.
6
Conclusions
Although the approach presented in this paper relies solely on character based metrics, the results in classifying authorship are promising. We are able to determine the characteristics of developers’ programming styles that persist across different projects. We are able to exploit those habits to determine the authorship of unidentified source code. It is clear that using 4-character sequences as metrics for characterizing developers produces better results in classification because it captures more of a developer’s habits than do style based metrics. On the other hand, we are unable to determine which is superior, Bayes or VFI, since they both perform equally well.
7
Acknowledgment
This research was funded by a U.S. Department of Justice Edward Byrne Grant. We would also like to thank Dr. Chris Rorres for his help in refining our approach.
References [1] R. Bouckaert. Bayesian network classifiers in weka. Technical Report 14/2004, The University of Waikato, Department of Computer Science, Hamilton, New Zealand, 2004. [2] G. Demiroz and H. A. Guvenir. Classification by voting feature intervals. In ECML ’97: Proceedings of the 9th European Conference on Machine Learning, pages 85–92, London, UK, 1997. Springer-Verlag. [3] A. Gray, P. Sallis, and S. MacDonell. Identified (integrated dictionary-based extraction of non-language-dependent token information for forensic identification, examination, and discrimination): a dictionary-based system for extracting source code metrics for software forensics. In Software Engineering: Education and Practice, 1998. [4] D. I. Holmes. Authorship attribution. Computers and the Humnities, 28:87–106, 1994. [5] M. E. Karim, A. Walenstein, A. Lakhotia, and L. Parida. Malware phylogeny generation using permutations of code. Journal in Computer Virology, 1:13–23, 2005. [6] M. Mandal, T. Aboulnasr, and S. Panchanathan. Image indexing using moments an wavelets. In IEEE Transactions on Consumer Electronics, pages 557–565, Rosemont, IL, USA, 1996. IEEE. [7] P. Sallis, A. Aakjaer, and S. MacDonell. Software forensics: old methods for a new science. In Proceedings of International Conference on Software Engineering: Education and Practice, page 481, Los Alamitos, CA, USA, 1996. IEEE Computer Society. [8] C. E. Shannon. A mathematical theory of comminication. The Bell System Technical Journal, 22:379–423, July, October 1948. [9] I. H. Witten and E. Frank. Data Mining: Practical Machine Learning Tools and Techniques. Morgan Kaufmann, San Francisco, 2 edition, 2005.