the 45 programs studied have clusters of dependence that consume more than 10% of ... Categories and Subject Descriptors: D.2.5 [Software Engineering]: Testing and Debuggingâ ...... IEEE Computer Society Press, Los Alamitos, California,.
Dependence Clusters in Source Code MARK HARMAN King’s College London DAVID BINKLEY Loyola College KEITH GALLAGHER Durham University NICOLAS GOLD King’s College London and JENS KRINKE King’s College London A dependence cluster is a set of program statements, all of which are mutually inter-dependent. This paper reports a large scale empirical study of dependence clusters in C program source code. The study reveals that large dependence clusters are surprisingly commonplace. Most of the 45 programs studied have clusters of dependence that consume more than 10% of the whole program. Some even have clusters consuming 80% or more. The widespread existence of clusters has implications for source code analyses such as program comprehension, software maintenance, software testing, reverse engineering, reuse, and parallelization. Categories and Subject Descriptors: D.2.5 [Software Engineering]: Testing and Debugging— debugging aids; D.2.7 [Software Engineering]: Distribution, Maintenance, and Enhancement— Restructuring, reverse engineering, and reengineering; D.2.8 [Software Engineering]: Metrics— Complexity measures General Terms: Algorithms, Languages, Measurement Additional Key Words and Phrases: Dependence, program comprehension, program slicing
Authors’ Addresses: Mark Harman, King’s College London, Strand, London, WC2R 2LS, UK. David Binkley, Loyola College in Maryland, Baltimore, Maryland, 21210-2699, USA. Keith Gallagher, Durham University, South Road, Durham, DH1 3LE, UK. Nicolas Gold and Jens Krinke King’s College London, Strand, London, WC2R 2LS, UK. This is the authors’ version of the work. It is posted here by permission of ACM for your personal use. Not for redistribution. The definitive version will be published in ACM Transactions on Programming Languages and Systems. Permission to make digital/hard copy of all or part of this material without fee for personal or classroom use provided that the copies are not made or distributed for profit or commercial advantage, the ACM copyright/server notice, the title of the publication, and its date appear, and notice is given that copying is by permission of the ACM, Inc. To copy otherwise, to republish, to post on servers, or to redistribute to lists requires prior specific permission and/or a fee. c 2009 ACM 0164-0925/2009/0500-0001 $5.00 ° ACM Transactions on Programming Languages and Systems, Vol. V, No. N, February 2009, Pages 1–0??.
2
1.
·
Mark Harman et al.
INTRODUCTION
Program dependence analysis explores the dependence relationships between program statements. This statement-level dependence analysis is the cornerstone of many activities that rely upon program analysis, such as program comprehension [De Lucia et al. 1996; Korel and Rilling 1997; 1998; Harman et al. 2003; Binkley et al. 2000; Ning et al. 1994], procedure extraction [Komondoor and Horwitz 2000; Harman et al. 2004], clone detection [Gallagher and Layman 2003], visualization [Gallagher and O’Brien 2001], impact analysis and reduction [Black 2001; Gallagher et al. 2003; Tonella 2003], reuse [Cimitile et al. 1995; 1996], software measurement [Bieman and Ott 1994; Hall et al. 2005; Lakhotia 1993; Yau and Collofello 1985], software maintenance [Gallagher and Lyle 1991], testing and debugging [Bates and Horwitz 1993; Binkley 1997; Gallagher and Binkley 2003; Gupta et al. 1992; Harman et al. 2004], virus detection [Lakhotia and Singh 2003], validation [Krinke and Snelting 1998], integration [Binkley et al. 1995; Horwitz et al. 1989], and restructuring, reverse engineering and reuse [Beck and Eichmann 1993; Canfora et al. 1998; Canfora et al. 1994; Jackson and Rollins 1994; Lakhotia and Deprez 1998]. Since program dependence is essentially a relation on program statements it is typically represented as a graph. This ‘graph nature’ of dependence raises a natural question as to whether large connected components are found in real-world programs. In this paper such clusters of interdependent statements are termed dependence clusters, because they denote clusters of program components that all mutually depend upon one another. At higher levels of abstraction, such as modules and functions, clustering has been considered important for the evolution of good software architecture and so these higher-level dependence clusters have been widely studied [Harman et al. 2005; Mahdavi et al. 2003; Gallagher and Binkley 2003; Mitchell and Mancoridis 2002; 2006]. However, despite the relative importance of statement-level dependence, there have been no previous studies of them. This paper presents an empirACM Transactions on Programming Languages and Systems, Vol. V, No. N, February 2009.
Dependence Clusters in Source Code
·
3
main() { while (i0) i = i+2; }
Fig. 1.
A cluster caused by data (black) dependences and control (grey) dependences.
ical analysis of statement-level dependence clusters, providing evidence that such dependence clusters are surprisingly widespread. A dependence cluster (hereinafter, the term dependence cluster refers to a statement-level dependence cluster) is formally defined in the next section as the solution to a reachability problem. This definition is instantiated using reachability over a program’s System Dependence Graph (SDG) [Horwitz et al. 1990]. As a simple illustrative example of a dependence cluster, consider the example in Figure 1. In this example, the predicate i < 10 data depends on the assignment to i, this assignment control depends on the predicate of the if statement, and the if control depends on the predicate i < 10. As a result, all three statements are mutually inter-dependence; they form a dependence cluster. Any change to any one of the three will have a potential effect on the others. The paper examines the prevalence of dependence clusters, revealing them to be surprisingly large and widespread in the code studied. The paper considers both forward and backward dependence and examines some of the causes and implications of the prevalence of large dependence clusters. The paper uses an approach that approximates whether two or more statements (or, more precisely, dependence graph nodes) are in a dependence cluster by checking to see if the sizes of their slices [Binkley and Gallagher 1996] are identical. This ACM Transactions on Programming Languages and Systems, Vol. V, No. N, February 2009.
4
·
Mark Harman et al.
‘same size slice’ approach is a conservative (and therefore safe) approximation to the true dependence cluster relation; it may produce false positives, but never false negatives. Results are visualized with the aid of the Monotone Slice-size Graph (MSG) whose construction is made possible using massive slicing optimizations to the basic SDG-based slicing algorithm [Binkley et al. 2007]. A group of slices of similar size appears as a “plateau” in the monotonically increasing profile of slice sizes in the MSG. The paper presents results from two empirical studies1 . These are designed to evaluate the concept of a dependence cluster. One of these studies provides verification, while the other is concerned with validation. The verification question addressed is “How precise is the approximation which underpins the MSG?” Verification is concerned with whether the approach works. Since the approach is a conservative approximation, capable of yielding false positives, it is important to gauge how often these false positives occur in practice. If they are too frequent then the approach is not viable. For very small slices, it is expected that two slices could have the same size and yet be different. However, it is just too much of a coincidence to find two large slices of the same or very similar size but entirely different content. The verification study bears out this informal observation. It shows that, when the slices in dependence clusters are considered, for 99.5% of clusters, the slices in these clusters are all 99+% identical. The validation question is “How common are large dependence clusters?” Validation is concerned with whether large dependence clusters exist in real programs (making dependence cluster analysis a valid course of study). Of course, 1 An earlier version of these studies was presented by Binkley and Harman [2005b]. The present paper extends the empirical study to consider more than twice as many programs, presenting results in greater detail and with extended discussion of the findings and their implications.
ACM Transactions on Programming Languages and Systems, Vol. V, No. N, February 2009.
Dependence Clusters in Source Code
·
5
what constitutes a large dependence cluster depends upon the definition of ‘large’. The validation study shows that there are considerable numbers of large clusters for all reasonable definitions of large. For example, defining a large dependence cluster to contain 10% or more of the program’s statements reveals that large dependence clusters are surprisingly common: 40 out of 45 programs studied (totaling over 1.2 million lines of source code) contained one or more dependence clusters of at least 10% of the program. In both the verification and validation studies, program points whose slices contain fewer than 1% of the nodes of the program’s System Dependence Graph are ignored as they are not likely to be of interest in any application of program slicing. This prevents these slices from biasing the results as all programs include such trivial slices. The most common source is the declaration of global variables, including those found in standard library header files, whose slices include no other part of the program other than the declaration itself. The removal of these slices cannot increase the number of large dependence clusters that are identified by the study. That is, the width of a plateau on the MSG cannot be affected (by definition) so a large cluster will still be large. The number of dependence clusters can therefore be reduced (though it cannot be increased). However, all the additional slices would be extremely small (less than 1% of the program by definition) and therefore not interesting. Overall, the findings of this paper suggest that dependence clusters are worthy of further study. The paper shows that they are easy to define, to locate, and to investigate, as they occur frequently in real programs. The study also provides evidence to suggest that the MSG visualisation is helpful in analyzing dependence clusters. The paper makes the following primary contributions:
(1) It presents the results of an empirical study into the applicability of the MSG as a technique for identifying dependence clusters (Section 4). The slices of ACM Transactions on Programming Languages and Systems, Vol. V, No. N, February 2009.
6
·
Mark Harman et al.
45 programs were analyzed showing that the MSG approximation is extremely accurate. (2) It investigates the prevalence of large dependence clusters, presenting results that indicate that such clusters are very common (Section 5). (3) It investigates one possible cause of dependence clusters, showing that individual predicate nodes can sometimes lead to large clusters, and uses this analysis to show how it is sometimes possible to remove a cluster (Section 6). (4) It presents results for forward dependence cluster analysis and draws a connection between this analysis and work on static impact analysis (Sections 7 and 8). These findings verify the approximation approach and validate the study of dependence clusters. The presence of large dependence clusters has widespread implications. The paper discusses the impact of this finding on related source-code analysis work such as that on program comprehension, testing, maintenance, reuse, and automatic parallelization. The remainder of the paper is organized as follows: Sections 2 and 3 provide formal definitions and describe the experimental setup used for the verification and validation studies. Sections 4 and 5 present the results of the two empirical studies concerned with verification and validation. The verification study shows that Monotone Slice-size Graphs (MSGs) provide a very good approximation, while the validation study shows that large dependence clusters are quite common in realworld source code. Section 6 reports results that investigate on possible cause of dependence clusters. Up to this point in the paper, the dependence clusters considered have been those present for backward dependence analysis. Section 7 presents results that indicate that large forward dependence clusters are also prevalent in the programs under investigation, while Section 8 shows how the presence of forward dependence clusters can dramatically increase the impact of a software change. ACM Transactions on Programming Languages and Systems, Vol. V, No. N, February 2009.
Dependence Clusters in Source Code
·
7
Section 9 considers threats to the validity of the results and Section 10 discusses related work. Finally, Section 11 summarizes the paper. 2.
DEFINITIONS
This section sets out the definitions of dependence cluster and the Monotone Slicesize Graph (MSG) used in the remainder of the paper. Although the empirical study is based on an instantiation of these definitions using slices of the System Dependence Graph (SDG) [Horwitz et al. 1990], the notion of dependence cluster is not necessarily slice-based; thus, the results of the theory presented in this section can be applied beyond slicing. 2.1
Dependence Clusters
A (statement level) dependence cluster is a set of program statements, S, that mutually depend upon one another and for which there is no other mutually dependent set that contains S. This definition is parameterized by an underlying depends-on relation. Herein statements are considered to be source-code representing nodes of the SDG. This excludes from analysis pseudo nodes introduced, for example, to represent global variables that are modeled as additional pseudo parameters by CodeSurfer [Grammatech Inc. 2002], the tool used to build the SDGs. Ignoring such nodes is merely a convenience as it helps tie the result back to the program source code. Definition 1. Mutually-Dependent Set A Mutually-Dependent Set (MDS) is a set of statements, {s1 , . . . , sm } (m > 1), such that for all i, j, 1 ≤ i, j ≤ m si depends on sj . A dependence cluster is simply a maximal set of mutually dependent points. Definition 2. Dependence Cluster A dependence cluster is an MDS not properly contained within any other MDS. In the SDG, if the slice constructed for slicing criterion n1 contains n2 and the slice constructed for criterion n2 contains n1 , then by construction there is a path of ACM Transactions on Programming Languages and Systems, Vol. V, No. N, February 2009.
·
8
Mark Harman et al.
dependence edges from each node in {n1 , n2 } to the other. That is, the two nodes are transitively mutually dependent. This observation can be used to formulate a slice-based notion of dependence cluster. In the definition, Slice(n) is used to denote the set of SDG nodes in the static backward slice taken with respect to node n of the SDG [Horwitz et al. 1990]. Definition 3. Slice-Based Mutually-Dependent Set A Slice-Based MDS is a set of SDG nodes, {n1 , . . . , nm } (m > 1), such that for all i, j, 1 ≤ i, j ≤ m ni ∈ Slice(nj ). By the definition of (static backward) slicing, this means that all nodes in a slice-based MDS depend upon all others in the MDS (including themselves), so {n1 , . . . , nm } satisfies Definition 1. Definition 4. Slice-Based Dependence Cluster A Slice-Based Dependence Cluster is a slice-based MDS contained within no other slice-based MDS. This paper focuses entirely upon slice-based dependence clusters. That is, the clusters considered in this paper arise from the data and control dependence that exists between SDG nodes. This form of dependence has been widely studied and (as shown in Section 10) the dependence clusters that can be identified using slicebased dependence have far-reaching implications for many source code analyses. The majority of the paper considers backward dependence using static backward slicing. However, Section 7 considers, more briefly, forward dependence, showing that forward dependence clusters are also highly prevalent in the programs studied and drawing out relationships to work on static impact analysis. 2.2
Monotone Slice-size Graphs
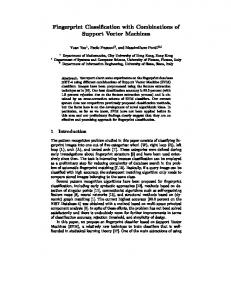
The Monotone Slice Size Graph (MSG) visualisation plots a landscape of monotonically increasing slice size, in which dependence clusters correspond to sheer-drop cliff faces followed by a plateau. The goal of the visualisation is to assist with ACM Transactions on Programming Languages and Systems, Vol. V, No. N, February 2009.
Dependence Clusters in Source Code
Fig. 2.
·
9
The MSG of the Program copia
the inherently subjective task of deciding whether a cluster is large (how long is the plateau at the top of the cliff face relative to the surrounding landscape?) and whether it denotes a discontinuity in the dependence profile (how steep is the cliff face relative to the surrounding landscape?). Definition 5. Monotone Slice-size Graph A Monotone Slice-size Graph is a graph of slice sizes, plotted for monotonically increasing size. That is, slices are ordered according to their size, and the slice sizes plotted in ascending order. For example, consider the program copia in Figure 2, which will be used as a running example throughout this paper. The program implements a collection of analyses on an input table. As can be seen from Figure 2, the MSG contains a large plateau of slices which appear to have the same size; certainly a large dependence cluster. However, zooming in on the plateau in the MSG reveals that this single plateau actually consists of 15 smaller plateaus. The first 5 of these summarize over 99% of the slices that make up the ‘single’ plateau and differ by no more than 4 vertices (about 0.27% of the program). This observation provides evidence for the robustness of the MSG visualisation; although the slices are not of identical size, they are all closely related. The interpretation of the visualisation is correct; there is a large dependence cluster. In this paper the MSG will be used to visualize the dependence structure of programs and the approximation, ‘same slice size’, will be used to stand in for ‘same slice’. For some of the larger programs studied, the computation of ‘same slice’ is unrealistically expensive. Fortunately, as will be seen the computation of ACM Transactions on Programming Languages and Systems, Vol. V, No. N, February 2009.
10
·
Mark Harman et al.
same size is much faster and the approximation it denotes will be shown to be very close to the computation for ‘same slice’ (using a subset of the programs studied for which the values of ‘same slice’ are computable in reasonable time). To further motivate the use of slice-size comparisons as a proxy for slice-content comparisons, consider the complexity of the two. It is possible to locate dependence clusters by comparing all the slices of a program to see which slices are identical. Pseudo code annotated with complexity for this approach is shown in Figure 3. For an SDG of n nodes and e edges, slicing is a linear operation in the number of edges; thus, computing the slice for all statements (nodes) of a program can be done in O(ne) time. Comparing two slices takes O(nlog(n) + n) = O(nlog(n)) steps to first sort the vertices of the two slices and then compare the sorted lists. Pre-sorting the nodes of all of the O(n) slices, takes O(n × nlog(n)) steps. Subsequently, the O(n2 ) pair-wise comparisons each take O(n) time; thus, the partitioning the slices into equivalence classes using that algorithm shown in Figure 3 requires O(n3 ) time. In principle, it is possible to reduce this to O(n2 log(n)). For example, by numbering the vertices of the SDG, each slice can be identified by a single binary number obtained by writing down in sorted order its vertex numbers. Building a trie from numbers places identical slices at the same leaf. The length of the single binary number for each vertex is O(nlog(n)); thus, to compare all n slices would take O(n2 log(n)) steps. However, for large programs this cost grows prohibitive. It also sacrifices the ability to easily identify slices that differ by a small number of vertices. However, an approximation for same-slice can be used that is considerably more efficient. The approximation uses slice size in place of the actual nodes of the slice. Rather than checking to see if two nodes yield identical slices, the approach simply checks if the two yield slices of the same size. This slice-size approach is inherently more efficient than comparing slice content: post-slicing to tabulate the number of slices with each possible size requires only O(n) steps to initialize and then increment a counter for each size. ACM Transactions on Programming Languages and Systems, Vol. V, No. N, February 2009.
Dependence Clusters in Source Code PartitionSlices(Program P) foreach vertex, v sv = slice(P, v)
·
11
Complexity O(ne) == O(n3 ) O(e)
S = set of slices sv foreach slice, s in S s = sort(s)
O(n × nlog(n)) O(nlog(n))
foreach i in 1 · · · |S| foreach j in i+1 · · · ...|S| compare si and sj
O(n3 ) O(n2 ) O(n)
Fig. 3.
Slice Comparison Algorithm
The conjecture that underpins this approximation is that two slices of the same (sufficiently large) size are likely to be the same slice. Clearly, this approximation is conservative because any cluster identified may contain real clusters and no real clusters will fail to be identified. That is, two slices may differ yet, coincidentally, may have identical sizes; however, two slices which are identical must clearly have the same size. The verification study in Section 4 directly addresses the question of the quality of this approximation, which is not only more efficient, but also justifies the use of the MSG as a visualisation for identifying clusters. The MSG is not only efficient to compute, it also helps with the essentially subjective task of determining whether a cluster is large, relative to the code that contains it. As an example, consider again the MSG for userv. The sharp increase in slice size that occurs after about 44% of slices have been considered is followed by a long plateau in which slice size does not change. The length of the plateau indicates a large cluster of slices of identical size; in other words, a large dependence cluster. As discussed in the next section, many otherwise identical slices often differ by a small number of statements. For example, consider the slices on the two computations that compute the sum and average of an array of numbers. The two are identical except for the statement average = sum / N. An advantage of the lack of sharpness [Binkley et al. 2006] in the MSG is that such differences are hidden ACM Transactions on Programming Languages and Systems, Vol. V, No. N, February 2009.
·
12
Mark Harman et al.
(below the resolution of the visualisation). Thus, the dominant features of the dependence landscape are more readily identified.
3.
EXPERIMENTAL CONFIGURATION
The identification of large dependence clusters, as well as the empirical studies contained within this paper, require the computation of massive numbers of program slices. This section provides background on program slicing and the techniques used to compute such a large number of slices. It also introduces the programs studied and the environment in which the data was collected. In order to compute large numbers of slices a variation of the SDG slicing algorithm [Horwitz et al. 1990] was used. The variation is specifically constructed to cater for massive slicing, using a series of graph-based optimizations [Binkley et al. 2007]. Two main techniques are employed. The first identifies intraprocedural strongly-connected components (SCCs) and replaces them with a single representative vertex. The key observation here is that any slice that includes a vertex from an SCC will include all the vertices from that SCC; thus, there is great potential for saving effort by avoiding redundant work. The second technique removes redundant transitive edges from the graph. Such edges never lead to the discovery of new nodes for a slice, but still must be examined during the computation of each slice. We also included a space and time saving efficiency step in the implementation. That is, we compute slice differences incrementally, sharing pointers to subslices that are common to many. This produces a noticeable speed up and reduces space costs, allowing us to cover larger programs, without affecting the results in any way. Using Binary Decision Diagrams (BDDs) would also reduce space costs, but would increase computational costs, because our current representation of slices as bitstrings is optimized for computation (not space). For this reason we chose not to use BDDs for these experiments. ACM Transactions on Programming Languages and Systems, Vol. V, No. N, February 2009.
Dependence Clusters in Source Code
·
13
The study considers 45 C programs, mostly open source, with some industrial programs from the European Space Agency, that range in size from 600 LoC to almost 180 KLoC. The programs cover a range of application domains such as utilities, games, and operating system code. Figure 4 provides a brief description of each program and shows two measures of each program’s size: lines of code (as counted by the Unix utility wc) and the non-comment non-blank lines of code (as counted by the utility sloc [Wheeler 2005]). In total, just over 1.2 million lines of code (895 thousand non-comment, non-blank lines of code) were studied. 4.
EMPIRICAL VERIFICATION: HOW PRECISE IS THE DEPENDENCE CLUSTER DETECTION?
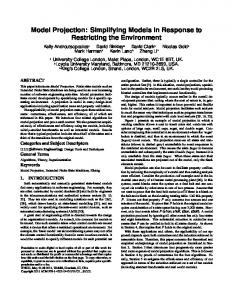
This section presents the results of an experiment into whether similarity in slice size can be used as a proxy for similarity of slice content. The experiment seeks to provide evidence to support the claim that MSGs are a suitable and reliable technique for finding dependence clusters. That is, the research question to be answered is whether a set of slices that have the same size will tend to have the same or nearly the same vertices. Of course, the answer will depend upon the interpretation given to ‘nearly the same’. This will be referred to as similarity; the degree to which two slices can differ in content while being deemed to be essentially the same. Figure 5 investigates the degree to which agreement is improved by admitting a small amount of difference, or put another way, reducing the level of similarity required for agreement. It plots the similarity (on the horizontal axis) against the agreement between slice size and slice content (on the vertical axis) for thirty six of the programs studied (maintaining all slices in memory for comparison with some of the larger programs would require tens of gigabytes of memory and thus these program were omitted from the verification study). Jaccard index, Both axes in Figure 5 are represented as percentages. Here, a similarity is the Jaccard index of a slice where a similarity of x% means that the percentage of nodes in common (the ACM Transactions on Programming Languages and Systems, Vol. V, No. N, February 2009.
14
·
Mark Harman et al.
Program a2ps acct-6.3 barcode bc byacc cadp compress copia cook csurf-pkgs ctags cvs diffutils ed empire EPWIC-1 espresso findutils flex2-4-7 flex2-5-4 ftpd gcc.cpp gnubg-0.0 gnuchess gnugo go ijpeg indent li named ntpd oracolo2 prepro replace sendmail snns space spice termutils tile-forth-2.1 time-1.7 userv wdiff.0.5 which wpst sum average
LoC 63,600 10,182 5,926 16,763 6,626 12,930 1,937 1,170 49,026 66,109 18,663 101,306 19,811 13,579 58,539 9,597 22,050 18,558 15,813 21,543 19,470 6,399 10,316 17,775 81,652 29,246 30,505 6,724 7,597 89,271 47,936 14,864 14,814 563 46,873 79,170 9,564 179,623 7,006 4,510 6,965 8,009 6,256 5,407 20,499 1,284,742 28,550
SLoC 40,222 6,764 3,975 11,173 5,501 10,620 1,431 1,112 34,870 38,507 14,298 67,828 12,705 9,046 48,800 5,719 21,780 11,843 10,654 15,283 15,361 5,731 6,988 14,584 68,301 25,665 18,585 4,834 4,888 61,533 30,773 8,333 8,334 512 31,491 52,798 6,200 136,182 4,908 2,986 4,185 6,132 4,112 3,618 13,438 912,603 20,280
Fig. 4.
Vertices 707,623 21,365 13,424 20,917 41,075 45,495 5,561 43,975 4,754,735 564,677 188,856 8,949,186 52,132 69,791 1,071,321 26,734 157,828 38,033 49,580 55,161 72,906 26,886 36,023 56,265 396,010 144,299 289,758 23,558 1,031,873 1,853,231 285,464 27,494 27,415 1,406 1,398,832 2,140,672 26,841 1,713,251 10,382 90,135 4,943 71,856 8,291 5,247 140,084 26,760,591 594,680
Edges 1,488,328 41,795 35,919 65,084 80,410 122,792 13,311 128,116 13,010,556 1,821,811 405,383 28,033,287 104,252 108,470 2,122,627 56,068 420,576 174,162 105,954 234,024 138,630 96,316 104,711 165,933 1,087,038 321,015 822,198 107,446 3,290,889 8,334,948 1,160,625 76,085 75,901 2,177 10,148,436 4,673,668 74,690 6,070,256 23,866 365,467 12,315 192,649 17,095 12,015 382,603 86,329,897 1,918,442
Slices 58,281 7,250 3,909 5,133 10,151 15,672 1,085 4,686 49,027 43,044 20,578 103,265 17,092 16,533 120,246 12,492 29,362 14,445 11,104 14,114 25,018 7,460 9,556 15,069 68,298 35,863 24,029 6,748 13,691 106,828 40,199 11,812 11,745 867 47,344 79,178 11,277 212,621 3,113 12,076 1,044 12,517 2,421 1,163 20,889 1,338,295 29,740
Brief Description ASCII to Postscript Process monitoring utilities Barcode generator Calculator Parser Generator Protocol toolbox File Compressor ESA signal processing code file construction tool C ADT library C tagging Revision Control File differencing Line text editor Conquest Game Wavelet image encoder Logic simplification for CAD File finding utilities Lexical Analyzer Builder Lexical Analyzer Builder File Transfer GCC’s pre processor Gnu Backgammon Chess player Go player Go player JPEG compressor Text formatter XLisp interpreter DNS lookup Time Daemon Antennae array set-up ESA array pre-processor Regular expression mail processor neural network analyzer ESA ADL interpreter Digital circuit simulator Unix terminal emulation Forth Environment CPU resource measure Access control utility Diff front end Unix utility Pointer Analysis hline
The 45 subject programs studied.
ACM Transactions on Programming Languages and Systems, Vol. V, No. N, February 2009.
Dependence Clusters in Source Code
Fig. 5.
·
15
Agreement Levels down to 99% Similarity
intersection) is x% of the total number of nodes (i.e., the nodes in either slice (the union)); thus, it is possible to speak of slices being ‘similar up to a certain point.’ For a given value of similarity, x%, an agreement of y% means that y% of the total number of slices are x% similar. The figure shows the minimum, average, and maximum agreement starting at the far right with 100% similarity (i.e., equal slices). As can be seen in the figure, almost total agreement is reached for most programs with a very high similarity: the horizontal axis only goes down to 99% similarity, so all the data shown in Figure 5 concern slices within 1% of containing identical nodes. Along the y-axis (i.e., 100% similarity) agreement ranges from 16% to 99%; thus, that same size equals same slice is not unanimous when zero difference is permitted. However, requiring the vertices in the slices to agree by ‘only’ 99.98%, this range shrinks to 40% to 100% and by 99.9% it shrinks to 76% to 100%. Perhaps of more interest in how quickly the average line crosses the 99% threshold: by 99.55% (within less than one half of one percent of an exact match). Thus, from Figure 5, it is clear that same size is a good proxy for same slice. ACM Transactions on Programming Languages and Systems, Vol. V, No. N, February 2009.
16
·
Mark Harman et al.
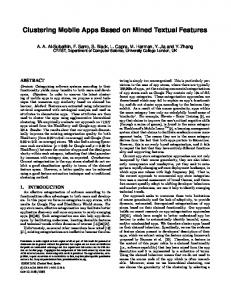
In total, 99.5% of the clusters are represented on this graph. That is, 99.5% of clusters are within 1% of total agreement. If the figure were to be redrawn, with a horizontal axis extended all the way down to 0%, then the detail would be completely lost, because almost all programs would immediately reach 100% agreement on the vertical axis. Of course, there are a few programs where some slices simply happen to be the same size, but contain completely different sets of nodes. This should be expected in any suitably large data set. To get a sense for just how common this occurrence is, consider the data presented in Figure 6. This figure shows all the data for which a similarity of less than 99% is required for 100% agreement. The horizontal axis shows each of the thirty six programs studied. The vertical axis shows the percentage of same-size slices that are less than 99% similar. As the figure shows, for over a third of the programs, there are simply no slices of the same size that require less than 99% similarity to agree 100%. Over all thirty six programs studied, only 0.58% of the clusters required a similarity of less than 99% in order to achieve 100% agreement. Furthermore, even this low figure of 0.58% is perhaps unduly pessimistic because it records the number of clusters which require less than 99% similarity. However, even in such clusters, many of the individual slices in the cluster, may fully agree. The figure for the number of pairwise slice comparisons which fail to agree within 99% similarity is only 0.00572%. These results provide strong evidence for the claim that ‘slice size agreement’ is a good approximation for ‘slice content agreement’ and thus for locating dependence clusters using MSGs. 5.
EMPIRICAL VALIDATION: DO LARGE DEPENDENCE CLUSTERS OCCUR IN PRACTICE?
This section considers the validation question—first visually and then quantitatively. Two visualizations are used: first the MSG and second size-distribution graphs. To begin with, Figures 7, 8, 9, 10, and 11 show the MSGs of the 45 proACM Transactions on Programming Languages and Systems, Vol. V, No. N, February 2009.
Dependence Clusters in Source Code
Fig. 6.
·
17
Sparsity of high tolerance
grams studied. The MSGs were visually categorized according to whether or not they appear to contain no clusters (and thus a line sloping up to the right), large clusters, or enormous clusters (the latter deemed to be those occupying 70% or more of the program). Figure 7 shows the ten MSGs for programs that essentially contain no large clusters. These programs show, at most, small ‘cliff drops’ in the landscape of their MSG. In contrast, most of the programs studied were found to contain large dependence clusters. Some were so large that they suggest possibly severe problems for continued software evolution. Figures 8 and 9 show the MSGs for the middle category of programs; they contain visual evidence of large clusters. Finally, Figures 10 and 11 show the MSGs of eighteen programs where these clusters were particularly pronounced. Visually, the MSGs help to assist human identification of large dependence clusters: compare the relatively smooth landscapes of the MSGs in Figure 7 to those in Figures 8 and 9 or for a more dramatic difference, those in Figure 10 and 11 (which clearly show large, tell-tale, cliff faces). ACM Transactions on Programming Languages and Systems, Vol. V, No. N, February 2009.
18
·
Mark Harman et al.
Fig. 7. MSGs for programs with an absence of large dependence clusters (no cliff faces in the MSGs). The second visualization bands together slice sizes into 10% wide bands to reduce visual clutter. Figures 12, 13, and 14 show cluster sizes (expressed on the vertical axis as a percentage of program size (to facilitate comparison). The plane of each chart summarizes slice sizes (again as a percentage) for each program. Figure 12 shows programs with an absence of dependence clusters (parallel to the MSGs from Figure 7). For example in Figure 12, the tallest bar for csurf-packages shows that approximately one third of the clusters involve slices of size 41% to 50% of the program. ACM Transactions on Programming Languages and Systems, Vol. V, No. N, February 2009.
Dependence Clusters in Source Code
·
19
Fig. 8. Set 1 of MSGs for programs with large dependence clusters (denoted by cliff faces in the MSGs). Figure 13 shows the programs with large dependence clusters. As can be seen, the presence of these clusters is manifested by the presence of large bars for the higher values of slice size. Compared to Figure 12, the distribution is more polarized into the extremes of large and small sizes. This trend toward polarization of slice sizes is even more strikingly evident in Figure 14, which depicts the distribution of slice sizes for programs with enormous clusters. In this figure, it is very clear that the programs’ slice sizes are almost entirely bi-modal with comparatively few small and a majority of large slices. ACM Transactions on Programming Languages and Systems, Vol. V, No. N, February 2009.
20
·
Mark Harman et al.
Fig. 9. Set 2 of MSGs for programs with large dependence clusters (denoted by cliff faces in the MSGs).
Having seen the visual evidence for the existence of dependence clusters, the next step is the examination of the question as to whether there is a high prevalence of large clusters in real programs. To address this question it is necessary to consider what precisely constitutes ‘large’. Earlier work [Binkley and Harman 2005b] arbitrarily set a threshold of 10%. That is, should 10% of a program be found to lie inside a single cluster, then this cluster was deemed to be ‘large’. In this paper, a more elaborate approach is adopted, which allows the reader to make a choice as to what a reasonable threshold should be, and to examine the impact of this choice on the outcome of the question
ACM Transactions on Programming Languages and Systems, Vol. V, No. N, February 2009.
Dependence Clusters in Source Code
Fig. 10.
·
21
Set 1 of MSGs of programs with enormous dependence clusters.
“How many programs studied contain large clusters?”
Figure 15 shows a count of programs with large dependence clusters for various largeness thresholds. For example, at the extremes a threshold of zero causes all 45 program to include a cluster, while none of the programs include a clusters that consumes 100% of the program. Setting the threshold for largeness at 10% all but 5 of the 45 programs have large dependence clusters. While the choice of ‘largeness threshold’ is arbitrary, it would seem that a cluster that consumed 10% of the program would be worth investigation and so would be sufficiently large to appear ACM Transactions on Programming Languages and Systems, Vol. V, No. N, February 2009.
22
·
Mark Harman et al.
Fig. 11.
Set 2 of MSGs of programs with enormous dependence clusters.
on the ‘investigation radar’ of many programmers. Furthermore, at the quartile points 24, 18, and 4 programs include at least one cluster of at least 25%, 50%, and 75% of the code in the program. It is clear from this data that for any reasonable definition of large, there is a considerable number of programs that contain large clusters. Furthermore, some of these clusters are enormous relative to the size of the program. This result has far-reaching implications for analysis techniques that rely upon program dependence analysis. The data in Figure 15 takes a rather strict view on the slices that potentially form a cluster: it requires that slice size match exactly. A common pattern found in the source code studied involves overlapping slices of similar size. For example, consider the statement if (i > 10) within the loop for(i=0; i