A Probabilistic Context-Aware Approach for Quality of Experience Measurement in Pervasive Systems Karan Mitra†‡
Arkady Zaslavsky‡†
Christer Åhlund
Center for Distributed Systems and Software Engineering† Monash University 900 Dandenong Road, Caulfield East Victoria, Australia, 3145
Computer Science and Electrical Engineering‡ Luleå University of Technology SE-97187, Luleå Sweden
Division of Mobile Networking and Computing SE-93187, Skellefteå Sweden
[email protected]
[email protected]
ABSTRACT
what users think and perceive about the services being provided to them in terms of new products and applications [7, 1]. For example, telecommunication companies want to understand how to minimise network churn by providing better service to the users. Network engineers want to understand the network conditions under which users perceive good or bad network services. Thus, there is a need to understand and develop methods that can capture QoE of applications, network technologies and services provided by these stakeholders. Significant work has been done to understand and optimise network QoS in both wired and wireless network systems. It is widely assumed that by optimising network QoS, users will be satisfied with services provided to them [14]. However, this is not the case. Providing objective QoS may not correlate with the subjective QoS [7][9][14]. This is also evident by the research conducted by several ITU-T study groups (SGs) such as SG-12 which are studying applications like VoIP and IPTV. In their standards for example,the ITUT P.800 [3] and the ITU-T G.107 [5] subjective tests are conducted to develop quantitative methods such as the ITU-T E-Model [5]. However, these methods only consider QoS metrics such as packet loss, delay and bandwidth. As in [8][1][14], we also argue that QoE is not just related to QoS. It is a broader construct that encompasses user related facts such as his/her behavioural, cognitive and psychological states along-with the context in which the products and services are provided to the user. This is particularly true in mobile computing environments where users’ behavior is dynamic since they use applications in different scenarios and social contexts. For example, users’ QoE might differ when they are at home as they can be more relaxed and can easily assimilate information presented to them. On the contrary, their QoE might be different when they are busy in their office as stress and mental workload can affect their overall QoE. Table 1 shows several parameters related to QoS, the device and the user environment which affect overall QoE of the user. Studying these parameters together and understanding their affects on each other is a highly complex task [14][6][9][1] as there can be hidden inter-dependencies and non-linear relationships. Recently in [8][9][14][7], authors have tried to define, classify and build models to determine QoE of the user. QoE is a personal representation of what a user thinks and perceives about the service/application/tool. It is important to under-
In this paper, we develop a novel context-aware approach for quality of experience (QoE) modeling, reasoning and inferencing in mobile and pervasive computing environments. The proposed model is based upon a state-space approach and Bayesian networks for QoE modeling and reasoning. We further extend this context model to incorporate influence diagrams for efficient QoE inferencing. Our approach accommodates user, device and quality of service (QoS) related context parameters to determine the overall QoE of the user. This helps in user-related media, network and device adaptation. We perform experimentation to validate the proposed approach and the results verify its modeling and inferencing capabilities.
Categories and Subject Descriptors H.4 [Information Systems Applications]: Miscellaneous
General Terms Algorithms, Design, Human Factors
Keywords Bayesian networks, context-awareness, influence diagrams, quality of experience (QoE), quality of service (QoS)
1.
[email protected]
INTRODUCTION
In mobile and pervasive computing environments understanding user-perceived QoE is an important and a challenging task [7][9][6][14]. This can be attributed to the fact that QoE about a particular technology, network service or application depends on user expectations, as well as his/her cognitive, psychological and behavioural aspects [14]. There are several stakeholders who are interested in understanding
Permission to make digital or hard copies of all or part of this work for personal or classroom use is granted without fee provided that copies are not made or distributed for profit or commercial advantage and that copies bear this notice and the full citation on the first page. To copy otherwise, to republish, to post on servers or to redistribute to lists, requires prior specific permission and/or a fee. SAC’11 21-March-2011, TaiChung, Taiwan. Copyright 2011 ACM 978-1-4503-0113-8/11/03 ...$10.00.
419
Table 1: Table showing several QoE classes and context parameters related to QoE, device and user that needs to be considered when modeling user’s QoE. QoE Context Parameters Classes QoE parameters Tool/Device/Object User and Environment QoS Cognitive attention, enjoyment, screen size, design location, bandwidth, concentration, satisfaction layout, resolution, temperature, delay, Behavioural technology acceptance general intuitiveness, social context, jitter, efficiency, speed, accuracy, buttons placement, people standing nearby, packet loss, perceived ease-of-use I/O methods, appeal light, background loss burst size Psychological emotional status, moods usability noise
stand which parameters are required to model, reason and infer QoE. Formally, we define QoE as “a multi-faceted phenomenon that depends on a person’s likes/dislikes towards a particular object or service where his/her likes/dislikes are defined by his/her personal attributes related to behavior, cognitive abilities, objects’ attributes, the underlying QoS and the environment surrounding that person”. From the state-of-the-art we gather that a unifying framework to model, reason and infer QoE is missing. Also, techniques that can simultaneously handle user-centric context, subjective and objective assessment metrics are required. In this paper, our objective is to develop and present context-aware techniques for QoE modeling, reasoning and inferencing. In particular, 1.) we propose a context-aware model for QoE modeling and reasoning based on a state space approach and Bayesian networks; and 2.) we present a method to infer QoE based on influence diagrams. The proposed methodology is flexible as it is independent of any application and QoE assessment methodologies (subjective or objective). It can accommodate several parameters and factors which can be added and removed dynamically. Stakeholders such as network engineers or application designers only need to consider the causal relationships between parameters. The proposed model will then be able to reason QoE efficiently. This is useful in creating service level agreements (SLA), performing network optimisations and providing value-added services to the user. Thus, in this paper we pioneer an approach to integrate context-awareness and probabilistic reasoning to model and reason QoE in an efficient manner. In section 2, we present the related work. In Section 3 we formulate the research problem. Section 4 presents our proposed context-aware model for QoE modeling, reasoning and inferencing. Section 5 presents the results evaluation and finally, section 6 presents conclusion and future work.
2.
ships. Brooks and Hestnes [7] stress the need to consider a combination of subjective and objective methods to determine QoE. Therefore, we state that a unified framework for QoE modeling and reasoning is required. Such a framework should handle user’s state, context and preferences to infer his/her QoE. Thus, in this paper we develop and present a novel context-aware approach for QoE modeling, reasoning and inferencing.
3.
MOTIVATING SCENARIO AND PROBLEM FORMULATION
Mark uses a VoIP application on his WiFi and 3G capable mobile phone (MN) while travelling from home to office. While he is travelling, he experiences variation in the call quality. This can be attributed to the environmental context parameters such as background noise on the road, people speaking loudly in the tram, wireless signal variation and handoffs between the networks. These factors along with his behavioural, psychological and cognitive abilities affects his QoE in a complex manner even though QoS may or may not vary. Thus, we need to develop models that can incorporate aforementioned parameters in a generic manner to understand why and under what scenarios his QoE is affected. These parameters when modeled and inferred correctly can in-turn assist Mark’s MN to adapt based on his personalised QoE. For example, his MN can increase the volume of speakers; it can adapt to a new codec or a network or it might altogether transfer a session to a new device based on his personal profile. The next section presents our generic, probabilistic and context-aware framework to model, reason and infer QoE.
4.
CONTEXT-AWARE QOE MODELING, REASONING AND INFERENCING
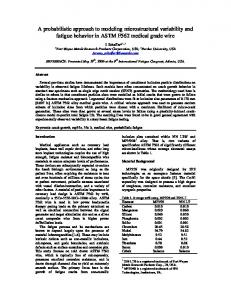
Figure 1 shows our proposed approach for modeling, reasoning and inferring QoE. We mainly focus on the dotted box in this paper. Firstly, context information such as location and bandwidth is collected from the network, user, device and the surrounding environment. This context information is then represented as a set of vectors which are then modeled using the Context Spaces Model (CSM) [10] and Bayesian networks (BNs) [11]. Using BNs, we define causal mappings of context parameters with the QoE classes such as cognitive (user satisfaction) and behavioral (technology acceptance) as shown in figure 2. Once the QoE classes are inferred probabilistically, they are then assigned utilities. Thus, our BN model is extended to an influence diagram [11]. Using probability and utility theory, we can fuse multiple QoE related classes to determine a single utility
RELATED WORK
Recently Sung [12], developed algorithms and architectures for QoE reasoning and adaptation. However, his approach was limited to mobile video applications. Wu et al. [14] define and classify the QoE related parameters and try to find the correlation between the QoE and QoS related classes. This approach can be impractical when there are several QoE and QoS parameters as finding correlations between each and every parameter is a complex task. Furthermore, they do not consider user and device related context parameters. Moller et al. [8], provides a taxonomy based on which application designers can select relevant QoE and QoS parameters to build multimedia applications. However, they do not present methods for modeling QoS and QoE relation-
420
Figure 2: Influence diagram showing the mapping of QoS and environmental context parameters onto QoE.
Figure 1: A context-aware approach for QoE modeling,reasoning and inferencing.
function which is the overall QoE. This is a highly desirable property and in in-line with the ETSI standard [1] for QoE measurement.
4.1
Context Modeling using Context Spaces Theory
For modeling context information we use the Context Spaces Model (CSM) [10]. CSM is used to infer and determine situations from raw context information collected from sensors such as GPS and QoS probes. There are three important concepts in CSM i.e., context attributes, context states and the situation space. A context attribute, ati is the data that is used to infer a situation. For example, delay, jitter and packet loss. A context state is the current state of the application at time t. It contains a number of context attributes to represent the state of the application. It is represented as Sit = (ati , . . . , atn ). For example, consider a VoIP application experiencing the delay of 20ms and 0% packet loss. The resultant mean opinion score calculated using the E–Model [5] would be above 4. Thus, the context state, user satisfact ) is “very good”. If the application is used by the tion (SSA user at his/her home another context attribute, location ( atlocation ) is added to infer the same context state. Finally, a situation space represents a real-life situation. It is a collection of regions of attribute values corresponding to the predefined situation. It is denoted by a vector space Ri = R R (aR 1 , . . . , an ) where an acceptable region, an , is defined by the set of variables V which satisfies the predicate P i.e., aR n = {V|P(V)}. Considering the aforementioned context states, the overall situation would be “user is in his home and his QoE is very good”.
4.2
Context-Aware Data Fusion using Influence Diagrams
Instead of finding correlation between QoE and QoS parameters as in [14], we use a probabilistic framework based on influence diagrams [11] to infer QoE. Thus, we can capture the uncertainty about user’s choices and decisions regarding QoE in an efficient and an unbiased manner. Probabilistic frameworks such as BNs and influence diagrams are useful: 1.) they allow context and situation representation in a hierarchical form which is a highly desirable property for situation reasoning; 2.) new context parameters/attributes
421
can be added and removed dynamically and these models can infer the situation state; 3.) these frameworks can help in dealing with uncertainty and missing information; 4.) with the use of learning mechanisms in BNs, context and situations can be predicted at run-time with higher confidence; and 5.) these frameworks are space and time efficient. By exploiting these properties, network engineers and telecom operators can develop policies and utilities for users through which user devices can optimally adapt to a new codec or under network conditions. Based on [8], a BN is a directed acyclic graph (DAG) where random variables form the nodes of a network. The directed links between the nodes form the causal relationships. The direction of a link from X to Y means that X is the parent of Y. Any entry in the network can be calculated using the joint probability distribution (JPD) denoted as: P (xi , . . . , xn )
n Y
P (xi |P arents(Xi ))
(1)
i=1
Where, Parents (Xi ) , is the parent of xi . Figure 2 shows our BN. At the lowest level we collect the context information such as bandwidth (atbandwidth ) and location (atlocation ). At the intermediate level context states such as technology t ) are inferred. acceptance (STt A ) and user satisfaction (SSA These states are hidden. Finally, the top-most state is the situation state or the goal state (RQoE ) which determines the overall QoE situation of the user. As shown in figure 2, we extended the BN to influence diagram where a utility (diamond) and decision (rectangle) nodes are added. Decision nodes have a finite set of mutually exclusive states. In our t case it represents the states of SSA , STt A and RQoE on the scale of 1 to 5. Where 1 is “poor” and 5 means “Excellent”. As mentioned in the previous section, there can be n QoE related parameters belonging to different QoE classes such as cognitive, behavioural and psychological. Thus, it is important to classify, measure and map these parameters onto an objective function based on the requirements of the user or the service provider. We need to define a global utility function which can encompass in a generic way, the QoE parameters. There is also a need to define the range of each parameter related to QoE, QoS and the user and his/her device environment. In this paper, the parameters are ranked on Likert-like
5 point scale. This is also recommended by Nokia [6] and Telenor [3]. Once the hidden context states such as STt A t and SSA are probabilistically inferred after observing the underlying context parameters such as atbandwidth , atdelay and atlocation , they are then mapped onto their respective utility t functions U(SSA ) and U(STt A ) as in e.q 2. Where, hn is the hypothesis and e is the evidence variable. P (•) represents the belief of the agent in a hypothesis and U (•) encodes the preference on the numerical scale. In order to decide the context state (Sit ), the agent chooses the decision alternative which gives the maximum expected utility (MEU) as: MEU (Sit ) = maxsti ∈Sit
X
P (hn |e)U (sti , hn )
Table 2: Selected context attributes and ranges. Context attributes values (range) codec ITU-T G.711, ITU-T G.729 packet loss low (0%-5%), medium (5%-7%), high (7%-10%) delay low (0 ms-150 ms, medium(150 ms - 300 ms), high (>300 ms) location home, train station, office
(2)
n
These context states are then fused together to determine the overall situation of QoE (RQoE ) of the user which is a global utility. In [13], a global utility was defined as a linear summation of cognitive effectiveness, emotional effectiveness, mental workload and price. For the scope of this paper, we also consider a global utility which comprises of several QoE related classes such as cognitive (user satisfaction in terms of the MOS) and behavioural (technology acceptance). Each context state can contribute to the utility differently. Thus, we can assign weights to these states t which sum to 1. It can be written as MEU(Sit , Si+1 ). Based on the calculated RQoE , we can easily determine whether the overall QoE is “Poor”, “Fair”, “Good”, “Very good” or t ) can be written as: “Excellent”. MEU(Sit , Si+1 t MEU (Sit , Si+1 )=
X
max
t sti ∈Sit ,sti+1 ∈Si+1
P (hi , hi+1 )
hi ∈Hi ,hi+1 ∈Hi+1 ,
U (sti , hi ) + U (sti+1 , hi+1 ))
5.
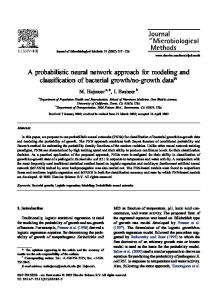
Figure 3: Performance of ITU-T G.711 and ITU-T G.729 codecs under different packet losses and delay.
(3)
RESULTS EVALUATION
For results analysis, we developed a prototype using the GeNIe 2.0 platform [2] which is a widely used tool for modeling and building BNs. We conducted several experiments to validate the decision making capability of the proposed model. For evaluations, we considered a VoIP application. However, any other application can be used in general such as IPTV and web browser. From the above discussion we can gather that there can be complex and inter-dependent relationships between several parameters. These relationships are very difficult determine analytically or mathematically [7][9]. In this section, we derive such relationships between two different QoE classes (user satisfaction and technology acceptance) and several context parameters as shown in table 1 and 2. We argue that our model is flexible and can encompass any QoE classes and context parameters. We validate this hypothesis by using the ITU-T E-Model [5] as a plug-in to determine the user satisfaction. In case of technology acceptance, we set the variables in relation to the user satisfaction by using the intuition that if a user is satisfied, he/she is more likely to accept the technology. Figure 3 shows the motivation behind selecting particular values and ranges for codecs, packet loss and delay. This figure was derived from the ITU-T G.107 [5] and ITU-T G.113 [4] standards in relation to ITU-T G.711 (shown as solid lines) and ITU-T G.729 codecs (shown as dashed lines). We can observe that ITU-T G.711 codec performs better at 0% packet loss than the ITU-T G.729 codec but over-
422
all, ITU-T G.729 codec performs significantly better even in case of low to medium packet loss and delay as compared to ITU-T G.711 codec. This is also true for the cases when medium to high packet loss and delay are observed by the MN. For both codecs, bends around medium delay suggests that MOS further degrades rapidly from this point onwards due to increase in delay. Based on these observations, we set the conditional probability tables (CPTs). We further manipulated the CPTs to include the effects of location on the overall QoE based on the fact that user social context changes at different locations [1][6]. For example, we expect a user to be more comfortable at home rather than his/her office due to stress or background noise which might affect his/her QoE. This is reflected by assigning higher probability to home followed by tram stop and the office to maximize the overall QoE. For the sake of brevity, we do not show the CPTs in this paper. We define two context states for two QoE parameters i.e., t user satisfaction (SSA ) and technology acceptance (STt A ). These states are fused together to determine the overall QoE (RQoE ) of a user as mentioned in section 4.2. We assigned equal weights of 0.50 to each states. Higher the MEU, higher the RQoE of the user on the scale of 1-5. By using the JPD as in e.q. 1 and exact algorithm such as clustering [8] we can find the probability of context states taking several values. These values can help to understand the hypothesis such as “user’s satisfaction is fair” or “he/she is not willing to accept the technology”. In this case, it can be derived by setting the evidence variables such as P(user satisfaction=“excellent”|location=“home”,delay=“low”, packet loss= “low”). For the scope of this paper, we present ten such such cases where we show capabilities of the proposed model. Consider experiment 1 (shown in table 3) where a user
Table 3: resultant shown. Exp. No. 1.
Observed context parameters and values. utilities calculated by our model are also Codec
PL
Delay
Location
G.729
low
low
home
2.
G.729
medium medium home
3.
G.729
high
high
tramstop
4.
G.711
low
low
home
5.
G.711
low
low
tramstop
6. 7. 8.
G.711 G.711 G.729
medium medium home high high tramstop low low tramstop
QoE (Utility) VeryGood (64) Good (42) Poor (4.88) Excellent (90) Excellent (45) Fair (15) Poor (5) VeryGood (42)
uses a VoIP application at different locations at different social contexts. His VoIP application randomly negotiates the codecs with its peer. In this case, based on the conditional probabilities assigned to the BN, the model calculated t and STt A . It calculated the probprobabilities for both SSA ability for each parameter taking on values as “excellent” and “very good” as 0.20 and 0.80, respectively i.e., more confidence in getting “Very Good” under these conditions. Finally, our model calculated utility value of 64 for RQoE = “Very Good”. For RQoE = “Excellent” it was 20. It’s worth mentioning that prior utilities assigned for both QoE parameters for “Excellent” and “Very Good” were 100 and 80. “Good”, “Fair” and “Poor” were assigned 60, 30 and 5, respectively. This shows that the model can correctly infer the QoE classes based on the observations in figure 3. Furthermore, our model also calculated the overall QoE (RQoE ) correctly. Thus from this result we can conclude that the overall QoE is “Very Good” on the scale of 1-5. From context fusion, the situation is determined as “the user’s satisfaction from the VoIP session is Very Good and he/she is willing to adapt to this technology under given evidence that the QoS was highest and he/she was at home”. Consider experiment 4, where the evidence is kept fixed as in experiment 1, our model calculated the probabilities for t both SSA and STt A as 0.90 (excellent) and 0.10 (very good). The RQoE was 90 for “Excellent”. This is validated by the fact that ITU-T G.711 codec performs slightly better than the ITU-T G.729 codec when the underlying QoS is high and when the user is at home as shown in figure 3 and table 2. For experiment 5, we consider a scenario where a user uses the VoIP application at the tram stop. The QoS levels are similar to experiment 4 but the overall QoE varies. The aim of this experiment is to show that even though the QoS levels can remain similar, the overall QoE can differ which we model as a spatio-temporal phenomena. This also depends on user’s cognitive and behavioural abilities that can vary based on the context of his/her usage scenarios or stress levels [14, 13, 12]. To validate this case, we kept the evidence same as in experiment 4 except for location which was changed to “tram stop”. We also removed the arc from
parent (location) to child (user satisfaction) to denote that PQoS calculated by the E-Model can remain same but the technology acceptance can vary based on the usage scenario and context. In this case, our model calculated the probabilities of 0.90 for “excellent” and 0.10 for “very good” for t SSA . For STt A it calculated the probabilities of 0.25, 0.50 and 0.25 for “very good”, “good” and “fair” , respectively. In all, RQoE was “Excellent” with the utility value of 45. As can be observed, even though the QoE determined is “Excellent” but the utility is quite low as compared to experiment 4. Similarly, we conducted several other experiments such as 6 to 8 to evaluate our proposed model which are not further discussed in this paper due to lack of space.
5.1
Learning QoE in Pervasive Computing Environments
In our model, we also incorporated learning mechanisms so that a device can learn the probabilities over-time when a user interacts with the system using a GUI. After the system has learnt and has reached the steady state, it can predict QoE with greater confidence. The aim of such experiments was to show that QoE evolves over-time and by evaluating it at different times and locations, our model can gather enough evidence that can capture the QoE of user based on his/her contextual, behavioural and cognitive abilities. It can thus help in providing personalised services such as selecting a proper codec or by selecting a network interface which provides QoE based on user’s expectations. To validate this hypothesis, we generated more data based on the cases mentioned in table 2 to cross-validate whether learning can capture the QoE by gathering more evidence. We trained our model at 5, 10, 20, 30, 60, 90 and 180 iterations emulating the feedback provided by the user. We also tried with more iterations but we achieved similar results. To account for bias and artifacts, randomization was done. We considered two cases where data generated for experiment 2 and 4. For learning the network parameters we used expectation maximization (EM) [11] algorithm. In case of experiment 2, at iterations (data set) 5, 10, 15, 20 there is not much effect on the QoE utility value compared to the baseline model with no training (0 iterations). From 30 iterations and beyond we observed an increase in the utility value by approximately 5 (from nearly 75 to 80) which remains constant throughout for even 60-180 iterations. From this observation it can be gathered that the network reached a steady state quickly in just 30 iterations and after that confidence does not vary much and hovers t mainly around “very good” in both SSA and STt A . Based on our data, in case of experiment 4, learning does not help much as we didn’t see a marked fluctuations in the utility values. In a more dynamic network and user conditions and by adding more context parameters, we believe more variations on the utilities can be captured and is left for further research.
5.2
Discussion
Experimental analysis shows that our model can efficiently model and infer QoE of the user based on several context parameters. In the proposed model, context states can be added and deleted as per application’s, network vendor’s and the user’s requirements. Once the overall context states are inferred, it can automatically determine overall QoE of a user. This is achieved by fusing these states probabilistically
423
and by assigning appropriate utilities to the context states to calculate the overall global utility which determines the overall QoE. Our network can also learn the probabilities to predict with certain confidence the value of QoE which can change over-time. We are currently investigating the inclusion of more context parameters for the learning case. It would be interesting to see what performance bounds can be set for real-time applications such as VoIP and IPTV in the case when learning is used.
6.
[4] ITU-T Recommendation G.113 - Appendix I: Provisional planning values for the equipment impairment factor Ie, 1998. [5] ITU-T Recommendation G.107, Methods for subjective determination of transmission quality, 2008. [6] B. Brooks, P. Hestnes, and Heiestad. Qoe ( quality of experience) - measuring qoe for improving the usage of telecommunications services. Technical report, 2006. [7] P. Brooks and B. Hestnes. User measures of quality of experience: why being objective and quantitative is important. Network, IEEE, 24(2):8–13, march-april 2010. [8] S. Moller, K.-P. Engelbrecht, C. Kuhnel, I. Wechsung, and B. Weiss. A taxonomy of quality of service and quality of experience of multimodal human-machine interaction. In Quality of Multimedia Experience, 2009. QoMEx 2009. International Workshop on, pages 7–12, 29-31 2009. [9] Nokia. Quality of Experience (QoE) of mobile services: can it be measured and improved?, 2006. [10] A. Padovitz, S. Loke, A. Zaslavsky, B. Burg, and C. Bartolini. An approach to data fusion for context awareness. In Fifth International Conference on Modelling and Using Context, CONTEXT’05, pages 353–367. Springer, 2005. [11] S. Russell and P. Norvig. Artificial intelligence: A modern approach. 2003. [12] J. Sung. Football on Mobile Phones: Algorithms, Architectures and quality of experience in streaming video. PhD thesis, Umea University, 2006. [13] W. K. W. Greger. Determining utility functions for streaming low bitrate football video. In Ninth International Conference on Internet and Multimedia Systems and Applications, 2005. [14] W. Wu, A. Arefin, R. Rivas, K. Nahrstedt, R. Sheppard, and Z. Yang. Quality of experience in distributed interactive multimedia environments: toward a theoretical framework. In MM ’09: Proceedings of the seventeen ACM international conference on Multimedia, pages 481–490, New York, NY, USA, 2009. ACM.
CONCLUSION
In this paper, we present a novel context-aware approach for Quality of Experience (QoE) modeling, reasoning and inferencing. Our proposed model is flexible to leverage underlying QoS, QoE classes and context parameters to efficiently infer the overall QoE. For context modeling we extended the Context Space Model using Bayesian networks and influence diagrams to probabilistically determine QoE of the user. The proposed model can help several stakeholders to understand relationships between QoS and QoE classes and give them a tool to efficiently model and infer the QoE. Thus, it can enable them to provide personalised services to the user not only based on QoS but also based on their expectations and experiences. We further extended this approach to incorporate learning mechanisms to predict the QoE at run-time. In future, we intend to extend this model to further incorporate sequential decision making and provide a publicly available open-source API.
7.
REFERENCES
[1] ETSI STF 354 - Guidelines and tutorials for improving the user experience of real-time communication services. [2] Genie software package, http://genie.sis.pitt.edu/about.html, [online] access date: 02/03/10. [3] ITU-T Recommendation P.800 - Methods for subjective determination of transmission quality, 1996.
424