332
lbargiiengoytia, Sucar, and Vadera
A PROBABILISTIC MODEL FOR SENSOR VALIDATION
L.E. Sucar
S. Vadera
Institute de Investigaciones
Institute Tecnologico y de
University of Salford
P.H. lbargiiengoytia Electricas, A.P. 1-475
Estudios Superiores de Monterrey
Dept. of Mathematics
Cuernavaca, Mor., 62001, Mexico
Campus Morelos, A.P. 99-C
and Computer Science
[email protected]
Cuernavaca, Mor., 62050, Mexico
Salford, M5 4WT, U.K.
[email protected]
[email protected]. uk
Abstract
considered as general, the specific application is in the power plants domain.
The validation of data from sensors has be come an important issue in the operation and control of modern industrial plants. One ap proach is to use know ledge based techniques
The approach proposed in this paper has two layers: •
pected values of the sensors and identify
to detect inconsistencies in measured data. the detection of such inconsistencies. Based able to find the existence of a possible fault
potential
faults;
This article presents a probabilistic model for on probability propagation, this method is
a prediction layer: which is used to predict the ex
•
a constraint satisfaction layer:
which is used to
distinguish the faulty sensor(s) from the appar ently faulty ones.
among the set of sensors. That is, if an er
apparent
Both layers make use of a probabilistic network model.
fault due to the propagation from the sen:.
A probabilistic or Bayesian network [Pearl, 1988] is a
sor(s) with a real fault. So the fault detection
directed acyclic graph (DAG) whose structure corre
ror exists, many sensors present an
mechanism can only tell if a sensor has a
po
tentwl fault, but it can not tell if the fault is
sponds to the dependency relations of the set of vari ables represented in the network (nodes), and which is
real or apparent. So the central problem is to
parameterized by the conditional probabilities (links)
develop a theory, and then an algorithm, for
required to specify the underlying distribution. In this
distinguishing real and apparent faults, given
case, the nodes correspond to the sensors that consti
that one or more sensors can fail at the same
tute the model. The structure of the network makes
time. This article then, presents an approach
explicit the dependence and independence relations
based on two levels: (i) probabilistic reason
between the variables.
ing, to detect a potential fault, and (ii) con straint management, to distinguish the real fault from the apparent. ones. The proposed approach is exemplified by applying it to a
In this approach, with the use of probability propaga tion, a prediction is made of a variable's value based on other parameters.
If this predicated value devi
power plant model.
ates from the actual value given by a sensor, by some predefined margin, then some fault can be assumed.
INTRODUCTION
sensor has a
But the fault detection mechanism can only tell if a
1
Computing is playing an increasingly important role in domains like communications, medicine, and industry. Examples of industrial applications include the control of advanced manufacturing plants, power generation, power distribution, and chemical processes. These ap plications require the utilization of several method ologies that have emerged from the area of artificial intelligence (AI). In general, AI methods are moving towards more realistic domains that require coopera tion between several fields of research. This paper de
potential fault, but it can not tell if the
fault is real or apparent. The central problem is to de velop a theory, and then an algorithm, for distinguish ing real and apparent faults, considering that one or more sensors can fail at the same time. For this, the structure of the model is considered, which produces a set of constraints that has to be solved to determine the faulty sensor( s). This article then, presents an ap proach based in two levels: (i) probability propagation, to detect a potential fault, and (ii) constraint manage ment, to distinguish the real faulty from the apparent ones.
of AI methods to solve the problem of sensor valida
The paper is organized as follows. Section 2 in troduces the problem and summarizes previous ap
tion. Although the techniques presented here can be
proaches.
scribes an ongoing research project in the utilization
Section
:3 presents the approach with the
A Probabilistic Model for Sensor Validation
Section 4 presents the ideas Section 5 describes a real example that shows
ports a fa ulty sensor, it is impossible to define which
the
perature sensor fails and it is uti li zed to d e tect a fault
aid of a simple example. formally.
the complete
technique. Finally, section 6 presents
conclusions and future work.
sensor was the faulty one. In t his example , if the tern
in the velocity, the system will certainly report a fail ure on the velocity reading.
2
333
This could be a wrong
conclusion.
SENSOR VALIDATION
Such an approach , of course , requires the help of do The validation of data from sensors has become an imp ortant issue in the operation and control of modern industrial plants. Usually, the control system can not
main experts to identify the dependencies of the vari ables and must also take into account of the fol l ow i ng characteristi c s:
detect signifi cant deviations from the expected values g i ven the design working point, for example of the gas turbine in a power plant. Conversely, an experienced operator is capable of detecting such deviations of a
•
The sensors can provide erroneous informa tion.
•
Information is available all the time, i .e., all sen sors can be observed as evidence or considered as
variable by direct observation of the related variables
an h ypoth esis at any time .
and consequently, avoids false plant trips. T his proj ect
•
proposes the modelli ng of the operator's experience in
The system must respond within a real time en vironment.
the detec ti on of sensor failures.
•
Typical solutions to this problem, particularly in criti cal systems where security is essential, include the use
The applic ation considers the possibility of mul tiple faults.
of: •
Hardware redundancy
and majority voting:
w here
hardware is dupli cated and a voting algorithm is used to exclude faulty sensors. This is possible in applications such as civilian aircraft or part of the nuclear industry [Yung and
C l arke,
1989].
How
ever, for many industria l plants, these tech n iques are not feasible where , for example , adding fur ther sensors might we a k en the walls of the pres •
3
THE APPROACH PROPOSED
This section presents the approach proposed through a very simple example. Assume the model of the gas turbine in a power plant shown in Fig. 11 . The root node
m
represents the rea d in g of the Megawatts gen
erated in the plant.
The temperature is represented
by node t and the pressure by p.
F inal ly,
g represent s
the fue l supplied to the combustion chamber. The val
sure vessels.
idation process starts assumin g that th e sensors, one
Analytical redundancy: in which all process, actu
by one, are suspect.
ators and sensors are monitored centrally. Exam
system deci des if the reading of the sensor is correct
ples of these tech niques are generalized likelihood ratio (GLR) [Willsky an d Jones, 1976], and failure
process is carried out for each one of the variables that
sensitwe filters [Massoumnia, 1986].
By probabilistic reasoning, the
based on the values of the most related variables. This is required to be validated. The most closely related
However, these approaches can require the develop ment of mathematical or knowledge based models whose solution require expensive computer power. Ad
d itionally, they are very expensive and dem and an enormous amount of expertise to use them in a differ ent process or even make a itored system.
m odifi cat i on
of the mon
Modern techniques, from where this
project is motivate d , include a decentralised and hier
archical approach [Yung and Clarke,
1989].
A survey
of some of these techniques can be found in [Basseville,
1988].
Previous stages in the development
of this
proj ect in
cluded some experiments in the validation of signals
in power plants [I barg iiengoytia et al., 1995]. These experiments were bas ed on the following assumption:
each sensor is validated independently, i.e., each vari able was considered as the hypothe sis while some other variables were considered as correct evidence.
How
ever , a real solution of the prob l em requires a different set of assu mptions to be taken.
For example, if the
turbine velocity is validated u tilizing only the signals of temperature and pressure, and if the re as oning re-
Figure l: Simple tree representing the turbine gener ati on
.
m o d el
variables for each sensor consist of the Markov blanket of the sensor variable. A Markov blanket is defined as the set of variables that make a variable i ndependent 1This is
a
simplified model of the gas turbine.
directions of the arcs do not imply causality.
The
334
lbargiiengoytia, Sucar, and Vadera
from th e
others.
even after the probabilistic reasoning,
ing t hree
sets
In a B ayesi an network, the follow of neighbours is suffi cient for forming a Markov blanket of a node : the se t of direct. prede cessors direct successors, and the direct predecessors
fusion: which
,
of the
successors
(i.e
parents, children, and spouses).
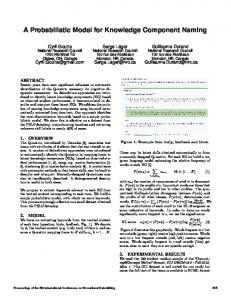
The set of variabl es that constitu tes the Markov blan ket of a variable can be seen as a p r ote cti o n of this variable against. ch ange s of vari able s outside the blan ket. Tlus rnea.ns that, in order t.o analyze a variable, it is only needed to kno w the value of all variables in its blanket. For exarnple, in Fig. l a Markov blanke t of t is { m, g}, while a blanket of g consists of { t} only. Tab le l shows the Ma rk ov blankets of each one of the variables in the rnodel of Fig. 1.
Table I: Mark o v
blankets of
process variable
p
blankets, probabilistic
area of rnaniff:'st.ation which forms a con The contexts can be arranged in a lattice as show n in Fig. :) The lower nod!:' represents the no fault contf:'xt of t.he sys te rn The upp!:'r layers repre .
.
m
is s h o w n
where t he absence of g i nd i cates that this variable is out. of m.'s Markov blanket.. ln (b), the mod el to pre
dict t indicat.es t.hat thf:' chang f:'s of pare not r onsi clf:'red giwn a value of m. The sanw for p and gin (c) and (d).
top node represents a conte xt where all .
reported faulty
.
mtpg l ( mtg I :··:-.,_. ..
(
mt
'
)
Figure
(b)
(a)
tp
�
. 1· p
)
( tpg ) T
.±
tg. )
pg
1
(. g
F igu r e 2: E qui valf:'nt models p,
for the and (d) for y.
Lattice with the
four v ariab les
,
m,
t, p,
and
Every step in the probabilist.ic rf:'asoning generates a
the final d e tec tion of the sensor in fail. bottom of the lattice of Fig. 3, eac-h step will rnake a tran siti on between thf:' nod es of the lattice. Figure 4 shows the transitions from thP bottom node (cp) to thf:' final node : {m,l,y}.
constraint. for
S tarting at the
g fails
t fails
(d)
(c)
:3:
g, for the model in Fig. 1 .
r r 7 rz 0 0 9 0 0 0
m
fails
variables. (a) for
A�sunH' tha t. the tf:'lnpera.ture sensor suffe rs catas
t.roplllr d anmge
sensors. The the Sf:'nsors are
Sf:'nt an incremental assumption of faulty
cut.. Starting the Validation jli'UfPSS with Ill, Slllrf:' f jJarftcipafCS i ll the
Figure
4:
Trajectory
followed in the la ttice by the
probabilistic reasoner"
.
[se simple turbine m o del .
proct>:s�
variable
Markov blanket
lattice node
{t,p} {in,g} {m} {t}
{m,t,p} {m,t,g} {m,p} {t,g}
m
p !I
the
axioms of ronditiona! independencl:' and
So1mdnc.5.s theorem [Pearl d al., 1990]. Although there may b e ot h er Markov blankets, only this type of t.lw
blankets are considered.
In using a Bayesian network representation for sensor validation, the following assu m p tions are m ade: 1. Observability: all the variables (sensors) can be 2.
measured directly With this llH'chani:ml, e v en if there exist rnany appar e n t faults. t.he p rop agati o n on t.ht> l a t tice distinguishes w hi ch
ers
union of its dir ec t parents
P A(X), its d ire c t successors .')U(X), and all direct
lows from
Table 2:
wnt.ains
setJsor
t.ht> re al
only single f fuel
in tlw combustion charnber. The control val v e i s cotnrnanded by the control system or by t h e oper a t or in t h e rn anua.l o p eration mode, and its ap ert u re ran be read by a p o s i t i o n sensor. The temperature at the b l ade p at h which i s t h e rnost cr i t i c a l variable. taken along tlw c i rcumfe re n c e of the t u r b i n e . .
A m o n g all var i a b l e :s t h at participate in
is
the gas tur a few are directly 1n e asure d by t h e sensors. b l ade path temperature is the most crit ical variable. i t is obtai n io> given by as t h P l a t. t i r:e model can only ensurE'
the same
t h at there exi :-;t:-; a fa u l t in pr b u t i t can not distin guish t h e d u u h l t' fau l t in pt and dp.
tlw
r e a d i n g s of sensors in i n d us t r i al T h is ap p ro ac h . b ased on Bayes ian networks
con::; ist.Pnc iPs i n
and constraint satisfaction , p ossPsses al s o tlw advan tage that m u c h
of
the p r o ce ss i n g
b efore t h e system op erate�
t he
c h a racteris t i c w i l l h e l p in
ttuired in n w s t
IS
performed off
line.
th e plant.
This
in
r e a l time p e rfo r m an c E'
uf t. h e i n d ustrial ap p l i cations.
re
With the
u s e of p ro h ah i li ty p rop ag at i o n , a p redi ction is 1n ade of
other pararnf'ters .
a vari a b l e ' s val u e b ased o n
predi cated
Vv i l i s co nsi d e r P d , which p r o d u c es a se t of constramts t h at. h as t o he solved to df'terrnine the fau lty sensor( s ) . Tlw app roach is b ase d o n two IPv els: ( i ) p robabil i ty p r o pagation , to detect a p o t e n t i a l fault , and ( i t ) run:> t t·a.iut managenwnt. to dist i n g u is h tht:> real fanlts front d w a p p ar P n t o n t:> s . T h e uwt hod w as ap p liPd to a s i t u p lifi,..cl rn odPI o f a gas turlHn w i t h pot('ntial fau l t s .
Tht:>
no
c ases w lwn
m ar i z e cl as fo llows: •
two
•
a d o n h i e fau l t otlwr.
or 1 1 1 0 1'ration has d iffP r en t p h asPs, ( e . g . , st a r t up, s y n chroni zation , stt:>ady st a t e , a n d stop) different proba
rnoclels are
b i l is t i c
required .
For exarn p l e , d ur ing the
s t a r t u p p h ase, t h e v e lo c i t y of t h e t u r b i n e able t h at.
will
changes in the probab i listic [n
add i
work well
D iffPrent prob a b i l i s t i c
is
t h e vari
be s u b st i t u t e d by the M egawatts g e n
erated d u r in g other p h ases. A m e c h an i s m
t i o n to
rno del is
to det.Pct
that al l ow s
required .
t he two l e vels of d P c i s i o n , a
r t:> aso ni n g is r e q u i rP d
new
level of
w hen tllf' fault is i n tlw
proces s , and not in the readi ngs of the i nst.rmnent.s .
For ex am p l e ,
thP sen so r
r ead i n g
roneous
valid at.or may
frorn the t u r b i n e
detect an e r ve l o c i ty g i ven t h e
temp erature an d prt:>ssure rneasures . H oweve r , i t may
be
the case that t h P r e is a SPrious rnechanical p rob
with t h e generator which may velocity to go to a ve ry low val u e .
lem
the l as t stf'p
F i n ally,
c ause that the re al
i n t h e p r oj e c t w i l l be t h e con
struction of a pro t o ty p e w hi c h performs in el ect ri cal
a
thermo
power plant. Th is p ro t oty p e r e q u i res a re al time response. Fo r this reason, d ifferent mechanisms of sc h ed u l in g h ave to be d ev e l o p ed , e.g . . any t z m e al go r i t hrns [Ibargiiengoytia d al. , 1 9 9 .'i ] . A eknow ledgtnen t s S p e c i al thanks to E d u ar d o M o r ale� w h o p r o v i d e d
val u ab l