SATC software metric database. 1 Introduction. The productivity of a software engineer is an important measure to be able to quantify. A measurement of pro-.
A Productivity Metric Based on Statistical Pattern Recognition Jody L. Sharpe Jo˜ao W. Cangussu Department of Computer Science University of Texas at Dallas jls015300,cangussu � @utdallas.edu Abstract
the financial value of the project and to complete the project within a specified amount of time. These two goals are interrelated, yet different. A manager reaches the financial productivity goal by minimizing cost and maximizing sales. The focus of this paper is to address the second basic goal, work productivity. When the term productivity is used in this paper, it refers to work productivity.
The generally accepted calculation to measure the productivity of a software engineer is based on economic theory and is borrowed from traditional product manufacturing environments. Managers often measure the productivity of a worker to determine merit-based raises or to provide feedback to workers with poor productivity. The assumption is that this calculation of a worker’s productivity is directly proportional to a worker’s value to the company. The motivation for the approach proposed here is that such relationship may not be algebraically captured with respect to the productivity of software engineers. To better capture the productivity of a software engineer and his value to a company, the productivity problem is reformulated here as a pattern recognition problem and solved using clustering. By defining a general productivity operator, clustering has been used to map the domain of the productivity operator to a range of productivity classes. This new approach has been successfully applied to randomly generated project data and actual project data from the NASA SATC software metric database.
1
The assumption that an increase in the size or complexity of a software engineer’s work product results in a directly proportional increase in the value of the work product is a fallacy in every stage of the software development lifecycle. The value of the work products produced by a software engineer is not how large the products are, but how closely the products approximate the ideal product to be produced. In product manufacturing, a piece worker has reached their ideal product output when they have produced the maximum number of products possible in a unit of time. More is better. This assumption does not extend to software engineering. The productivity of a software engineer is often affected by a number of measurable features of the engineer’s environment and evident in many measurable features of the engineer’s work products [2, 3]. These measurable features can be described as a collection of measures in a feature vector. The measurement of productivity has been relatively unchanged in software engineering for the last three decades. The simple traditional ratio measure is very common and used by many organizations. These organizations, in general, use the same measurement for productivity even though they may use unique software tools, high-level languages, and software lifecycles tailored to the needs of each individual project. It stands to reason that if a generic environment and software lifecycle is not applicable to all organizations, then a generic measure of the productivity is also not applicable to all organizations. To properly recognize productivity in unique environments, organizations need to use a customized productivity measure. To this end, this paper presents a tailor-able software metric for productivity based on clustering. Clustering is a form of statistical pattern recognition [4].
Introduction
The productivity of a software engineer is an important measure to be able to quantify. A measurement of productivity is important in determining promotions, figuring merit-based raises for a software engineer, and managing work force resources to maintain project schedules. The premise is that as a software engineer’s productivity increases so does the profitability of the organization that employs the engineer. Hence, the engineer’s value to the company increases as his productivity increases. However, the productivity of a complex entity, the software engineer, is difficult to quantify. As a result, calculations based on ratio measures for the productivity of a software engineer are difficult to quantify accurately [1]. The manager of a software project team has at least two basic goals: to optimize 1
The remainder of this paper is organized as follow. Section 2 briefly provides foundational information on clustering, software metrics, and productivity. A new approach to measuring productivity by using clustering for productivity classification is presented in Section 3. This section introduces a general description of an n-ary productivity operator. To support the assertions of Section 3, Section 4 provides a preliminary validation of the new approach by presenting its application to simulated and actual data. Section 5 presents related work along with a comparison to the proposed approach. Finally, Section 6 presents the concluding remarks.
This form of exploratory data analysis is useful in measuring productivity in software environments, because these environments are dynamic and can vary between individual projects within the same organization. Thus, to accurately determine an algebraic form of a metric for productivity in these dynamic software environments can be elusive, because the actual accurate form of the metric for productivity may vary over time from project to project. A description of clustering can be found in the section on statistical pattern recognition in Schalkoff’s work [4].
2
A software metric is a measurement taken of a software product or software process. Measurement is useful in software engineering for controlling and managing software dependability and software processes. As DeMarco’s rule states you cannot control nor predict what you cannot measure. No silver bullets exists in software engineering, however, software measurement is a technique that can alleviate some of the effects of software problems. The generally accepted calculation for the productivity of a software engineer involves two ratio measures, size and effort. Fenton reports that this calculation comes from economic theory [1], it is easy to remember and simple to calculate. Also, calculations based on ratio measures are appealing because of the many useful forms of statistical analysis that can be applied to the result of the calculation in contrast to nominal, ordinal, and interval measures [1]. These three facts contribute to the general acceptance and popularity of the computation of productivity as in Eq. 1.
2.2
Background
To properly recognize productivity in unique environments, organizations need to use a customized productivity measure. This paper presents a tailor-able software metric for productivity based on clustering which is generally described next. Some common issues related to software metrics are also described in Section 2.2.
2.1
Clustering
Clustering is one type of statistical pattern recognition. It is a form of exploratory data analysis that allows for the classification of objects [4]. The term object is used to mean a real world entity and is not limited to software objects. However, it has been shown that software objects can be classified through clustering [5]. Clustering is based on a simple principle: if the geometric description of the same attribute of two differing objects are similar, then the attributes of these differing objects must be of a similar class. The geometric description of the attribute of an object consists of a feature vector of nominal, ordinal, interval, ratio, or absolute measures. These measures in this vector represent features of an attribute being described. Although many clustering algorithms are available, we have restricted the discussion in this paper to the use of the k-means algorithm, because it is a well-known algorithm that is commonly supported in mathematical toolkits. The steps for the k-means algorithm are presented below.
Software Metrics
������� ��
������� ���� ��� ����������� ��
(1)
The numerator in this calculation represents the size of the output for the worker whose productivity is to be measured. The assumption is that the size of the worker’s output is directly proportional to the value of the worker’s output. The denominator in this calculation represents the effort expended by the worker in creating his output. Effort is commonly measured in units of time. In a productmanufacturing environment, this calculation of a worker’s productivity is directly proportional to the value of the worker to the company. Measuring the size of a worker’s output in the software engineering domain is not simple. The most commonly accepted measures of size are related to lines of code, ���� [3]. The assumption is that each line of code adds value to the worker’s final output. There are some obvious flaws in this assumption. Does an informational comment add value to the worker’s final output? Does a line of code that has been commented out add value to the worker’s final output? To address this shortcoming of the size measure in the productivity calculation, some have chosen to
1. Choose the number of classes, k. 2. Choose k initial cluster centers. 3. Classify each feature vector based on the k cluster centers. 4. Recompute the cluster centers based on the clusters formed in step 3. 5. Repeat step 3 until the clusters remain consistent. 2
�
use Albrecht’s function points ( ! ) to measure the size of a worker’s final output [1]. This approach addresses the fact that a software product has a set value based on the features that the product provides whether the worker codes it with " or #�" lines of code. However, the computation of function points is subjective and is not always a meaningful metric for object-oriented software. A detailed description of size measures can be found in Fenton’s work [1]. Measuring the effort that a worker expends in producing his output in the software engineering domain also is not simple. The most commonly accepted measure of effort is in units of time, since the cost of a worker is based on the amount of time worked. The most common unit for time is �%$ . One method for improving producperson-months, tivity based on Eq. 1 is to reduce effort [6]. This measure of effort is simple to determine at the end of a project. However, this measure of effort is not simple to predict at the beginning or during a project. Although, models such as COCOMO II can be used to gauge the effort required in software engineering projects. Also, the cost of the effort a worker expends in producing his output can be influenced by many factors such as the use of CASE tools [1, 2]. One factor that can affect the productivity of an engineer is the complexity of the tasks that he has to complete. McCabe’s Cyclomatic Complexity and Withworth’s Complexity Measure are two among many measures that can reflect the complexity of the software instructions that an engineer has to design, code, or test. McCabe’s cyclomatic complexity will be the only complexity metric used in this paper. The traditional ratio measures of size and effort cannot fully capture a software engineer’s productivity. A number of characteristics of a software engineer’s work product combined with a number of environmental factors can better describe his productivity [7, 8]. The productivity of a software engineer cannot be adequately captured with a single ratio of two measures and is more completely described as a collection of nominal, ordinal, interval, ratio, or absolute measures in a feature vector. Geometrically, the productivity of a software engineer is better described as a point in n-space than a point on a one-dimensional line.
3
the measures can be a mixture of measure classes (i.e. not all ratio measures). One cost of representing a complex attribute as a collection of measures in a feature vector is that the amount of statistical analysis that can be performed on the measure is less than the amount that can be performed on a ratio measure. A benefit of representing complex attributes as a collection of measures in a feature vector is that they can be plotted in n-space. If the same complex attribute is measured from two separate complex entities and the feature vectors of measures describing both complex attributes plot near one another in n-space, the complex attributes may be of a similar class. When plotting many of these feature vectors describing attributes of many entities of the same class in n-space, natural clusters can form. These clusters represent different classes of the same attribute. To each of these classes of attribute, a nominal, ordinal, interval, ratio, or absolute measure can be assigned. This paper presents the n-ary metric operator from Eq. 2.
&�')(+*-,/.0*21/.4343/30.0*6587�9;:
'
(2)
*=,/.4343/30.0*65
where < is a n-ary productivity operator, are : features of the productivity attribute, and is a measure of ' productivity. By mapping the feature vector of the domain of < to productivity classes through clustering, this metric has the following benefits: (i) it can be tailored to individual software engineering environments; (ii) it is more descriptive than the previous metrics; and (iii) it can account for all of the salient features of an engineer’s environment that affect productivity including features such as percentage of case tool use and the complexity of the tasks that are required to be done. Cluster ranking can be done based on the same similarity measure used to perform clustering. A procedure for determining cluster rank is listed below. Step 1: Identify the optimal productivity value. The optimal productivity value should be an extremal feature vector. The optimal productivity value may coincide with a cluster center or a measured productivity value. Step 2: Measure the similarity between the optimal productivity value and the remaining cluster centers. Step 3: Rank the remaining cluster centers based on their similarity to the optimal productivity value from most similar to least similar. Finally, Fenton states that the following property of a measure must exist for it to be a meaningful measure. “We say that a statement involving measurement is meaningful if its truth value is invariant of transformation of allowable scales.” Productivity measurement based on statistical pattern recognition is meaningful since the ranking of the cluster centers based on a similarity measure is invariant of transformation based on the allowable scales of each feature in the feature vector.
Using Clustering for Productivity Classification
As stated earlier, the productivity of a software engineer cannot be represented well by a single ratio of two measures. Currently, the most used measure of the productivity of software engineers is the metric from Eq. 1. However, complex entities have complex attributes that defy measurement with algebraic calculations. An alternative representation of such complex attributes is as a collection of measures in a feature vector. A benefit of representing a complex attribute as a collection of measures in a feature vector is that 3
4.1
Many benefits exist to using clustering to solve the problem of determining productivity for a software engineer, some examples are: (i) well-known algorithms exist for clustering; (ii) through the use of clustering and a distance formula, a manager can determine the extent to which a software engineer’s environment and performance pattern must be adjusted for an unproductive engineer to be classified as productive; (iii) organization can select measures that are tailored to their software engineering environment and are not constrained to a general measure; and (iv) a feature vector of measures describes software engineering productivity more completely than Eq. 1 by providing more information about an engineer’s productivity. Also, there are costs associated with the use of a clustering technique, for example: (i) the number of types of statistical analysis that can be done on the productivity measure is less than number of types that can be done on Eq. 1; (ii) the calculation of the measure is more complex and takes more time to determine than Eq. 1; and (iii) the calculation of the measure is not simple to remember.
4
NASA SATC Case Study
Term 1
for small projects, #?> for medium size projects, @?> for large projects, and AB> for very large projects. The selection of small, medium, large, and very large projects was done using the k-means algorithm � A ) on the size of the project. The nominal value of > (C does not interfere with the clustering results.
:
Meaning Ternary productivity operator. Effort in person-months (PM) for the project. Due to lack of this information on the data set, the values where assumed to be proportional to 4 clusters created algorithm '�K using ' the k-means ' on the number of LOC for each project. ( ( �HG I J %HLMI J 7ON 7QP=R
F
���%2S�T
#
:
. A measure of
the resistance impeding . Cyclomatic complexity in the ' SATC Database is reported in �UL to �HG ). For ranges of complexity (from : each project ( ) in the' database, the number of modules in that project R that fall within the given range are reported ( ) and the measure is cho' sen to be the sum of the middle of a reported R range multiplied by the number of modules ( ) in that complexity range for a given project divided the entire project. N �-LOC �� . for W �� by A measure : of a reduction in the resistance impeding . In this example, this measure is chosen to be the number of comments in the entire project divided by the number of lines of code in the entire project. It is assumed here that the presence of comments reduces the complexity of modifying the code, i.e., the more comments available the easier the project becomes to understand [10]. A measure of productivity.
Table 1. Description of the terms in productivity equation The simulation using clustering showed that a relationship can be approximated between a productivity feature vector and the productivity class to which it maps. Consider the following description of a productivity operator (Eq. 3) and productivity equation (Eq. 4). This approach can be used for both individual engineers and teams. This section examines a team productivity operator and a productivity equation for the non-object oriented C projects recorded in the NASA Software Assurance Technology Center Code Metric Database. Table 1 describes the terms for this productivity equation.
& ( D . E . V 27 9X: 1 D One can : hypothesize, that if , E , and V K above, could be described by Eq. 4 ( D 7Y( E V 7�Z[:6. ]\ E N V for 4
(3) are defined as (4)
^
Cluster
# A
@
�_`^/a ABC �_8^?^�^b%_8^�^ # �_?c�a`^/de�_?c�a`^/f �_?c�a`^/ g�h`^/a`^ �a?a�a`^ @ _�a`^ �_8^4a8^ �_8^4a @ �_ # a�i �_ # ^4aj�_?_8^ A �_�_`^/c �_`^/a?_j�_?c�a�_ �_ # a?k��l�_ # a�k?�g�_ A a8^4dm%_ A a`^/fn�_?_8^ # �_?_8^ @ �_?_8^/_o�_�c?a # �_�c?a @ %k8^/a`^
Project
Class
# A
@
E
V
H L M L
L M L H
M/H M M/H H
Productivity Range 0.51 - 0.75 0.00 - 0.25 0.76 - 1.00 [ 0.26 - 0.50
q
Rank
1.0007 1.0181 0.0000 1.0058
2 4 1 3
Table 3. Classification of feature vectors of productivity equation (L:Low, M:Medium, and H:high)
Table 2. Clustering of feature vectors of productivity equation
:
^
D
�ba 3 i
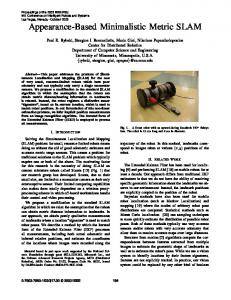
and low documentation ( V p # #?# ). The distance from cluster 3 to cluster 2 is the largest one. Similar arguments justify rank=3 for cluster 4. Based on this classification, a correlation appears to exists between the percentage of comments and the complexity of the final deliverable. This observation suggests that the addition of comments to code during software development increases productivity. Figure 1 contains a graphical depiction of the four clusters of the project data.
K
Remembering classical physics, is of a form similar ( 7 � to the ! ). equation for the restoring force for a spring ( > C D E V Based on the definitions : of , and , one can infer from the equation above that describes a certain amount of “force” required to move the project to completion. A similar treatment of the software engineering testing process can be found elsewhere [11]. However, to prove that (3) is accurately represented by (4) would be very difficult. One alternative to avoid proving this deterministic relationship is the feature vectors formed by D , clustering. E , and V inBytheclustering productivity equation one can classify the values of the domain into a range of productivity valD ues. Empirical values from actual projects for , E , and V , were obtained for the non-object oriented C projects from the NASA SATC Code Metric database. D The data ( , E , and V ) for these non-object oriented C projects in the database was clustered with the k-means algorithm into four clusters as shown in the Table 2. The clusters can be classified in four classes of productivity based on the measurements in the database. This classification, as seen in Table 3, was made based on the following assumptions. Projects on cluster 3 can be considered the most productives since with a medium effort (average of 2 PM) they were3 able to produce a software with low com�la a�a?c�c?_ ) and medium to high documentation plexity 3(E p V( p �ga A _ A i ). After selecting the most productive cluster, the rank of the remaining ones is achieved by sorting the distances q between the centers of the most productive cluster and the other cluster. Euclidean distance was used to compute the refered distances and the values are shown in Table 3. As can be noticed cluster 1 is the closest to cluster 3 and therefore ranked as 2 while clusters 2 and 4 are ranked, respectively, as 4 and 3. The ranking based on the distances is justified when analyzing the cluster. Cluster 1 is ranked as 2 since it has projects that able to produce a “well” documentend �ra 3 A # c?_ were (V p ) product a relatively low complexity �sa 3 a #?@ h @ ). As canwith (E p be seen in Table 3, cluster 1 is the most similar to cluster 3 and it also has the smallest distance. Also, cluster 2 is the less productive (rank = 3 4) as it �o^ c?c�c # k ) generates products with a high complexity (E p
cluster 1 cluster 2 cluster 3
3
cluster 4 cluster centers
λ
2.5
2
1.5
1 0.4 0.3 0.2 0.1
ρ
0
0.1
0.2
0.3
0.4
0.5
0.6
0.7
0.8
σ
Figure 1. Results from the clustering, using the k-means algorithm with k=4, for the projects available at the NASA SATC Code Metric Database.
5
Related Work
The current metrics that measure productivity are based on Eq. 1. The most prevalent of these is metric 5.
���� N ��$
(5)
The greatest benefit of metric 5 [2] is that it is simple to remember and to determine. However, it greatest shortcoming is that a verbose coder who provides little functionality in his work products will appear productive. The first major advance made to metric 5 was metric 6.
N ! � ��$
5
(6)
The use of Albrect’s function points [1] account for the fact that a program with " lines of code and #�" lines of code that provide the same functionality are equivalent. However, Albrecht’s function points are not exact and are only an estimate of the functionality provided in a software product. Also, function points do not translate to object oriented software well. The next major advance made to metric 6 was metric 7. t �� N �%$ (7)
proposed approach allows for the selection of features to be used in the operator consequently customizing it to the company’s/project’s need.
The use of use case points [12] overcomes the limitation of Albrecht’s function points to deal with object oriented software. However, it greatest limitation along with the previous two traditional metrics is that it provides a limited description of productivity. Many features of a software engineer’s work product and environment describe his productivity. The productivity of a software engineer is too complex and too dynamic to capture with a simple ratio of measures. The productivity metric presented in this paper accounts for the complexity of software engineering productivity and the dynamic nature of software engineering environments. The use of any simple ratio measure can lead to meaninfull results but can also produce measlinding outcomes. The use of a n-ary feature vector reduces the probability of misleading results.
[2] J. Keyes, Software Engineering Productivity Handbook. New York , N.Y.: Windcrest, 1993.
6
References [1] N. E. Fenton and S. L. Pfleeger, Software Metrics: A Rigorous and Practical Approach. Boston,M.A.: PWS Publishing Company, 1997.
[3] C. Jones, Programmer Productivity. New York, N.Y.: McGraw-Hill, 1986. [4] R. Schalkoff, Pattern Recognition: Statsitical, Structural, and Neural Approaches. New York, N.Y.: Jonh Wiley and Sons, 1992. [5] J. Plata, “Application of an attribute selection method cbr-based software quality classification,” in Proceedings of the IEEE International Conference on Tools with Artificial Intelligence, pp. 47 – 52, 2003. [6] J. Plata, “Enhancing the semiconductor fab layout process,” in Proceedings of the IEEE/SEMI Advanced Semiconductor Manufacturing Conference, pp. 11 – 15, 1994.
Concluding Remarks
[7] F. Brooks, The Mythical Man Month: Essays on Software Engineering. Reading, M.A.: Addison-Wesley, 1995.
The productivity of a software engineer is difficult to quantify accurately. The generally accepted calculation for the productivity of a software engineer does not accurately account for the value of a software engineer’s work product or the cost of producing that work product. Productivity is a complex attribute of a complex entity, a software engineer. A number of measurements of a software engineer’s work product and a number measurements of a software engineer’s environment are necessary to accurately classify the productivity levels of a software engineer. Recasting the problem of measuring the productivity of a software engineer as a pattern recognition problem creates an effective means of classifying software engineers as productive or less productive through clustering. Clustering also allows a manager to determine how to adjust an engineer’s environment so that he can be reclassified as productive. In this paper, this approach was successfully applied to simulated data and actual data for the NASA SATC Code Metric Database. The results have shown that a n-ary operator is able to properly identify classes of productivity that is not necessarily achieved when using existing productivity metrics. Though additional experiments are requested and planned to properly validate the proposed approach, the results presented here are a good indication of the applicability and validity of the approach. Also, the
[8] H. Calow, “Maintenance productivity factors - a case study,” in Proceedings of the Conference on Software Maintenance, pp. 250 – 253, 1991. [9] “National aeronautical and space agency software assurance technology center code metric historical database.” http://satc.gsfc.nasa.gov/metrics/codemetrics/index.html. [10] M. Arab, “Enhancing program comprehension: formatting and documenting,” SIGPLAN Notices, vol. 27, pp. 37 – 46, February 1992. [11] J. Cangussu, “A formal model of the software test process,” IEEE Transcations on Software Engineering, vol. 28, pp. 782 – 796, 2002. [12] M. Arnold, “Software size measurement and productivity rating in a large-scale software development department,” in Proceedings of the 20th International Conference on Software Engineering, pp. 490 – 493, 1998.
6