A Programmable Real-Time System for. Development and Test of New Ultrasound. Investigation Methods. Stefano Ricci, Member, IEEE, Enrico Boni, Francesco ...
ieee transactions on ultrasonics, ferroelectrics, and frequency control, vol. 53, no. 10, october 2006
1813
A Programmable Real-Time System for Development and Test of New Ultrasound Investigation Methods Stefano Ricci, Member, IEEE, Enrico Boni, Francesco Guidi, Tiziano Morganti, and Piero Tortoli, Senior Member, IEEE Abstract—In vitro and/or in vivo experimental tests represent a crucial phase in the development of new ultrasound (US) investigation methods for biomedical applications. Such tests frequently are made difficult by the lack of flexibility of general purpose instruments and commercial US machines typically available in research laboratories. This paper presents a novel, real-time development system specifically designed for US research purposes. Main features of the system are the limited dimensions (it is based on a single electronic board), the capability of transmitting arbitrary waveforms to two probes, of storing the received radio-frequency (RF) echo data in a file and/or of processing them in real-time according to programmable algorithms. As an example of application, results of simultaneous hemodynamic and mechanic investigations in human arteries are reported. However, the high system flexibility and portability make it suitable for a large class of US applications.
I. Introduction he development and test of new methods for obtaining valuable information by means of ultrasound (US) unavoidably pass through in vitro and in vivo experimental phases. Experimental tests are typically based on the use of commercial US equipment and/or classic instruments such as waveform generators, power amplifiers, digital oscilloscopes, and acquisition boards. Main drawbacks to such approaches are the lack of flexibility and portability, which limits the number of feasible tests and the locations where these can be performed. Unfortunately, the only assistance offered to the researcher by some commercial scanner consists of the possibility of saving a few seconds of raw radio-frequency (RF) data for possible postprocessing purposes. This feature is implemented, for example, in the Sonoline AntaresTM through the Axius Direct Ultrasound Research Interface (Siemens Corporation, New York, NY), in Technos systems (Esaote, Florence, Italy), in Logiq scanners (General Electrics Medical System Company, Fairfield, CT), in the Ultramark scanners (Philips/ATL, Seattle, WA) and in a few others. A major flexibility characterizes the Sonix RP
T
Manuscript received June 30, 2005; accepted November 26, 2005. This work has been supported by the EU grant # QLG-CT-200201518 (UMEDS project) and by the Italian Ministry of Education, University and Research (COFIN 2002). The authors are with the Electronics and Telecommunications Department, University of Florence, Florence, 50139, Italy (e-mail: stefano.ricci@unifi.it). Digital Object Identifier 10.1109/TUFFC.2006.113
(Ultrasonix Medical Corporation, Burnaby, BC, Canada), a commercial computer-based system in which a software development kit (SDK) allows the researcher to build his own applications in the Microsoft� Visual Studio� environment.[1] A few development systems specifically dedicated to the US research have been implemented so far [2]–[4]. A significant example is represented by the RASMUS system [2], which aims to acquire multichannel data from multielement transducers and to enable real-time or near realtime processing of the acquired data. Such high flexibility is obtained through four distinct modules implemented through a suitable high number of boards, including dedicated transmitter-receiver (TX-RX) boards and singleboard computers. This paper describes an integrated system addressed to control one or two US probes according to highly flexible transmission and reception strategies. The novel system consists of a single proprietary board connected via USB 2.0 to a host computer in which a specific software runs. The board includes all the electronics for the transducers front end, as well as a programmable digital architecture the user can easily operate on to fit a large range of applications. The typical needs of US research have been taken into account in the board design (see Table I). Arbitrary waveforms can be transmitted to each transducer and arbitrarily changed between consecutive pulse repetition intervals (PRIs). For example, it would be possible to transmit coded pulses [5] or special waveforms capable of compensating the transducer response through an “inverse filter” approach [6]. The received echo signals are directly sampled at RF with 14-bit analog-to-digital (A/D) converters to preserve their original features over a high dynamic range, capable of accommodating both strong signals reflected from tissue interfaces and weak echoes backscattered from blood. In cases in which baseband signals (I/Q) are preferred, the demodulation can be performed digitally by using almost ideal multipliers and programmable low pass (LP) filters to maintain the original signal integrity [7]. Four demodulators have been implemented onboard, to make simultaneous demodulation possible by different frequencies, to obtain data from the fundamental frequency and harmonics, as could be useful, for example, in contrast agents applications [8].
c 2006 IEEE 0885–3010/$20.00 �
1814
ieee transactions on ultrasonics, ferroelectrics, and frequency control, vol. 53, no. 10, october 2006
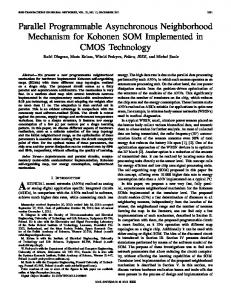
Fig. 1. The DSP board, whose main blocks are highlighted in the picture on the left, is connected to the host computer through a USB 2.0 channel (right).
TABLE I Main Features of the New System. General features
Open architecture based on digital programmable devices Two independent TX/RX channels Real time display of processed data Box size: 180 × 200 × 55 mm
Transmitter (two channels)
Possibility to transducers 1 transmitting – 2 transmitting – 1 transmitting –
independently
drive
two
1 receiving 2 receiving 2 receiving
64 MSPS - 8 bit DAC arbitrary waveform generator Output bandwidth: 1 - 16 MHz
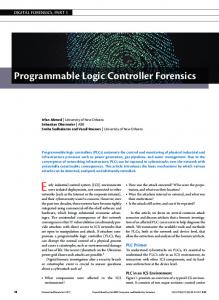
Fig. 2. Block diagram of the DSP board.
an application to the investigation of hemodynamic and mechanic features of human arteries is reported in Section III. Possible further fields of application are discussed in Section IV.
Output power: programmable up to 100 Vpp PRI from 100 Hz to 20 kHz Receiver (two channels)
Echo sampled at 64 MSPS – 14 bit Dynamic range: 70 dB (1 MHz, 40 dB gain) Input programmable gain: 20 dB–60 dB Input bandwidth: 20 MHz √ Input noise: 2nV/ (Hz) (input loaded on 50 Ohm)
Digital signal
Programmable LP filter and decimator Up to 4 concurrent programmable demodulation frequencies
processing
4600 MOPS and 600 MFLOPS for application specific processing
Memory
64 Mbyte on board SDRAM to save RF or demodulated data
A large class of processing algorithms can be applied to the input data, both in the slow-time and in the fast-time domain, including auto-correlation [9]–[11], cross-correlation [12], pulse compression [5], autoregressive methods [13], [14] and fast Fourier transform (FFT) [15]. The received echo data can be stored in a huge memory (64 Mbyte) and downloaded into a file on the host computer. The next section describes the overall system concept and provides details of each main block. An example of
II. System Description The novel system includes all the signal conditioning and processing electronics requested in a complete US echographic equipment in a single board. The board is housed in a 180 × 200 × 55 mm box. Two connectors are available where probes with single element transducers of frequency in the range 1–16 MHz can be inserted. A USB 2.0 connection links the board to a laptop or desktop computer (Fig. 1). As highlighted in Fig. 2, the electronics included in the board may be roughly divided into four functional sections: TX-RX, processing, buffer memory, and USB interface. The TX section can independently drive two singleelement transducers with digitally synthesized waveforms. The power amplifiers of the front end are designed to allow driving a large range of transducers with different impedance, central frequency, and bandwidth. The two TX/RX channels can be arranged to work according to multiple configurations. In fact, they can be used: to concurrently investigate two separate, noninterfering regions; to investigate the same region of interest (ROI), by using each TX-RX every second PRI; in a pitch-catch configuration.
ricci et al.: programmable system for ultrasound investigation methods
Fig. 3. Transmission of arbitrary waveforms as obtained by D/A converting the samples stored in concatenated look-up tables.
In the RX sections, after suitable analog signal conditioning, two A/D converters capable of 64 million samples per second (MSPS) are used. The processing section is the heart of the board and is based on two powerful digital devices: a field programmable gate array (FPGA) from the Stratix family (Altera, San Jose, CA) and a digital signal processor (DSP) from the TMS320C67 family (Texas Instruments, Austin, TX). This section is fully programmable and, granting a calculation power of more than 4600 million operations per second (MOPS) and 600 million floating point operations per second (MFLOPS), is suitable to sustain intensive real-time processing of RF echo signals. The board is equipped with a 64 Mbyte SDRAM buffer in which input RF and demodulated I/Q data is stored to be downloaded, on demand, into a file in the host computer. The interface section manages the communication toward the host computer through the USB 2.0 highspeed channel that guarantees a bandwidth of at least 20 Mbyte/s with currently available computers. The system sends the results of the elaboration to the computer software for real-time visualization and receives commands from the user interface for the acquisition and elaboration setup. An audio codec (PCM3003 from Texas Instruments) also is present onboard. The stereo output channel is used to reproduce Doppler signals, obtained by suitably processing the acquired data. A. Transmitter The transmitters embedded in this system are designed to independently drive each of the two available transducers with a fully programmable sequence of arbitrary bursts. This is obtained by using a concatenated chain of look-up tables housed in the FPGA memory (Fig. 3). The user fills each table with the samples of a specific burst. Then, by chaining the tables, the reproduction sequence can be programmed. A state machine in the FPGA produces the transducer excitation waveform by moving the samples in each table to a 64 MSPS digital-to-analog (D/A) converter. The look-up tables are scanned in the order assigned by the concatenation, one look-up for each PRI. The pulse repeti-
1815
tion frequency can be programmed from 100 Hz to 20 kHz. Whenever the reference contained in the last table of the desired sequence links to the first one, a periodical burst sequence is produced. The simple sinusoidal pulses that in standard Doppler applications are transmitted at all PRIs can be produced by involving only one table that links to itself. The software running in the computer helps the user to synthesize the transmission sequence through the graphical interface displayed on the left of Fig. 4. The open drop-down list shows the catalogue of predefined modulation functions available for each of the two transmitters. It also is possible to upload the digital samples of the waveform to be transmitted directly from a user-designed file. Depending on the chosen modulation, the appropriate parameters on the right column are specified. In the example shown in Fig. 4, the selection of “Step FM” enables the transmission of four consecutive bursts of four cycles each, with frequency stepping from 2 MHz to 8 MHz and normalized amplitude of 100. The software calculates the waveform samples and allows their preview as shown in Fig. 4 (waveform “a”). With a similar procedure, the second transmitter is programmed in “step AM” to produce four Hanning weighted bursts of increasing amplitude, each of three cycles at 3 MHz (see waveform “b” in Fig. 4). After the D/A conversion, the bursts are sent to a linear power amplifier that produces up to 100 Vpp. The frontend is designed to drive both low and high impedance elements at frequencies ranging from 1 MHz to more than 16 MHz. B. Receiver The transducer front end includes only minimal analog signal conditioning, the A/D conversion being performed directly after the front-end (RF sampling). For each channel, a low noise amplifier (LNA) (MAX4107, Maxim Integrated Products, Inc., Sunnyvale, CA) processes the received echo signal, while a programmable gain amplifier (PGA) (AD603, Analog Devices, Norwood, MA) is used to match the dynamic range of the following 14-bit A/D converter, which operates at 64 MSPS. The input chain features a programmable gain ranging from √ 20 to 60 dB with an equivalent input noise of 2 nV/ (Hz). Except for a high-frequency, antialiasing 2◦ order LP filter, set at 30 MHz, no further analog conditioning is performed. As an example, Fig. 5 shows the RF signal acquired from the carotid artery of a volunteer. In such an architecture, possible coherent echo demodulation, to produce the in-phase and quadrature signal components, must be performed digitally. This task involves such a large number of calculations that no present commercial DSP can support it. However, the latest FPGA families include facilities such as tens of parallel multiply and accumulate units that make the digital demodulation feasible [16]. Four independent digital demodulators have been implemented on the system FPGA (Fig. 6). A programmable
1816
ieee transactions on ultrasonics, ferroelectrics, and frequency control, vol. 53, no. 10, october 2006
Fig. 4. Snapshot of the software graphical interface related to the transmitter setting. On the left, the parameter window of transmitter A is shown, on the right the preview of the two waveforms (a and b) as calculated by the software on the entered settings. In the example, the A transmitter is set to produce a sequence of four-cycle pulses at 2,4,6,8 MHz, respectively, in four consecutive PRIs. Transmitter B (right) produces a four-burst excitation of Hanning weighted three-cycle pulses whose amplitude increases at each PRI.
specific firmware running on the DSP can access the buffer to gather demodulated data, RF data, or both, and process them according to the specific application. The DSP organizes the results of the elaboration in frames of programmable dimension that are sent to the computer through the USB 2.0 unit, for real-time display purpose. Section IV reports an example of application in which the DSP is used for simultaneous, real-time implementation of FFT and cross-correlation algorithms for arterial mechanics investigations. C. Computer Software Fig. 5. Normalized amplitude of the RF echo signal acquired from the carotid artery of a volunteer. The signal is sampled at 64 MSPS, and a burst of three sinusoidal cycles at 8 MHz was used to light the ROI. The echoes produced by the near and far wall of the vessel are visible at depths of 10 and 17 mm, respectively.
switch matrix connects the two input channels to the demodulators. For example, if a single input channel is used, it can be connected to all demodulators so that four different demodulation frequencies could be used simultaneously. The outputs from demodulators are filtered through a chain of four-stage cascaded integrator comb (CIC) filters interleaved with decimators. Because CIC filters are based on adders, this choice allows us to save multipliers in the FPGA with respect to the standard finite impulse response (FIR) architecture. The software, while programming the decimation and integration factors of every filter stage, controls the appropriate overall filter behavior. Furthermore, in the CIC filter, it is possible to obtain a zerotransmission point exactly over the image frequency. For example, for the case of 4 MHz demodulation, it is possible to design the filter to reject by more than 100 dB the bands around 4 MHz and harmonics. The filtered samples are stored in a large memory buffer together with the original RF samples. The application-
The system includes a plug and play Windows� (Microsoft Corp., Redmond, WA) driver and a proprietary software running on the host computer to which the board is connected through the USB 2.0 channel. This software presents a user friendly interface to facilitate the interaction with the hardware. The user can upload the firmware for the application of interest, design the excitation bursts for the probe, view the results of the elaboration in real time, and download several seconds of raw US data into a file in the host computer. During the working session, the user also can tune a large set of acquisition and processing parameters by checking the effectiveness of the setup through the realtime display. Some parameters are specific to the running application, and others are more general, including the gain of the front-end PGA, the PRI, demodulation frequencies, LP filters cut-off frequency, dimension and position of the ROI, the type and shape of the transmitted pulse for each transducer, etc. The software, developed in the Microsoft� Visual Studio� environment, is based on the latest Windows� programming technologies (like DirectX and Window Driver model (WDM)). On a current computer it works out more than 10 MByte/s from the board and grants a display refresh rate of more than 50 fps, sufficient for fluid real-time presentations.
ricci et al.: programmable system for ultrasound investigation methods
1817
Fig. 6. The digital section can simultaneously process the echoes received from two A/D converters through up to four chains of demodulators and decimator filters. A large memory gathers both RF and IQ data. The DSP accesses the memory to perform specific processing tasks, and the results are sent to the host computer to be displayed in real time.
III. Experimental Test It was shown recently that suitable processing of multiple echo-signals received from an M-line can provide information on both the velocities of blood inside the arteries and the diameter changes (distension) of arterial walls [17]. However, different beam-to-vessel angles are needed for the two types of measurement because the wall characteristics are better analyzed with transverse beams, but Doppler measurements prefer more longitudinal orientations. Previous hardware [18] prevented real simultaneous hemodynamic and mechanic investigations possible. This problem is overcome with the new system, thanks to its capability of simultaneously controlling two independent probes. The excitation of two 5 MHz transducers has been synchronized to fire the appropriate energy bursts on the same ROI in such a way that the echoes do not interfere. Each transducer could be positioned to fire the US beam along the optimal angle for flow assessment and wall tracking, respectively. Blood flow spectral velocity profiles [19] were obtained through the 128-point FFT of each of the digitally demodulated Doppler echo-signals backscattered from 128 different depths from the first transducer. Each new frame of 128 spectra by 128 frequency points each was obtained in just 3.3 ms, much faster than necessary for real-time applications. The second transducer was set at 90◦ to the arterial walls to be investigated. The related echoes were digitally demodulated and processed according to the following strategy. Application of the FFT, exactly as for the Doppler transducer, here produced spectral profiles symmetrical around the zero frequency, a feature that could be exploited to obtain a fine adjustment of the beam-to-vessel angle [18]. Simultaneously, for each PRI, the echo samples reflected from the walls were automatically identified by analyzing the received power. Such samples were processed according to the two-dimensional (2-D)-autocorrelation algorithm [10] that is computationally equivalent to the cross correlation [11]. In this way, the velocities of both anterior and posterior walls were computed. After integration, the instantaneous wall position was obtained. Fig. 7 shows an example of results obtained with the described system when the common carotid artery of a healthy volunteer was analyzed. For a complete cardiac
cycle Figs. 7(a) and (b) show the instantaneous positions of the near and far walls, respectively. Fig. 7(c) reports the difference between such waveforms, corresponding to the distension waveform. While such traces are displayed, the computer monitor also simultaneously shows the dynamically evolving spectral profile detected from the Doppler transducer. As an example, Fig. 7(d1–d3) shows some of the velocity profiles, “frozen” at the time instants highlighted by vertical bars in Fig. 7(c). For clinical applications, data such as the distension can be extracted from the above waveforms.
IV. Discussion A system specifically designed for the development of new US investigation methods has been presented. In such a system, the full digital approach, which is possible thanks to the features of the latest generation of FPGA and DSP, grants the high programmability and flexibility requested in a development tool. The system is capable of driving two independent, single-element transducers, processing RF or demodulated data according to a user algorithm in real time, downloading several seconds of acquired echoes onto the host computer. The software running on the computer offers a user friendly interface for the real-time displaying of the results and the tuning of the acquisition and processing parameters. The USB 2.0 connection, together with the compact size of the board, makes the system suitable for easy movement to different laboratories and installed on laptop or portable computer.
V. Conclusions Although this system does not support the use of arrays, it can be used in a wide range of research applications. As a first example of application, the possibility of simultaneously investigating the mechanic properties of the arterial walls and the hemodynamic of blood flowing inside has been presented. This represents a significant step forward toward the goal of assessing the functional interactions between distensibility and wall shear rate in human arteries [20]. However, the use of the new system is not limited to this application. It also is currently used for micro-emboli detection purposes [21], in which multigate analysis can be
1818
ieee transactions on ultrasonics, ferroelectrics, and frequency control, vol. 53, no. 10, october 2006
Fig. 7. Proximal (a) and distal (b) wall displacement and distension (c) during a heart cycle. Charts are obtained by the first transducer positioned at 90◦ with respect to the carotid artery of a healthy volunteer. The Doppler signal from the second transducer produces the velocity profiles, here frozen in diastolic phase (d1,d3) and systolic phase (d2).
useful for distinguishing real from false events, as well as in studies for characterization of contrast agents [22]. In the latter case, the TX flexibility and the possible interrogation by two probes may have significant applications [23]. Moreover, the availability of multiple demodulators can be exploited to simultaneously get the microbubble echoes at fundamental and harmonic frequencies [24]. Other possible fields of application include radiation force imaging [25], tissue characterization [26], and the measurement of material properties [27]. The system programmability and its limited dimensions make it ideal for possible implementation of a large class of new US methods that could be proposed by other laboratories.
References [1] R. Rohling, W. Fung, and P. Lajevardi, “PUPIL: Programmable ultrasound platform and interface library,” Lecture Notes Comp. Sci. (LNCS), vol. 2879, pp. 424–431, 2003.
[2] J. A. Jensen, O. Holm, L. J. Jensen, H. Bendsen, H. M. Pedersen, K. Salomonsen, J. Hansen, and S. Nikolov, “Experimental ultrasound system for real-time synthetic imaging,” in Proc. IEEE Ultrason. Symp., 1999, vol. 2, pp. 1595–1599. [3] F. Guidi, G. Guidi, S. Ricci, C. Atzeni, and P. Tortoli, “Highspeed parallel processing of biomedical ultrasound signals,” in Proc. Second Eur. DSP Education Res. Conff. (EDERS), Sep. 1998, pp. 327–330. [4] M. Scabia, E. Biagi, and L. Masotti, “Hardware and software platform for real-time processing and visualization of echographic radiofrequency signals,” IEEE Trans. Ultrason., Ferroelect., Freq. Contr., vol. 49, pp. 1444–1452, 2002. [5] R. Y. Chiao and H. Xiaohui, “Coded excitation for diagnostic ultrasound: A system developer’s perspective,” IEEE Trans. Ultrason., Ferroelect., Freq. Contr., vol. 52, no. 2, pp. 160–170, 2005. [6] C. Dorme and M. A. Fink, “Ultrasonic beam steering through inhomogeneous layers with a time reversal mirror,” IEEE Trans. Ultrason., Ferroelect., Freq. Contr., vol. 43, no. 1, pp. 167–175, 1996. [7] P. J. Brands, A. P. G. Hoeks, L. A. F. Ledoux, and R. S. Reneman, “A radio frequency domain complex cross-correlation model to estimate blood flow velocity and tissue motion by means of ultrasound,” Ultrasound Med. Biol., vol. 23, no. 6, pp. 911–920, 1997. [8] F. A. Duck, “Nonlinear acoustics in diagnostic ultrasound,” Ultrasound Med. Biol., vol. 28, no. 1, pp. 1–18, 2002. [9] C. Kasai, K. Namekawa, A. Koyano, and R. Omoto, “Real-time two-dimensional blood flow imaging using an autocorrelation technique,” IEEE Trans. Sonics Ultrason., vol. 32, pp. 458–464, 1985. [10] T. Loupas, J. T. Powers, and R. W. Gill, “An axial velocity estimator for ultrasound blood flow imaging, based on a full evaluation of the Doppler equation by means of a two-dimensional autocorrelation approach,” IEEE Trans. Ultrason., Ferroelect., Freq. Contr., vol. 42, no. 4, pp. 672–688, 1995. [11] S. I. Rabben, S. Bjærum, V. Sørhus, and H. Torp, “Ultrasoundbased vessel wall tracking: An auto-correlation technique with RF center frequency estimation,” Ultrasound Med. Biol., vol. 28, no. 4, pp. 507–517, 2002. [12] P. J. Brands, A. P. G. Hoeks, J. Willigers, C. Willekes, and R. S. Reneman, “An integrated system for the non-invasive assessment of vessel wall and hemodynamic properties of large arteries by means of ultrasound,” Eur. J. Ultrasound, vol. 9, pp. 257–266, 1999. [13] F. S. Schlindwein and D. H. Evans, “Selection of the order of autoregressive models for spectral analysis of Doppler ultrasound signals,” Ultrasound Med. Biol., vol. 16, no. 1, pp. 81–91, 1990. [14] Y. B. Ahn and S. B. Park, “Estimation of mean frequency and variance of ultrasonic Doppler signals by using second-order autoregressive model,” IEEE Trans. Ultrason., Ferroelect., Freq. Contr., vol. 38, no. 3, pp. 172–182, 1991. [15] D. H. Evans and W. N. McDicken, Doppler Ultrasound. 2nd ed. New York: Wiley, 2000. [16] R. Andraka, “High performance digital down converters for FPGAs,” Xcell J., no. 38, pp. 48–51, 2000. [17] T. Morganti, S. Ricci, F. Vittone, C. Palombo, and P. Tortoli, “Clinical validation of common carotid artery wall distension assessment based on multigate Doppler processing,” Ultrasound Med. Biol., vol. 31, no. 7, pp. 937–945, 2005. [18] G. Bambi, T. Morganti, S. Ricci, E. Boni, F. Guidi, C. Palombo, and P. Tortoli, “A novel ultrasound instrument for investigation of arterial mechanics,” Ultrasonics, vol. 42, pp. 731–737, 2004. [19] P. Tortoli, F. Guidi, G. Bambi, S. Ricci, and E. Boni, “Spectral profiles for high-resolution hemodynamic ultrasound investigations,” IEEE Trans. Ultrason., Ferroelect., Freq. Contr., vol. 50, no. 3, front cover, 2003. [20] P. J. Brands, A. P. G. Hoeks, L. Hofstra, and R. S. Reneman, “A noninvasive method to estimate wall shear rate using ultrasound,” Ultrasound Med. Biol., vol. 21, no. 2, pp. 171–185, 1995. [21] L. Fan, E. Boni, P. Tortoli, and D. H. Evans, “Development of a dual-gate automatic embolus detection system,” in Proc. IEEE Ultrason. Symp., 2004, vol. 2, pp. 1445–1448. [22] F. Guidi, E. Boni, P. Tortoli, M. Arditi, and P. Frinking, “Acoustic method for real-time visualization of microbubble movements and rupture,” in Proc. IEEE Ultrason. Symp., vol. 2, 2003, pp. 1183–1186.
ricci et al.: programmable system for ultrasound investigation methods [23] W. T. Shi, F. Forsberg, A. Tornes, J. Østensen, and B. Goldberg, “Destruction of contrast microbubbles and the association with inertial cavitation,” Ultrasound Med. Biol., vol. 26, no. 6, pp. 1009–1019, 2000. [24] J. M. G. Borsboom, T. C. Chien, A. Bouakaz, M. Versluis, and N. de Jong, “Harmonic chirp imaging method for ultrasound contrast agent,” IEEE Trans. Ultrason., Ferroelect., Freq. Contr., vol. 52, no. 2, pp. 241–249, 2005. [25] J. S. Thierman, G. T. Clement, and K. Hynynen, “Combined radiation pressure field in a dual-frequency ultrasound system,” in Proc. IEEE Ultrason. Symp., vol. 1, pp. 513–516, 2004. [26] W. C. A. Pereira, S. L. Bridal, A. Coron, and P. Laugier, “Singular spectrum analysis applied to backscattered ultrasound signals from in vitro human cancellous bone specimens,” IEEE Trans. Ultrason., Ferroelect., Freq. Contr., vol. 51, no. 3, pp. 302–312, 2004. [27] M. S. Hughes, J. N. Marsh, C. S. Hall, D. Sav´ery, G. M. Lanza, and S. A. Wickline, “Characterization of digital waveforms using thermodynamic analogs: Applications to detection of materials defects,” IEEE Trans. Ultrason., Ferroelect., Freq. Contr., vol. 55, no. 9, pp. 1555–1564, 2005.
Stefano Ricci (S’99–M’99) was born in Prato, Italy, in 1970. He received the degree in Electronic Engineering in 1997, and the Ph.D. degree in Electronic Systems Engineering in 2001, both from the University of Florence. His research activities, carried out at the Electronics and Telecommunications Department of the Universit` a degli Studi di Firenze in Florence where he currently works as researcher, are focused on the development of high performance digital signal processing systems for applications in radar and ultrasound imaging.
Enrico Boni graduated in Electronic Engineering in 2001 from the University of Florence, Italy. From the same University, he received the Ph.D. degree in 2005. He currently holds a post-Doc position at the Microelectronic Systems Design Laboratory of the University of Florence. His interests include analog/digital systems design and the development of digital signal processing algorithms for application to Doppler ultrasound with emphasis on microemboli detection.
1819
Francesco Guidi has received his degree in Electronic Engineering from the University of Florence, Italy. He first worked for a national company on the design of a real-time radiological image processing system. In 1991 he joined the National Institute of Nuclear Physics (INFN) where he was involved in the design of real-time software for solid state particle detectors located at the CERN collider (ALEPH project). Since 1992, he has taken a position at the Electronics and Telecommunications Department of the University of Florence, where he is also working toward his Ph.D. degree. His current research interests include the development of real-time methods for ultrasound blood flow estimation and the investigation of acoustic properties of ultrasound contrast agents.
Tiziano Morganti was born in Bologna, Italy, in 1977. He received his degree cum laude in electronic engineering from the University of Florence, Italy, in 2002. He is currently pursuing his Ph.D. in electronic systems engineering with an activity concerning the development of a real-time ultrasound system for arterial mechanics investigation. His main research interests are the development of algorithms for real-time measurement of arterial distension, intima-media thickness, and blood flow velocity; and their implementation on PC or custom digital signal processor platforms.
Piero Tortoli (M’91–SM’96) received the Laurea degree in Electronic Engineering from the University of Florence in 1978. Since then, he has been with the Electronics and Telecommunications Department of the University of Florence, where he is currently a full professor of Electronics. His main interests are in the area of signal processing systems with application to biomedical instrumentation. He has published over 120 papers related to his research activity on ultrasonic imaging and Doppler techniques. Piero Tortoli is on the Editorial Board of Ultrasound in Medicine and Biology. He has been a member of the Technical Program Committee of international conferences, including the IEEE International Ultrasonics Symposium. He was also chairman of the 22nd International Symposium on Acoustical Imaging (1995), co-Chairman of the ICB Seminar on Ultrasound in Biomeasurements, Diagnostics and Therapy (1998), and Chairman of the 12th New England Doppler Conference (2003).