prime aspects of the UML modeling domain. .... the domains of all variables. .... transition is enabled only if its timer has expired (i. e., has reached value zero).
A QoS-oriented Extension of UML Statecharts? David N. Jansen1 , Holger Hermanns2,1 , and Joost-Pieter Katoen1 1 2
Universiteit Twente, Postbus 217, 7500 AE Enschede, The Netherlands Universit¨ at des Saarlandes, Im Stadtwald, 66123 Saarbr¨ ucken, Germany {dnjansen,hermanns,katoen}@cs.utwente.nl
Abstract. Performance, dependability and quality of service (QoS) are prime aspects of the UML modeling domain. To capture these aspects effectively in a modeling language requires easy-to-use support for the specification and analysis of randomly varying behaviors. This paper introduces an extension of UML statecharts with randomly varying durations, by enriching a specific syntactic construct: The “after” operator is equipped with (discrete or continuous) probability distributions, determining the duration of the delay caused by this operator. The semantics of this extension is given in terms of a variant of stochastic automata. It is shown how existing model-checking tools can be used to calculate modelinherent QoS characteristics automatically. We study a UML model of an automatic teller machine scenario using this approach.
1
Introduction
Background and motivation. The UML is pervading many challenging engineering areas including real-time and embedded system design. Embedded systems designers are usually facing various challenges if they strive for systems with predictable quality of service (QoS). Most QoS aspects of current embedded systems are time-related features and properties. They are usually referred to as soft real-time constraints, and are of stochastic nature. To incorporate these constraints in the embedded systems design process is a challenging issue [22]: – System dynamics is becoming ever more complex, making it more and more difficult to properly predict the QoS. – The trend to networked embedded systems raises issues like message buffering, inter-dependencies due to media sharing, and communication characteristics, all influencing the system QoS. – Applications involve more and more non-functional features in the form of multimodal interfaces and multimedia support, having impact on the QoS. A workable modeling and analysis approach to embedded system QoS is based on the observation that networks, interfaces, and even circuits on chips [9, 33] can be understood and modeled as discrete systems exhibiting some form of ?
Parts of this work was achieved during the Dagstuhl seminar 03201 ‘Probabilistic Methods in Verification and Planning’ held at IBFI Schloss Dagstuhl in April 2003.
2
David N. Jansen, Holger Hermanns, and Joost-Pieter Katoen
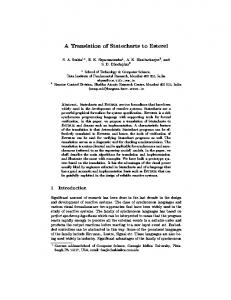
stochastic behavior, such as error rates, response time distributions, or message queue lengths. Mathematically speaking, the QoS characteristics of a given embedded system induce families of stochastic decision processes, e. g. Markov chains or semiMarkov decision processes. However, these mathematical objects are too fine grained to be directly specifiable by an embedded systems designer. Therefore, one must rely on modeling techniques and tools for stochastic processes. While in principle the UML provides the right ingredients to model discrete event dynamic systems, it lacks support for stochastic process modeling. This issue has been addressed in both the UML profile for schedulability, performance and time [31], and in the draft UML profile for modeling QoS and fault tolerance [30]. These profiles suggest annotational extensions of UML providing means to specify performance, dependability and QoS characteristics at various levels. However, the vague semantics of the UML and of its annotational extensions drastically hampers QoS analysis: It is simply impossible to distill a faithful performance or QoS quantity from a stochastic (decision) process that is only partially defined. This means that model-based QoS prediction is only possible for UML fragments with a rigid formal semantics. In this paper, we attack this problem for UML statecharts. We provide a formal semantics of an extension of UML statecharts, the extension being both simple and easy to understand, yet powerful enough to model a sufficiently rich class of stochastic decision processes. The extension is twofold. One extension, first introduced in [20], allows state transitions to select probabilistically out of different effects, much like the rolling of a die can have one out of six effects, determined probabilistically. The second extension is novel, yet simple and conservative: The “after” operator of statecharts is given a stochastic interpretation, allowing the use of arbitrary probability distributions for modeling, such as EXP[10 min] for a negative exponential distribution with a mean of 10 min, or UNIF[10 h, 15 h] for a uniform distribution in the interval from 10 to 15 hours. The resulting statecharts dialect is called StoCharts, and contains UML statecharts (up to some minor features such as deferred events) as a subset. Example 1. Consider the following workflow model of a car damage assessment by an insurance company. In the damage assessment it is decided whether a damaged car should be repaired and whether the garage offers an acceptable price for the repair. To assure customer satisfaction, the insurance company imposes the following QoS requirement: “In at least 95 % of the cases, an entire damage assessment takes less than 4 days.” The damage assessment is split in several mandatory and optional phases which take varying times, and in summary delay the repair of the damaged car. In Fig. 1, the damage assessment is succinctly modeled by a StoChart. Once a workflow starts, the damage assessor contacts a garage. The time this step takes may vary, and it is modeled by an “after” operator parameterized with a negative exponential distribution having a mean duration of one minute. After completion of this delay, the conversation may lead to one out of two outcomes, which are modeled probabilistically. Either a physical assessment date is negotiated (with probability 0.3), or a phone assessment is
A QoS-oriented Extension of UML Statecharts Assessing
Physical assessment
Evaluate assessment date
Idle
start / Contacting garage
after (EXP[1 min])
0.2 P after (EXP[1 min]) 0.8
after(EXP[1,5 days]) Priority
after(EXP[3 days])
Normal
0.3 0.7
P
3
Phone assessment
after (EXP[10 min])
Negotiating with garage
after(UNIF[10 min, 20 min]) Report
Repair after(UNIF[30 min, 90 min]) / end Writing report
Reporting finished
Waiting for invoice
0.98
after (EXP[3 d])
P Checking invoice
0.02 / write off Repair finished
Fig. 1. Damage assessing process
carried out (with probability 0.7). This behavior is modeled graphically by using P C a -pseudonode, a drawing aid inspired by the -pseudonode of [15]. With this probabilistic choice we abstract from a detailed analysis of the reasons that lead to the decision. Dependent on the decision taken, the assessment continues. With the above explanation, the subsequent intuitive behavior should be selfexplanatory.
Technical merits. To make StoCharts a useful tool in QoS modeling and prediction, requires more than a simple extension of UML with an intuitive interpretation. In order to support model-based QoS prediction, a formal mathematical interpretation is indispensable. Otherwise, model-based calculations are not trustworthy. Concretely, we needed to solve various challenges which we report in this paper: (i) The semantic model associated with StoCharts needed to be defined together with semantic mapping which conservatively extends the standard semantics. As in [20], we take as a representative the requirements-level semantics of Eshuis and Wieringa [12], which is based on the Statemate semantics [16] and its formalisation by Damm et al. [10]. We have chosen the requirements-level semantics because it is simple and matches our intended use of the UML closely. (ii) In order to associate a stochastic interpretation to collaborative collections of statecharts embedded in arbitrary environments, we provide a compositional semantics, which uses concepts from Input/Output (I/O) automata [26]. (iii) Our semantic embedding, though rather parsimonious in its scope (just one operator is touched), exploits lessons learned in a decade of research in formal specification of stochastic processes, rooted in the seminal works on stochastic Petri nets [1, 2], stochastic process algebra [14, 18] and probabilistic automata [32]. (iv) We provide experimental evidence that this approach can be used for modeling and model-based prediction of interesting QoS quantities. The QoS characteristics of an automatic teller machine scenario are modelled in the UML extension and the user-perceived QoS is predicted using model-checking. Other model-based
4
David N. Jansen, Holger Hermanns, and Joost-Pieter Katoen
techniques can equally well be applied for QoS prediction, such as simulation or numerical analysis. Related work. Quite some research has been devoted in recent years to enable QoS analysis from UML. Several authors have suggested mappings of statechart fragments onto stochastic Petri nets variants [6, 19, 23, 25], of which the syntax suggested by Lindemann et al. [25] is most similar to ours. This approach does not consider nondeterministic phenomena, while we do. Others have linked to process algebra [28, 8]. Closest to our work is the work reported in [13], since both approaches use variations of stochastic automata as semantic models. In their approach, however, clocks appear as syntactic entities, and are explicitly referenced in the syntax. Our approach instead keeps the syntax unchanged, while timers are used under the hood. Furthermore, we do not limit standard UML statecharts in any way. Organization of the paper. Section 2 introduces our statechart dialect. Section 3 introduces the semantic model, and Section 4 describes a mapping from StoCharts to this model. A larger example of using StoCharts in modeling and analysis is presented in Section 5. Section 6 concludes the paper. In the remainder of this paper, we assume familiarity with basic probability theory [29].
2
StoCharts
This section describes our syntactic extensions to UML statecharts together with their informal interpretation. UML statecharts. A (simple) UML statechart consists of – a set of Nodes, organized as a simple typed tree where nodes are of type ‘basic’ (leafs), ‘and’ , or ‘or’. The root node and children of ‘and’ nodes are of type ‘or’. Each ‘or’ node has a distinguished, initial child node. – a set of Events with the distinguished element ⊥ denoting “no event required”. – a set Vars of (typed) variables or attributes together with an initial valuation V0 : Vars → D, assigning initial values to the variables. Here D subsumes the domains of all variables. – a set Edges of edges. Each edge connects a set of source nodes to a set of target nodes, and is labeled with an event, a guard (a Boolean expression), and a (possibly empty) set of actions (assignments to variables or sending messages to other objects). For analysis purposes, we assume that all these sets are finite and that variable domains are restricted to bounded integers only.
A QoS-oriented Extension of UML Statecharts
5
Our enrichment. We propose to extend statecharts as follows: an “after” operator is considered to indicate random delays, and the notion of edges is refined into probabilistic edges (P-edges) to handle discrete probabilistic branching. The latter concept has recently been introduced by us in [20]. – Like an event, the after-operator acts as a trigger of an edge (or a P-edge) and has as parameter a cumulative distribution function F where F (t) determines the probability to wait at most t time units. – A P-edge is a tuple (X, e, g, P ) where X is a non-empty set of source nodes, e is either an event or an after operator, g is a guard, and P is a function assigning probabilities to pairs consisting of a set A of actions, and a nonempty set Y of target nodes3 . P (A, Y ) denotes the probability of selecting target (A, Y ). To simplify matters, P-edges are indicated by numbers, i. e., we use a bijective index function ι to identify P-edges. When ι(j) = (X0 , e0 , g0 , P0 ), we write ι(j).X for X0 , ι(j).e for e0 etc. We also number StoCharts. A StoChart numbered i is indicated by the tuple (Nodes i , Events i , Vars i , PEdges i ). A P-edge can be projected to a set of ordinary edges in the following way: an edge is a triple (j, A, Y ), where j identifies a P-edge such that (A, Y ) is assigned a positive probability, i. e., P (A, Y ) > 0. The scope of an edge (j, A, Y ) is the smallest (in the parent–child-hierarchy) node that is not affected when the edge is executed. That is, it is the smallest node of type ‘or’ that contains both the source nodes ι(j).X and the target nodes Y . We require all edges (with probability > 0) belonging to a P-edge to have the same scope. This may be understood as: “arrows from a P-pseudonode that cross node borders – like inter-level transitions – should be avoided”. This restriction slightly limits the expressiveness, but eases the semantics considerably. See [20] for an extensive discussion of this issue as well as an alternative, unrestricted semantics. Drawing P-edges. A P-edge consists of two parts: an arrow labeled with an P from which several event and a guard directed to a P-pseudonode (denoted ) arrows to target nodes emanate, each labeled with a probability and an action set. For example, the statechart in Fig. 1 contains a P-edge that starts in node Contacting garage and allows to choose between the targets Phone assessment and Evaluate assessment date. P-pseudonodes are omitted in case the P-edge consists of a single edge that occurs with probability one. Intuitive interpretation. The StoChart is always in some state which consists of one or several nodes. A P-edge may be taken (i. e., is enabled) if all its source nodes are part of the current state, its guard holds, and if either its event happens or the delay associated with its after operation expires. Nondeterministically an enabled P-edge is selected (or a number of non-conflicting ones), and its discrete 3
Formally, P is a probability measure on the discrete probability space (P (Actions i )× (P (Nodes i ) \ { }), P ).
6
David N. Jansen, Holger Hermanns, and Joost-Pieter Katoen
probabilistic choice will be resolved. Once the selected edge is taken, its actions are executed, and its target nodes will be entered. On entering a node with an outgoing P-edge labeled with an after(F ) operation, a sample is taken from distribution F and a timer is set accordingly. The corresponding outgoing edge becomes enabled once the timer expires.
3
Underlying transition model
The formal semantics of StoCharts is defined in terms of an extension of labeled transition systems, basically automata with locations representing the possible configurations of the system, and transitions between locations representing the system’s evolvement. These transition systems are equipped with timers to model probabilistic delays, and with a set of actions to model system activities. The use of timers in transition systems is very much in line with the use of clocks in, e. g., timed automata [4, 27]. While clocks in timed automata run forward at the same pace and are always reset to 0, our timers are initialized by sampling a probability distribution and run backwards, all at the same pace. On the other hand, timers are always checked for expiration (i. e., is the timer equal to zero?), while clocks can be checked in complex conditions. Input and output actions are distinguished to allow for the composition of transition systems, like in I/O-automata [26]. Three types of transition relations are used: input transitions, output transitions, and delay transitions, the latter being enabled once a timer expires. Whereas input and delay transitions are standard ternary relations (input is even a function), the output transition relation is probabilistic. Like in I/O-automata we assume input-enabledness, i. e., in each location any input can be accepted. The resulting model, a stochastic I/O-automaton (Iosa, for short), is a tuple (L, l0 , T , A, I, O, ∆) consisting of: – a set L of locations with initial location l0 ∈ L. – a set T of timers such that each timer t has an associated cumulative distribution function (cdf) Ft . – a set A of actions, partitioned into inputs Ain and outputs Aout . – an input transition relation, described by the function I : L × Ain → L. – a probabilistic output transition relation O ⊆ L × Prob (Aout × P (T ) × L). – a delay transition relation ∆ ⊆ L × T × L. Example 2. Figure 2 depicts an Iosa modeling the behavior of a bank from the perspective of an automatic teller machine (ATM). Output, input and delay transitions are labeled o:, i:, and d:, respectively. The ATM sends a request (action request) to check whether a certain withdrawal is allowed; from the bank’s point of view, this is an input. It needs some time to check the allowance; this is modeled by setting a timer t and waiting until it expires. If the outcome of the check is positive, the ATM may request to actually withdraw the money from the account (withdraw). If the ATM sends a withdrawal request without allowance, the bank moves to an error state.
A QoS-oriented Extension of UML Statecharts
7
i: request
Idle
i: request Preparing to check i: withdraw
o:
1 set t
i: withdraw
Checking
i: withdraw
d: t
Check finished
i: withdraw
o:
0.98, allow
Check positive
0.02, deny
Error
i: withdraw
Fig. 2. Stochastic I/O automaton of the bank behavior
Informal semantics. The interpretation of Iosa uses similar ingredients as the semantics of timed automata [4]. In fact, Iosa are symbolic representations of infinite (probabilistic timed) transition systems [11] where a state consists of a location and a timer valuation, recording the current value of each timer. We only present the intuition behind this interpretation; its formalization can be found in [21]. The behavior of the Iosa begins in its initial location, with every timer being set to a random sample drawn according to its associated distribution. In each state, one enabled transition may be selected for execution. Only if no transition is enabled, time may pass until some transition will be enabled (if any). An output transition is always enabled, an input transition is enabled only if its input action is offered by the environment, and a delay transition is enabled only if its timer has expired (i. e., has reached value zero). If input action a is offered in location l, the unique next location is I(l, a). If timer t expires in location l, delay transition (l, t, l 0 ) may be taken and results in moving to l0 . Output transitions are slightly more involved. To take an output transition emanating from location l, first a probability space P with (l, P) ∈ O is nondeterministically selected. Subsequently, one of the possible targets (a, T, l 0 ) in P, is probabilistically chosen. On taking this transition, action a is generated, all timers in set T are reset and the system evolves to location l 0 . Composition. Compositionality is of utmost importance to enable the use of Iosa in arbitrary embedding contexts. That is to say, each of our extended statecharts can be embedded in any environment, and the semantics of their composite behavior can simply be determined in a modular way. This approach even allows the embedding environment to be specified using a different specification technique provided its interpretation can be given in terms of stochastic I/Oautomata. This differs from our earlier approach [20] where we only considered system randomness for which a closed system approach suffices. In a network of Iosa one automaton is selected (nondeterministically) to take an output transition. This output action immediately triggers corresponding input transitions in the other automata. (By input-enabledness, each automaton can react to the output.) The composite automaton accepts input action a if all its components do so. Conversely, the composite automaton takes a delay transition, if one of its components does so. Composition is defined as a bi-
8
David N. Jansen, Holger Hermanns, and Joost-Pieter Katoen
nary operator; as this operator is associative, it can easily be generalized to finite collections of Iosa. For Iosai = (Li , l0,i , Ti , Ai , Ii , Oi , ∆i ) (with i = 1, 2) with Aout ∩ Aout = ∅, their composite automaton, denoted Iosa1 ⊗ Iosa2 = 1 2 (L, l0 , T , A, I, O, ∆) is defined by:4 – – – –
L = L1 × L2 with initial location l0 = (l0,1 , l0,2 ) T = T 1 ∪ T2 out in out A = A1 ∪ A2 , where Aout = Aout and Ain = (Ain . 1 ∪ A2 1 ∪ A2 ) \ A I is the smallest relation defined by the rule: a ∈ Ain I((l1 , l2 ), a) = (I1 (l1 , a), I2 (l2 , a))
– O is the smallest relation defined by two symmetric rules. We only give the rule where Iosa1 takes the initiative for output: (l1 , P1 ) = (l1 , (Aout 1 × P (T1 ) × L1 , P1 )) ∈ O1 ((l1 , l2 ), P) = ((l1 , l2 ), (Aout × P (T ) × L, P )) ∈ O where P is the probability measure defined by: P ({(a, T, (l1 , I2 (l2 , a)))}) = P1 ({(a, T, l1 )}) if a ∈ Aout and T ⊆ T1 1 and P ({ω}) = 0 otherwise. – ∆ is the smallest relation defined by the two rules: (l1 , t, l10 ) ∈ ∆1 ((l1 , l2 ), t, (l10 , l2 )) ∈ ∆
(l2 , t, l20 ) ∈ ∆2 ((l1 , l2 ), t, (l1 , l20 )) ∈ ∆
Related models. As already mentioned, Iosa are inspired by timed (I/O) automata [4, 27] and probabilistic automata [32]. From another perspective, Iosa extend stochastic automata [11] with discrete probabilistic branching and inputoutput communication. Another strongly related model is probabilistic I/O automata (PIOA) [34]. The main differences between Iosa and PIOA are: All clocks in the latter are governed by negative exponential distributions, while Iosa allow arbitrary distributions. (Despite their name PIOA include stochastic timing.) All choices in PIOA are probabilistic, while Iosa also allow nondeterministic choice. Consequently, a composite PIOA chooses the automaton to produce an output in a probabilistic manner rather than in a non-deterministic manner. Each probabilistic I/O automaton with deterministic input (and no internal actions) can be mapped to an equivalent Iosa; the reverse, however, is not true.
4
Formal semantics
We first describe how for an individual StoChart, steps are selected and executed, and then consider the semantics of a collection of StoCharts. 4
To simplify the notation, we extend I1 and I2 by Ii (li , a) = li if a 6∈ Ai .
A QoS-oriented Extension of UML Statecharts
9
How to construct a step for a single StoChart. A configuration describes the most important part of a StoChart. Configuration Ci of StoChart SCi is a set of nodes containing: the root node, one child for each ‘or’-node in Ci , and all children of all ‘and’-nodes in Ci . The set of configurations of SCi is denoted Conf i . A location of SCi is a triple (Ci , Ii , Vi ) with configuration Ci , event-set Ii (to which still has to be reacted) and valuation Vi : Vars i → D. The set of all valuations of SCi is denoted Val i . The validity of guard g in a location depends on the configurations C1 , . . . , Cn and the valuations V1 , . . . , Vn . We denote by (C1...n , V1...n ) � g that g holds. The set P T of P-edges to be executed has to obey a couple of requirements: all P-edges in P T must be enabled, they must be pairwise consistent, obey the priority constraints, and, finally, P T must be maximal. For a more detailed description of these requirements, see [12, 20]. The following algorithm constructs P T , and probabilistically selects a step from it: Assume that the current location of SCi is (Ci , Ii , Vi ). 1. Calculate the set EnP (Ci , Ii , Vi ) of enabled P-edges. P-edge j is enabled iff: ιi (j).X ⊆ Ci ∧ ιi (j).e ∈ Ii ∪ {⊥} ∧ (C1...n , V1...n ) � ιi (j).g 2. Calculate PSteps(EnP (Ci , Ii , Vi )), where PSteps(E) (for E ⊆ P Edgesi ) contains all maximal, prioritized, consistent sets of P-edges ⊆ E. 3. Select nondeterministically a set of P-edges P T of PSteps(EnP (Ci , Ii , Vi )). 4. Draw samples from the probability spaces of the P-edges in P T , resulting in a set of edges T (called a step). The second and third phases are similar to the nextstep-algorithm in [12]. The last phase can be described by a discrete probability space over P (Edges i ). Its probability measure P is a function on sets of sets defined as follows. For any selection of Aj and Yj (for j ∈ P T ), P ({{(j, Aj , Yj ) | j ∈ P T }}) =
Y
(ιi (j).P )({(Aj , Yj )})
j∈P T
and P ({ω}) = 0 otherwise. Subsequently, the selected steps (in the last phase) are executed. For a single StoChart this amounts to update the variables and events that occur in the activities and to determine the new state. How to construct a step for a collection of StoCharts. Actions of one StoChart may influence events of other StoCharts. This is reflected in the step execution of a collection of StoCharts. The collection of StoCharts (Nodes i , Events i , Vars i , PEdges i )ni=1 is mapped to a single Iosa (L, l0 , C, A, I, O, ∆) as follows: n
– L=
× Conf i × P (Events i ) × Val i
i=1
– l0 = (s0,1 , . . . , s0,n ), where s0,i = (C0,i , ∅, V0,i ) is the initial location of SCi
10
David N. Jansen, Holger Hermanns, and Joost-Pieter Katoen
– For each P-edge ιi (j) with label after(Fij ), there is a timer tij ∈ T with cdf Fij �n � S – Ain = P Events i and �i=1n � S out A =P {i.e | ∃(j, A, Y ) ∈ Edges k : send i.e ∈ A ∧ i 6∈ {1, . . . , n}} k=1
– I is the smallest relation defined by the rule: E∈A E (Ci , Ii , Vi )ni=1 − →
(Ci , Ii ∪ (E ∩ Events i ), Vi )ni=1
– If P Ti = (P (Edges i ) , Pi ) ∈ PSteps(EnP (Ci , Ii , Vi )) for each i, then ((Ci , Ii , Vi )ni=1 , (A × P (C) × L, P )) ∈ O, where P is the probability measure defined by: n Y Pi ({Ti }) P ({(E, T, Execute(C1...n , T1...n , V1...n ))}) = i=1
where E is the set of events that are sent to the environment: n [ E= {i.e | ∃(j, A, Y ) ∈ Tk : send i.e ∈ A ∧ i 6∈ {1, . . . , n}} k=1
and T = {tij | ιi (j) becomes enabled}. Let P ({(E, T, ω)}) = 0 otherwise. – ∆ is defined by the rule: X ⊆ C i0 Ii00
ιi0 (j) = (X, after(Fi0 ,j ), g, P ) ∈ PEdges i0 ∀i 6= i0 : Ii0 = Ii = Ii0 ∪ {after(Fi0 ,j )} ti0 ,j (Ci , Ii , Vi )ni=1 −−−→ (Ci , Ii0 , Vi )ni=1
for some i0 ∈ {1, . . . , n}. Note that the communication mechanism between StoCharts differs from the communication between Iosa. Whereas all StoCharts may take their steps and produce output at once, only one component Iosa of some composite Iosa is allowed to take an output edge at a time. In our context, the composition of Iosa is only used to combine the embedded system under consideration with the embedding environment.
5
StoCharts in action
As an example illustrating how StoCharts can be used for modeling and modelbased QoS prediction, we develop a model of an Automatic Teller Machine (ATM). An ATM (often called “cash dispenser”) distributes money to clients who identify themselves with a personal chip-card and a PIN (personal identification number). We measure whether the ATM satisfies a customer satisfaction requirement. The distributions and probabilities used in this examples should in practice be obtained from statistical analysis of observed behavior, while for this example we decided to use plausible, but ad-hoc chosen, parameters.
A QoS-oriented Extension of UML Statecharts
11
Model. We model a system consisting of three components, (i) the ATM subsystem, (ii) the bank, and (iii) the client. Figure 3 shows a typical interaction of the ATM with its environment (client and bank). The ATM is described by P an UML-statechart in Fig. 4. This statechart contains neither -nodes nor after-delays.5 Since we assume familiarity with standard statecharts, we do not comment on the modelled behavior. We have modelled the bank’s behavior as viewed by the ATM in terms of the Iosa in Fig. 2. To check an account balance takes some time (given by the distribution associated with timer t). With a certain probability (0.98) withdrawing is permitted, and the bank processes withdrawals, otherwise it sends a denial back to the ATM. We abstract from the internal structure of the bank and only model the delays to handle the ATM’s requests. The client’s behavior is also modelled as a StoChart, depicted in Fig. 5. Each action of the client is assumed to take some non-negligible time, denoted in the figure. The client first inserts the card. Then the client is ready to key in the PIN and also the desired amount, the order depending on the type of machine confronted with. There is a probability (0.01) that the user enters the wrong PIN, and similarly the amount of money the client desires to withdraw varies probabilistically. Afterwards, the client awaits the money and the card back (also in either order). If the ATM reports a denial of the bank, the client doesn’t expect any money, but still awaits the chip-card. Model analysis. Model analysis of a collection of StoCharts is based on the analysis of the associated Iosa. This model can be analysed using simulation, or using model-checking. In the most general case model-checking algorithms in the style of [3] are needed. If nondeterminism is absent (which is the case in our example), one can deal with simpler algorithms, such as the ones implemented in ProVer [35]. ProVer estimates probabilities of system requirements up to a user-specified confidence by means of discrete event simulation. If all distributions are exponential, Markov-chain model-checking tools such as Etmcc [17] or Prism [24] are available. These tools calculate probabilities with which certain system requirements are satisfied by the model. As a requirement specification language, all the above tools rely on the stochastic temporal logic Csl [5]. Requirement. We focused on a probabilistic requirement of the following form: “Once the card has been entered, the probability that the client obtains the money within time t is at least p.” This can be considered as a QoS requirement 5
Note that any standard UML statechart is a trivial StoChart.
prompts and questions
Client
ATM
request
card, PIN, amount
allow or deny
money
withdraw
Bank
Fig. 3. A typical interaction of the ATM with its environment
12
David N. Jansen, Holger Hermanns, and Joost-Pieter Katoen / client.prompt "please insert card"
Preparing
Idle
take card / take money / Offering money take card / client. prompt "please take your money" ; client.money(n) Offering card (positive)
allow / bank.withdraw(n) ; client.prompt "please take your card" ; client.card back
stop button / client.prompt "transaction aborted" ; client.card back Offering card (negative) deny / client.prompt "transaction aborted" ; client.card back Waiting for approval
amount(n) / bank.request(n)
card / client.prompt "please enter PIN" Waiting for PIN
wrong PIN / client.prompt "please try again"
correct PIN / client.prompt "How much do you want to withdraw?" Waiting for amount
Fig. 4. The automatic teller machine behavior
imposed by the bank to ensure customer satisfaction. In the temporal logic Csl, this requirement can be formalized as prompt “please insert card” =⇒ P>p (♦6t take money) and can be fed into the Csl model checkers ProVer and Etmcc, which were the tools we used in our studies. The Iosa models associated with the StoChart specifications were generated in a semi-automatic way, and manually fed into the respective model checkers. Experiments. In our experiments we considered two scenarios, a simple one, consisting of one client, one ATM and the bank, and a more complicated one with multiple clients, two ATMs and the bank. In the latter scenario, a mutual exclusion module (not shown in the figures) sequentializes the critical communication between bank (which is a shared resource) and ATMs. With respect to stochastic timing, our basic model assumed that all after-delays are given by exponential distributions with mean durations as listed in the respective figures. If only mean durations are available from domain analysis, the stochastic behavior is known to be reflected best by exponential distributions (since this class of distribution has maximal entropy). But we also experimented with other distributions in the context of ProVer. Results. Some results of our experiments are shown in Fig. 6, where we evaluated the above Csl-requirement for increasing time points t and calculated the boundary probabilities p at which the requirement turns from being true to being false. For a pair (t, p) above a plot the requirement is false, while for pairs below it is true. On the left we see the results obtained with Etmcc for both scenarios (one/two ATMs). We observe that in the second scenario, the probabilities are slightly lower than in the first one, with the maximum difference around 40 seconds (0.58 vs. 0.53). The reason is that although the throughput of the bank is higher with more ATMs, the individual customer perceived delay increases, with the bank being the bottleneck.
A QoS-oriented Extension of UML Statecharts
13
Entering data
Wait 1
prompt "How much do you want to withdraw?"
Wait 4
0.3 / atm.amount(20) after(EXP[10 s])
Entering amount
prompt "please insert card" Inserting card
P
0.5 / atm. amount(50)
amount entered
0.2 / atm.amount(100) Wait 2
prompt "please enter PIN"
after(EXP[2 s]) / atm.card
after(EXP[10 s])
Entering PIN
P
0.99 / atm.correct PIN
PIN entered
0.01 / atm.wrong PIN
prompt "please try again"
Wait 3
prompt "transaction aborted" / Receiving service
Wait 5
money /
Taking money
after(EXP[2 s]) / atm. take money
Money taken
prompt "transaction aborted" /
Wait 6
card back /
Taking card
after(EXP[5 s]) / atm.take card
Card taken
Spending money after(EXP[20 min])
1,0 0,9 0,8 0,7 0,6 0,5 0,4 0,3 0,2 0,1 0,0
Probability
Probability
Fig. 5. The client’s behavior
one ATM two ATMs
0
20
40
60
Time (sec)
80
100
1,0 0,9 0,8 0,7 0,6 0,5 0,4 0,3 0,2 0,1 0,0
exponential uniform
0
20
40
60
80
100
Time (sec)
Fig. 6. The probability to withdraw money within t time units
On the right of Fig. 6 we plotted two graphs generated with ProVer, where the confidence was set to 0.999. The solid curve corresponds to the second scenario (two ATMs) studied with Etmcc, and the numerical results obtained with both tools are very close. This can be considered as a simple sanity check, indicating that the currently manual steps in the tool chain were performed correctly and that ProVer produces rather accurate results. The dashed curve is obtained when replacing all exponential distributions with uniform distributions (over an interval around the mean durations). More precise, each EXP[t] occuring in Fig. 6 is replaced by UNIF[t − 12 t, t + 21 t]. Since there is now some minimum time before significant behavior can take place (with nonzero probability), the calculated probability stays below the other plot for small times. For longer times we are on the other end of the uniform intervals involved, and it
14
David N. Jansen, Holger Hermanns, and Joost-Pieter Katoen
is almost sure (except when the bank refuses the transfer) that the money will have been received.
6
Conclusion
This paper has introduced StoCharts, a simple twofold extension of UML statecharts tailored to QoS modeling and prediction. We have laid out a formal mapping from StoCharts to the Iosa model, a model based on timed, stochastic and probabilistic automata. This mapping provides the basis for faithful modelbased QoS prediction. Care has been taken to define a compositional semantics, making use of I/O automata. Most of the complexity of our semantic mapping is inherited from standard UML statecharts, while the extensions map rather smoothly on the Iosa model. We have exemplified how QoS requirements on a StoChart can be model checked. The tool chain used in the model checking example is incomplete, and a few steps have been performed manually, namely the construction of an Iosa given a set of StoChart and parts of the translations from an Iosa to the input languages of the model checkers, in particular ProVer. We are currently closing the gaps, by integrating the StoChart formalism into the Modest tool environment [7].
References 1. M. Ajmone Marsan, G. Conte, and G. Balbo. A Class of Generalised Stochastic Petri Nets for the Performance Evaluation of Multiprocessor Systems. ACM Transactions on Computer Systems, 2(2):93–122, 1984. 2. M. Ajmone Marsan, G. Balbo, G. Conte, S. Donatelli, and G. Franceschinis. Modeling with Generalized Stochastic Petri Nets. John Wiley & Sons, 1995. 3. L. de Alfaro. Formal Verification of Probabilistic Systems. Ph.D dissertation, Stanford University, 1997. 4. R. Alur and D. Dill. A theory of timed automata. Th. Comp. Sc., 126: 183–235, 1994. 5. C. Baier, B. Haverkort, H. Hermanns, and J.-P. Katoen. Model-checking algorithms for continuous-time Markov chains. IEEE Transactions on Software Engineering, 29(6):524–545, 2003. 6. S. Bernardi, S. Donatelli, and J. Merseguer. From UML sequence diagrams and statecharts to analysable Petri net models. In Workshop on Software and Performance (WOSP), pp. 35–45, ACM Press, 2002. 7. H. Bohnenkamp, H. Hermanns, J.-P. Katoen, and R. Klaren. The Modest modeling tool and its implementation. In P. Kemper and W.H. Sanders, editors, Computer Performance Evaluation, LNCS 2794, 2003. 8. C. Cavenet, S. Gilmore, J. Hillston, and P. Stevens. Performance modelling with UML and stochastic process algebra. In: UK Performance Engineering Workshop (UKPEW), pp. 16 Univ. of Glasgow, UK, 2002. 9. C. Constantinescu. Impact of deep submicron technology on dependability of VLSI circuits. In Dependable Systems and Networks, pp. 205–209. IEEE CS Press, 2002. 10. W. Damm, B. Josko, H. Hungar, and A. Pnueli. A compositional real-time semantics of statemate designs. In Compositionality : the Significant Difference (COMPOS), LNCS 1536: 186–238, 1998.
A QoS-oriented Extension of UML Statecharts
15
11. P. R. D’Argenio, J.-P. Katoen and E. Brinksma. An algebraic approach to the specification of stochastic systems (extended abstract). In Programming Concepts and Methods, pp. 126–147, Chapman & Hall, 1998. 12. R. Eshuis and R. J. Wieringa. Requirements-level semantics for UML statecharts. In Formal Methods for Open Object-Based Distributed Systems (FMOODS), pp. 121–140, Kluwer, 2000. 13. S. Gnesi, D. Latella, and M. Massink. A stochastic extension of a behavioural subset of UML statechart diagrams. In Symposium on High-Assurance Systems Engineering (HASE), pp. 55–64. IEEE CS Press, 2000. 14. N. G¨ otz, U. Herzog and M. Rettelbach. Multiprocessor and Distributed System Design: The Integration of Functional Specification and Performance Analysis Using Stochastic Process Algebras. In Tutorial Proc. PERFORMANCE ’93, LNCS 729: 121–146, 1993. 15. D. Harel and E. Gery. Executable object modeling with statecharts. IEEE Computer, 30(7):31–42, 1997. 16. D. Harel and A. Naamad. The Statemate semantics of statecharts. ACM Transactions on Software Engineering and Methodology, 5(4):293–333, 1996. 17. H. Hermanns, J.-P. Katoen, J. Meyer-Kayser and M. Siegle. A Markov chain model checker. J. on Software Tools and Technology Transfer, 4(2):153–173, 2003. 18. J. Hillston. A Compositional Approach to Performance Modelling. Cambridge Univ. Press, 1996. 19. G. Huszerl, I. Majzik, A. Pataricza, K. Kosmidis, and M. Dal Cin. Quantitative analysis of UML statechart models of dependable systems. The Computer J., 45(3):260–277, 2002. 20. D. N. Jansen, H. Hermanns, and J.-P. Katoen. A probabilistic extension of UML statecharts : specification and verification. In Formal Techniques in Real-Time and Fault-Tolerant Systems (FTRTFT), LNCS 2469: 355–374, 2002. 21. D. N. Jansen. Extensions of Statecharts with Time, Probability, and Stochastic Timing. Ph.D thesis, Univ. of Twente, October 2003. 22. B. Jonsson et al.. Component-based design and integration platforms : Draft roadmap of IST-2001-34820. Advanced Real-Time Systems, 2003. 23. P. King and R. Pooley. Derivation of Petri net performance models from UML specifications of communications software. In Computer Performance Evaluation (TOOLS), LNCS 1786: 262–276, 2000. 24. M. Z. Kwiatkowska, G. Norman, and D. Parker. Probabilistic symbolic model checking with PRISM: A hybrid approach. In Tools and Algorithms for the Construction and Analysis of Algorithms (TACAS), LNCS 2280: 52–66, 2002. 25. C. Lindemann, A. Th¨ ummler, A. Klemm, M. Lohmann, and O. P. Waldhorst. Performance analysis of time-enhanced UML diagrams based on stochastic processes. In Workshop on Software and Performance (WOSP), pp. 25–34, ACM Press, 2002. 26. N. Lynch and M. Tuttle. An introduction to input/output automata. CWI Quaterly, 2(3): 216–246, 1989. 27. N. Lynch and F. Vaandrager. Forward and Backward Simulations : II. TimingBased Systems. Information and Computation, 128: 1–25, 1996. 28. P. Mitton and R. Holton. PEPA performability modelling using UML statecharts. In UK Performance Engineering Workshop (UKPEW), 15 pp. Univ. of Durham, UK, 2000. 29. A. N. Shiryaev. Probability, vol. 95 of Graduate Texts in Mathematics. Springer, New York, 1996. 30. Object Management Group. UML Profile for Modeling Quality of Service and Fault Tolerance Characteristics and Mechanisms : Request for Proposal. 2002. 31. Object Management Group. UML Profile for Schedulability, Performance, and Time Specification. 2002. 32. R. Segala and N.A. Lynch. Probabilistic simulations for probabilistic processes. Nordic J. of Computing, 2(2): 250–273, 1995. 33. D. Tennenhouse. Proactive computing. Comm. of the ACM, 43(5): 43–50, 2000. 34. S.-H. Wu, S. A. Smolka and E. W. Stark. Composition and behaviors of probabilistic I/O automata. Th. Comp. Sc., 176(1/2): 1–38, 1997. 35. H. Younes and R. Simmons. Probabilistic verification of discrete event systems using acceptance sampling. In: Computer-Aided Verification (CAV), LNCS 2404: 223-235, 2002.