ICAS 2012 : The Eighth International Conference on Autonomic and Autonomous Systems
RFDMon: A Real-time and Fault-tolerant Distributed System Monitoring Approach Rajat Mehrotra Electrical and Computer Engineering Mississippi State University Mississippi State, MS, USA Email:
[email protected]
Sherif Abdelwahed Electrical and Computer Engineering Mississippi State University Mississippi State, MS, USA Email:
[email protected]
Abhishek Dubey Institute for Software Integrated Systems Vanderbilt University Nashville, TN, USA Email:
[email protected]
Krisa W. Rowland US Army Engineer Research and Development Center Vicksburg, MS, USA Email:
[email protected]
Abstract—One of the main requirements for building an autonomic system is to have a robust monitoring framework. In this paper, a systematic distributed event based (DEB) system monitoring framework “RFDMon” is presented for measuring system variables (CPU utilization, memory utilization, disk utilization, network utilization, etc.), system health (temperature and voltage of Motherboard and CPU) application performance variables (application response time, queue size, and throughput), and scientific application data structures (PBS information and MPI variables) accurately with minimum latency at a specified rate and with controllable resource utilization. This framework is designed to be tolerant to faults in monitoring framework, self-configuring (can start and stop monitoring the nodes and configure monitors for threshold values/changes for publishing the measurements), aware of execution of the framework on multiple nodes through HEARTBEAT messages, extensive (monitors multiple parameters through periodic and aperiodic sensors), resource constrainable (computational resources can be limited for monitors), and expandable for adding extra monitors on the fly. Since RFDMon uses a Data Distribution Services (DDS) middleware, it can be used for deploying in systems with heterogeneous nodes. Additionally, it provides a functionality to limit the maximum cap on resources consumed by monitoring processes such that it reduces the effect on the availability of resources for the applications. Keywords- Distributed Monitoring; ARINC-653; and Data Distribution Services.
I. I NTRODUCTION Autonomic distributed computing infrastructure imposes requirements of consistency, synchronization, and security over multiple nodes. Additionally, in enterprise domain, there is a tremendous pressure to achieve quality of service (QoS) objectives in all possible scenarios of the system operation. To this end, an aggregate picture of the distributed infrastructure should always be available to analyze and to provide feedback for computing control commands if needed. The desired aggregate picture can be achieved through an infrastructure monitoring system that is extensive enough to accommodate system parameters, application performance, and application data structures.
Copyright (c) IARIA, 2012.
ISBN: 978-1-61208-187-8
The desired monitoring technique should also be customizable for various types of applications and their wide range of parameters. Autonomic management of distributed systems requires an effective monitoring technique, which can work in a distributed manner similar to the underlying system and reports each event to the system administrator with maximum accuracy and minimum latency. Furthermore, the monitoring system should not be a performance burden or interfere with the applications executing in the system. Also, the monitoring system should be robust and should be able to identify the internal faults to isolate the faulty component and correct it immediately. However, typical distributed monitoring techniques suffer from synchronization issues among the nodes, communication delay, non deterministic nature of events, large amount and asynchronous nature of measurements, and limited bandwidth. All of these issues may result into inconsistent global view of the infrastructure. This paper describes a distributed monitoring approach “RFDMon” that utilizes the concepts of OMG Data Distribution Services [1] for an efficient exchange of measurements among the computing nodes. This monitoring framework is built upon the ACM: ARINC-653 Component Framework [2] and an open source DDS implementation, Open splice [3]. The primary principles in design of the proposed approach are static memory allocation for determinism, spatial isolation between monitoring framework and real applications for fault containment, specification, and adherence to real time properties such as periodicity and deadlines in monitoring framework. Experimental results show that “RFDMon” has small overhead on the computational resources of the system. It also identifies the faults in infrastructure and in itself with minimum delay, and reconfigures itself to resume the monitoring of infrastructure without further delay. “RFDMon” can be combined easily with a fault diagnosis module due to its standard interfaces.
57
ICAS 2012 : The Eighth International Conference on Autonomic and Autonomous Systems
Currently, “RFDMon” is installed at Fermi Lab, Batavia, IL for monitoring scientific clusters, which consist of 100 to 800 computing nodes [4]. This approach is utilized in data processing within the Large Quantum Chromo Dynamics (LQCD) project at Fermi Lab [4]. This data processing is carried as analysis campaigns (scientific workflows) that consists of an input dataset and a set of interdependent processing steps (named as jobs). These jobs are executed over large commodity computer clusters. These large clusters can result in systematic failure if operated over a long continuous period of time executing these analysis campaigns. Typical execution time of a campaign may span several months and it executes hundreds of data and computational intensive parallel MPI Jobs that require several computational nodes during its lifetime. A campaign can fail even by failure of a single job. “RFDMon” is used by administrators to diagnose job problems and failures in this complex environment and quickly respond to the intermittent faults. This paper is organized as follows. Preliminary concepts of the proposed approach are presented in Section II. Related distributed monitoring products are described in Section III and detailed description of the proposed approach is given in Section IV. Details of each sensor is presented in Section V and a set of system monitoring experiments is described in Section VI. The major benefits of the approach is highlighted in Section VII and applications of the approach is described in Section VIII. Conclusions are presented in Section IX. II. P RELIMINARIES The proposed monitoring approach “RFDMon” consists of two major modules: Distributed Sensors Framework and Infrastructure Monitoring Database. Distributed Sensors Framework utilizes Data distribution services (DDS) middle-ware standard for communication among the nodes of distributed infrastructure. It uses Opensplice Community Edition [3]. It executes DDS sensor framework on top of ARINC Component Framework [5]. Infrastructure Monitoring Database uses Ruby on Rails [6] to implement a web service that is used to update the database with monitoring data and to display the data on administrator web browser. In this section, the primary concepts of DDS, ARINC-653, and Ruby on Rails are briefly presented. Data Distribution Services: Data Distribution Service (DDS) specifications are defined by Object Management Group [7] for communication in distributed real-time systems through publish-subscribe mechanism. This mechanism overcomes the typical shortcomings of client-server model, where client and servers are tightly coupled. Each message is associated with a topic. In DDS, publishers and subscribers are not coupled to each other. Publishers or subscribers need only the name and definition of the data in order to communicate. Publishers do not need any information about the location or identity of the subscribers, and vice versa. ARINC-653: ARINC-653 software specification has been utilized in safety-critical real time operating systems (RTOS) that are used in avionic systems and recommended for space missions [8]. The specification specifies the OS interfaces
Copyright (c) IARIA, 2012.
ISBN: 978-1-61208-187-8
and its associated services to ensure spatial and temporal separation among various applications for fault-containment in integrated modular avionics [9]. Spatial partitioning ensures exclusive use of a memory region by an application. It guarantees that a faulty process in a partition cannot corrupt or destroy the data structures of other processes that are executing in other partitions. This space partitioning is useful to separate the low-criticality vehicle management components from safety-critical flight control components in avionics systems [2]. Temporal partitioning ensures sharing of computational resources through fixed periodic schedule among multiple applications. ARINC-653 Emulation Library [2] (available to download from [10]) provides a UNIX based implementation of ARINC-653 interface specifications. This scheduling scheme guarantees that a partition will relinquish the CPU after its execution duration has expired. Ruby on Rails: Rails [6] is a web application development framework that uses Ruby programming language [11]. Rails uses Model View Controller (MVC) architecture for application development [12]. In “RFDMon”, a web service is developed to display the monitoring data collected from the distributed infrastructure. These monitoring data includes the information related to clusters, nodes in a cluster, node states, measurements from various sensors on each node, MPI and PBS related data for scientific applications, web application performance, and process accounting. Currently, “RFDMon” is using MYSQL open source database. Other databases (e.g., Sqlite, PostgreSQL, etc) can also be used as per the support in Ruby on Rails. Schema information of the database is shown in [13]. III. OTHER D ISTRIBUTED M ONITORING S YSTEMS Various distributed monitoring systems have been developed by industry and research groups in past many years. Ganglia [14], Nagios [15], Zenoss [16], and Nimsoft [17] are a few most popular enterprise products developed for monitoring distributed systems. Ganglia [14] is developed upon the concept of hierarchical federation of clusters. In this architecture, multiple nodes are grouped as a cluster which is attached to a module, and then multiple clusters are again grouped under a monitoring module. Nodes and applications utilize a multi-cast based listen/announce protocol for sending their measurements to all of the other nodes. The primary advantage of Ganglia is auto-discovery of the nodes, easy portability and manageability, and aggregation of cluster measurements at each node. Nagios [15] is developed upon plug-in based agent/server architecture, where agents can report the abnormal events from the computing nodes to the server node (administrators) through email, SMS, or instant messages. Nagios consists of three components - Scheduler: This is the administrator component that checks the plug-ins and take corrective actions if needed. Plug-in: These small modules are placed on the computing node, configured to monitor a resource, and then send the reading to the “Nagios” server module over SNMP interface. GUI: This is a web based interface that presents the measurements from the system through various colourful buttons, sounds, and graphs.
58
ICAS 2012 : The Eighth International Conference on Autonomic and Autonomous Systems
Zenoss [16] is a model-based monitoring solution that has comprehensive and flexible approach of monitoring with an extremely detailed GUI interface. It is an agentless monitoring approach where central monitoring server collects measurements from each node over SNMP interface through ssh commands. In Zenoss, the computing nodes can be discovered automatically and specified with their types (Xen, VMWare, etc.) that ensures appropriate and complete monitoring using pre-defined templates, thresholds, and event rules. Nimsoft Monitoring Solution [17](NMS) offers a light-weight, reliable, extensive, and GUI based monitoring of the entire infrastructure. NMS uses a message BUS for exchange of messages among the applications residing in the infrastructure. These applications (or components) are configured with the help of a software component (HUB) and are attached to the message BUS. Monitoring action is performed by small probes and the measurements are published to the message BUS by software components (ROBOTS) deployed over each managed device. NMS also provides an Alarm Server for alarm monitoring and a GUI portal to visualize the comprehensive view of the system. These distributed monitoring approaches are significantly scalable in number of nodes, responsive to changes at the nodes, and comprehensive in number of parameters. However, these approaches do not support capping of the resource consumed by the monitoring framework, fault containment in monitoring unit, and expandability of the monitoring approach for new parameters in the already executing framework. Additionally, these approaches are stand-alone and are not easily extendible to associate with other modules that can perform fault diagnosis for the infrastructure at different granularity (application level, system level, and monitoring level). Furthermore, they work in a server/client or host/agent manner (except NMS) that requires direct coupling of two entities, where one entity has to be aware of the location and identity of the other entity. Therefore, “RFDMon” utilizes the data distribution service (DDS) methodology to report the events or monitoring measurements from each node to a central node in a decoupled manner. In “RFDMon”, all monitoring sensors execute on the ARINC-653 Emulator [2]. This enables the monitoring agents to be organized into one or more partitions and each partition has a fixed periodic schedule to use the processing resources (temporal partitioning). The processes executing under each partition can be configured for real-time properties (priority, periodicity, duration, soft/hard deadline, etc.). Additionally, ARINC-653 uses spatial partitioning [9] that ensures exclusive use of a memory region by an ARINC partition and introduces fault containment property in the monitoring framework. The details of the approach are described in later sections of the paper. IV. A RCHITECTURE OF THE FRAMEWORK The proposed monitoring framework “RFDMon” is based upon data centric publish subscribe communication mechanism. Modules (or processes) in the framework are separated from each other through concept of spatial and temporal locality as described in section II. Architecture of “RFDMon”
Copyright (c) IARIA, 2012.
ISBN: 978-1-61208-187-8
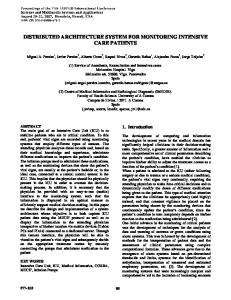
Figure 1.
Architecture of Sensor Framework
is shown in Figure 1. The proposed framework has following key concepts and components. A. Sensors Sensors are the primary component of the framework. These are lightweight processes that monitor a device on the computing nodes and read it periodically or aperiodically to get the measurements. These sensors publish the measurements under a topic (described in next subsection) to DDS domain. There are various types of sensors in the framework which are described in section V. B. Region The proposed monitoring framework organizes the nodes in regions (or clusters). Nodes can be homogeneous or heterogeneous. Nodes are combined only logically. These nodes can be located in a single server rack or on single physical machine (in case of virtualization). However, physical closeness is recommended to combine the nodes in a single region to minimize the unnecessary communication overhead in the network. C. Local Manager Local Manager is a module that is executed as an agent on each computing node of the monitoring framework. These agents are executed on each node with knowledge about its pre-defined region name. However, it is not provided with any information related to other nodes or configuration of the region. The primary responsibility of the local manager is to set up sensor framework on the node. D. Regional Leader Among multiple local manager nodes that belongs to same region, there is a local manager node which is selected as “Regional Leader” for updating the monitoring database for sensor measurements from each local manager. Regional leader will also be responsible for updating the changes in state (UP, DOWN, FRAMEWORK DOWN) of various local manager nodes. Each local manager is supplied with the pre-defined URLs to Ruby on Rails web service for database updates and update is done over http interface using “libcurl” library [18]. However, these URLs are used to update the database only when a local manager is selected as regional leader. Once a regional leader terminates, a new leader will be selected for the region. Selection of the leader is done by Global Membership Manager module as described in Section IV-G. 59
ICAS 2012 : The Eighth International Conference on Autonomic and Autonomous Systems
E. Topics Topics are the primary unit of information exchange in DDS domain. Details about the type of topic (structure definition) and key values (keylist) to identify the different instances of the topic are described in interface definition language (IDL) file. CORBA IDL files are used to promote the interoperability among the monitoring frameworks developed in different programming languages (e.g., C, C++, Java, etc.) using the same interface. Keys can represent arbitrary number of fields in the topic. These topics are categorized in following categories based upon their content. MONITORING INFO: System resource and hardware health monitoring sensors publish measurements under this topic. HEARTBEAT: Heartbeat Sensor uses this topic to publish its heartbeat in the DDS domain to notify the framework that the node is attached to the framework. All nodes which are listening to HEARTBEAT topic can keep track the health condition of other nodes in the framework through this topic. NODE HEALTH INFO: When a Regional Leader node (defined in Section IV-D) detects change in state (UP, DOWN, or FRAMEWORK DOWN) of any other node by observing the change in node’s heartbeat, it publishes a message with NODE HEALTH INFO topic to notify all other nodes regarding change in status of the node. LOCAL COMMAND: This topic is used by the Regional Leader to send the control commands to other local nodes for START, STOP, or POLL the sensors. GLOBAL MEMBERSHIP INFO: This topic is used for communication between local nodes and Global Membership Manager (defined in Section IV-G) for selection of Regional Leader and for providing information related to existence of the leader. PROCESS ACCOUNTING INFO: Process accounting sensor reads records from the process accounting system and publishes the records under this topic. MPI PROCESS INFO: This topic is used to publish the execution state (STARTED, ENDED, KILLED) and MPI or PBS information variables of MPI processes executing on the computing node. WEB APPLICATION INFO: This topic is used to publish the performance measurements of a web application that contains information logged from the web service related to average response time, heap memory usage, number of JAVA threads, and pending requests inside the system. F. Topic Managers Topic Managers are classes that create subscriber or publisher for a pre-defined topic. This publisher publishes the data received from various sensors under the same topic name. Subscriber receives data from the DDS domain under the same topic name and delivers it to underlying application for further processing. G. Global Membership Manager Global Membership Manager (GMM) module is responsible to maintain the membership of each node for a particular region and for selection of a Regional Leader. Once a local node comes alive, it first contacts
Copyright (c) IARIA, 2012.
ISBN: 978-1-61208-187-8
Figure 2. Architecture of Scientific Application Health Monitoring Sensor
the GMM module with node’s region name using topic GLOBAL MEMBERSHIP INFO to get the information regarding Regional Leader. GMM module replies with the name of Regional Leader (if leader exists) or assign the new node as Regional Leader. GMM module updates the leader information in file (“REGIONAL LEADER MAP.txt”) on disk in colon separated format (RegionName:LeaderName). When a local node sends message to GMM module that its leader is dead, GMM module selects a new leader for that region and replies to the Local Node with leader name. This leader re-election functionality enables the fault tolerant nature in the framework with respect to regional leader that ensures periodic update of the infrastructure monitoring database with measurements even in case of leader failure. The leader selection for the region is performed by a single GMM module that ensures that there will be only one leader of a region. Because the leader selection or reselection is performed by communication between only two nodes, this process is unaffected by the size of the region. Communication delay of message exchange in DDS domain is the only factor that can delay the leader selection process. Additionally, other more sophisticated algorithms can be easily plugged into the framework by modifying the GMM module for leader selection. GMM module is executed through a wrapper executable “GMM Monitor” as a child process. “GMM Monitor” keeps track of execution state of the GMM module and starts a fresh instance of GMM module if previous instance terminates due to some error. New instance of the GMM module receives updated data from “REGIONAL LEADER MAP.txt” file. It provides the fault tolerant abilities in the framework with respect to GMM module. V. S ENSOR I MPLEMENTATION The proposed monitoring framework implements various software sensors to monitor system resources, network resources, node states, MPI and PBS related information, and performance of web applications (see Table I). These sensors are executed as a ARINC-653 process on top of the ARINC-653 emulator [2]. All sensors on a node are deployed in a single ARINC-653 partition on top of the ARINC-653 emulator. The ARINC-653 emulator monitors the deadline and schedules the sensors such that their periodicity is maintained. Furthermore, the emulator performs static cyclic scheduling of the ARINC-653 partition of the
60
ICAS 2012 : The Eighth International Conference on Autonomic and Autonomous Systems
Sensor Name CPU Utilization Swap Utilization Ram Utilization Hard Disk Utilization CPU Fan Speed Motherboard Fan Speed CPU Temperature Motherboard Temperature CPU Voltage Motherboard Voltage Network Utilization Network Connection Heartbeat Process Accounting MPI Process Info Web Application Info
Period 30 seconds 30 seconds 30 seconds 30 seconds 30 seconds 10 seconds 10 seconds 10 seconds 10 seconds 10 seconds 10 seconds 30 seconds 30 seconds 30 seconds -1 -1
Description Aggregate utilization of all CPU cores on the machines. Swap space usage on the machines. Memory usage on the machines. Disk usage on the machine. Speed of CPU fan that helps keep the processor cool. Speed of motherboard fan that helps keep the motherboard cool. Temperature of the processor on the machines. Temperature of the motherboard on the machines. Voltage of the processor on the machines. Voltage of the motherboard on the machines. Bandwidth utilization of each network card. Number of TCP connections on the machines. Periodic liveness messages. Periodic sensor that publishes the commands executed on the system. Aperiodic sensor that reports the change in state of the MPI Processes. Aperiodic sensor that reports the performance data of Web Application. Table I L IST OF M ONITORING S ENSORS
local manager. The schedule is specified in terms of a hyper period, the phase and the duration of execution in that hyper period [13]. Effectively, it limits the maximum CPU utilization of the local managers. Sensors are constructed with following attributes: Name: Name of the sensor (e.g., UtilizationAggregatecpuScalar). Source Device: Name of the device to monitor for the measurements (e.g., “/proc/stat”). Period: Periodicity of the sensor (e.g., 10 seconds for periodic sensors and −1 for aperiodic sensors). Deadline: A sensor has to finish its work within a specified deadline. A HARD deadline violation is an error that requires intervention from the underlying middle-ware while a SOFT deadline violation results in a warning. Priority: Sensor priority indicates the priority of scheduling the sensor over other processes in to the system. In general, normal (base) priority is assigned to the sensor. Dead Band: Sensor reports the value only if the difference between current value and previous recorded value becomes greater than the specified sensor dead band. It reduces the number of sensor measurements in the DDS domain if sensor measurement is changing slightly. Sensors support three types of commands for publishing the measurement: START, STOP, and POLL. START command starts the already initialized sensor to start publishing the sensor measurements. STOP command stops the sensor thread to stop publishing the measurement. POLL command tries to get the latest measurement from the sensor. Sensors publish the data as per the predefined topic to the DDS domain (e.g., MONITORING INFO). Sensors are categorized based upon their functionality as follows. System Resource Utilization Monitoring Sensors: These sensors monitor utilization of the system resources: CPU, RAM, Disk, Swap, and Network. These sensors (periodic in nature), follow SOFT deadlines, contain normal priority, and provide monitoring of system devices (e.g., /proc/stat) to collect the measurements. These sensors publish the measurements under MONITORING INFO topic. Hardware Health Monitoring Sensors: These sensors monitor health of the system hardware components: CPU Fan Speed, CPU Temperature, Motherboard Temperature,
Copyright (c) IARIA, 2012.
ISBN: 978-1-61208-187-8
and Motherboard voltage. These sensors are periodic.Theses follow soft deadlines, contain normal priority, and read the measurements over Intelligent Platform Management Interface (IPMI) interface [19]. These sensors publish the measurements under MONITORING INFO topic. Node Health Monitoring Sensors: Each local manager executes a Heartbeat sensor that periodically sends its own node name to DDS domain under topic “HEARTBEAT” to inform other nodes regarding its existence in the framework. Scientific Application Health Monitoring Sensor: This Sensor logs the information in case of state change (Started, Killed, Ended) of the processes related to scientific applications and reports the data to the centralized database. In the proposed framework, a wrapper application (SciAppManager) is developed that can execute the real scientific applications (e.g., SciAPP in Figure 2) internally as a child process. MPI “run command” is issued to execute SciAppManager application from master nodes in the cluster (see Figure 2). SciAppManager writes the state information of scientific application in a POSIX message queue that exists on each node. Scientific application sensor will listen on that message queue and publishes message to the DDS domain under MPI PROCESS INFO topic. Web Application Performance Monitoring Sensor: This sensor keeps track of performance behaviour of the web application executing over the node through the web server performance logs written to a POSIX message queue (different from SciAppManager). This sensor will listen on that message queue and publishes the message to the DDS domain under WEB APPLICATION INFO topic. VI. E XPERIMENTS A set of experiments have been performed to exhibit the system resource overhead, fault adaptive nature, and responsiveness towards fault in the developed monitoring framework. During these experiments, the monitoring framework is deployed in a Linux environment (2.6.18-274.7.1.el5xen) that consists of five nodes (ddshost1, ddsnode1, ddsnode2, ddsnode3, and ddsnode4). Ruby on Rails based web service and MYSQL database are hosted on ddshost1 node. These experiments have been performed to measure the impact of executing monitoring framework over the computational
61
ICAS 2012 : The Eighth International Conference on Autonomic and Autonomous Systems
Figure 5. Figure 3.
CPU and RAM Utilization by the Sensor Framework at Nodes
Figure 4. State Transition of Nodes and Leaders of the Sensor Framework.
resources (e.g., CPU and RAM) of system and to display the fault tolerant and self-configure properties of the framework in case of failures in the framework itself. In one of these experiments, all of the nodes (ddshost1, and ddsnode1..4) are started one by one with a random time interval. Once all the nodes have started executing the framework, local manager on a few nodes are killed through KILL system call. During this experiment, the CPU and RAM consumption by local manager at each node is monitored through “TOP” system command. Results from the experiment are presented in Figures 3, 4, and 5. Figure 3 describes the CPU and RAM utilization by monitoring framework (local manager) at each node during the experiment. It is evident from Figure 3 that CPU utilization is mostly in the range of 0 to 1 percent with occasional spikes. However, even in case of spikes, CPU utilization is under ten percent. Similarly, RAM utilization by the monitoring framework is less than even two percent. These results clearly indicates that overall resource overhead of the developed monitoring approach “RFDMon” is extremely low. As mentioned earlier, it is possible to cap this resource usage by specifying the hyper period and duration of execution of the local manager within the hyper period. However, due to space constraints this experiment is not shown in the paper. More details are available in [13]. Transition of various nodes between states UP and FRAMEWORK DOWN is shown in Figure 4. According to the figure, ddshost1 is started first, then followed by ddsnode1, ddsnode2, ddsnode3, and ddsnode4. ddshost1 is selected as the regional leader in the beginning. At time sample 310 (approximately), local manager of host ddshost1 was killed, therefore its state has been updated to FRAMEWORK DOWN. Similarly, state of ddsnode2 and ddsnode3 is also updated to FRAMEWORK DOWN once
Copyright (c) IARIA, 2012.
ISBN: 978-1-61208-187-8
CPU Utilization at node ddsnode1 during the Experiment
their local manager is killed on time sample 390 and 410 respectively. local manager at ddshost1 is again started at time sample 440; therefore its state is updated to UP at the same time. Figure 4 also represents the nodes which were regional leaders during the experiment. According to the figure, initially ddshost1 was the leader of the region, while as soon as local manager at ddshost1 is killed at time sample 310 (see Figure 4), ddsnode4 is elected as the new leader of the region (as per the procedure specified in Section IV-G). Similarly, when local manager of the ddsnode4 is killed at time sample 520 (see Figure 4), ddshost1 is again elected as the leader of the region. From Figure 4, it is clearly evident that as soon as there is a fault in the framework related to the regional leader, a new leader is elected instantly without any further delay. This specific feature of the monitoring framework exhibit that it is robust with respect to failures of the regional leader and it can adapt to the faults in the framework instantly without delay. Sensor framework at ddsnode1 was allowed to execute during the complete experiment (see Figure 4) and no fault was introduced in this node. The primary purpose of executing this node continuously was to observe the impact of introducing faults in the framework over monitoring capabilities of the framework. In the most ideal scenario, entire monitoring data of ddsnode1 should be reported to the centralized database without any interruption even in case of faults (leader re-election and nodes going out of the framework). Figure 5 shows the CPU utilization of ddsnode1 from the centralized database as reported by regional leader through CPU monitoring sensor from ddsnode1. According to the Figure 5, monitoring data from ddsnode1 was collected successfully during the entire experiment. Even in case of Regional Leader re-election at time sample 310 and 520 (see Figure 4), only one or two (max) data samples are missing from the database (see Figure 5). Henceforth, it is evident that there is a minimal impact of faults in the framework over the monitoring functionality of the framework. VII. B ENEFITS OF THE APPROACH “RFDMon” can monitor system resources, hardware health, node availability, MPI job state, and application performance data in a comprehensive manner. “RFDMon” is easily scalable with the number of nodes because it is based upon data centric publish-subscribe mechanism. Publishsubscribe mechanism is extremely scalable with respect to number of nodes. Also, in proposed framework, new sensors can be easily added to increase the number of monitoring parameters. It is fault tolerant with respect to faults in the framework due to partial outage (if regional leader or global membership manager terminates). It can
62
ICAS 2012 : The Eighth International Conference on Autonomic and Autonomous Systems
self-configure (Start, Stop, and Poll) the sensors and can be applied in the heterogeneous environment. The major benefit of using this framework is that the total resource consumption by the sensors can be limited by applying ARINC653 scheduling policies and due to spatial isolation features of ARINC-653 emulation, monitoring framework will not corrupt the memory area or data structures of applications in execution on the node. Additionally, framework has a small computational overhead. VIII. A PPLICATION OF THE F RAMEWORK The initial version of the proposed approach was combined with a hierarchical workflow management system in [20] to monitor the scientific workflows for failure recovery. Another direct implementation of “RFDMon” is presented in [21] where virtual machine monitoring tools and a model based predictive controller were combined with the proposed monitoring framework to manage the multi-dimensional QoS data for a multi-tier web service. An extended version of this paper is available as technical report [13]. IX. C ONCLUSION AND F UTURE W ORK In this paper, detailed design of “RFDMon” is presented. “RFDMon” is a real-time and fault-tolerant distributed system monitoring approach based upon data centric publishsubscribe paradigm. Basic concepts of OpenSplice DDS, ARINC-653, and Ruby on Rails are also described in the paper. Additionally, it is shown that “RFDMon” can efficiently and accurately monitor the system resource consumption, system health, application performance variables, and scientific application data structures with minimum latency. Furthermore, fault tolerance and self configurable properties of “RFDMon” is also demonstrated through experiments. An administrator can easily find the location and possible causes of the faults in system by visualizing the measurements. To make this fault identification and diagnosis procedure autonomic, we are developing a fault diagnosis module that can detect or predict the faults in the infrastructure by observing and co-relating the various sensor measurements. Additionally, we are developing a selfconfiguring hierarchical control framework (extension of our work in [22]) to manage multi-dimensional QoS parameters in multi-tier web service environment. X. ACKNOWLEDGEMENT R. Mehrotra and S. Abdelwahed are supported for this work from NSF I/UCRC CGI Program grant number IIP1034897 and The Engineer Research and Development Center (ERDC) at Vicksburg, MS. A. Dubey is supported in part by Fermi National Accelerator Laboratory, operated by Fermi Research Alliance, LLC under contract No. DEAC02-07CH11359 with the United States Department of Energy (DoE), and by DoE SciDAC program under the contract No. DOE DE-FC02-06 ER41442. We are grateful to the help and guidance provided by T. Bapty, S. Neema, J. Kowalkowski, J. Simone, D. Holmgren, A. Singh, N. Seenu and R. Herber. Copyright (c) IARIA, 2012.
ISBN: 978-1-61208-187-8
R EFERENCES [1] Catalog of omg data distribution service (dds) specifications. http://www.omg.org/technology/documents/ dds spec catalog.htm [Nov 2010]. [2] Abhishek Dubey, Gabor Karsai, and Nagabhushan Mahadevan. A component model for hard real-time systems: Ccm with arinc-653. Software: Practice and Experience, 41(12):1517–1550, 2011. [3] Opensplice dds community edition. http://www. prismtech.com/opensplice/opensplice-dds-community. [4] Fermilab lattice gauge theory computational facility. http://www.usqcd.org/fnal/ [Nov 2010]. [5] Arinc specification 653-2 : Avionics application software standard interface part 1required services. Technical report, Annapolis, MD, December 2005. [6] Ruby on rails. http://rubyonrails.org/ [Sep 2011]. [7] Object management group. http://www.omg.org/ [Nov 2010]. [8] Nuno Diniz and Jose Rufino. Arinc 653 in space. In Proceedings of the DASIA 2005 ”Data Systems in Aerospace” Conference, May/June 2005. [9] A. Goldberg and G. Horvath. Software fault protection with arinc 653. In Aerospace Conference, 2007 IEEE, pages 1 –11, March 2007. [10] Model-based software health management. https://wiki. isis.vanderbilt.edu/mbshm/index.php/Main Page [Nov 2011]. [11] Ruby. http://www.ruby-lang.org/en/ [Sep 2011]. [12] J. Deacon. Model-view-controller (mvc) architecture. JOHN DEACON Computer Systems Development, Consulting & Training, 2005. [13] Abhishek Dubey Rajat Mehrotra and Sherif Abdelwahed. Rfdmon: A real-time and fault-tolerant distributed system monitoring approach. Technical Report ISIS11-107, Institute for Software Integrated Systems, Vanderbilt University, Oct 2011. [14] Ganglia. http://ganglia.sourceforge.net/ [Sep 2011]. [15] Nagios. http://www.nagios.org/ [Sep 2011]. [16] Zenoss. http://www.zenoss.com/ [Sep 2011]. [17] Nimsoft unified manager. http://www.nimsoft.com/ solutions/nimsoft-unified-manager [Nov 2011]. [18] Curl. http://curl.haxx.se/ [Nov 2011]. [19] Intelligent platform management interface (ipmi). http: //www.intel.com/design/servers/ipmi/ [Sep 2011]. [20] Pan Pan, Abhishek Dubey, and Luciano Piccoli. Dynamic workflow management and monitoring using dds. In 7th International Workshop on Engineering of Autonomic & Autonomous Systems (EASe), 2010. [21] Rajat Mehrotra, Abhishek Dubey, Sherif Abdelwahed, and Weston Monceaux. Large scale monitoring and online analysis in a distributed virtualized environment. Engineering of Autonomic and Autonomous Systems, IEEE International Workshop on, 0:1–9, 2011. [22] Rajat Mehrotra, Abhishek Dubey, Sherif Abdelwahed, and Asser Tantawi. A Power-aware Modeling and Autonomic Management Framework for Distributed Computing Systems. CRC Press, 2011.
63


![Distributed Power Monitoring System [DPMS] – EasyPower](https://m.moam.info/img/260x300/distributed-power-monitoring-system-dpms-easypower_5992bd091723ddd069fb288c.jpg)


