1464
IEEE TRANSACTIONS ON INSTRUMENTATION AND MEASUREMENT, VOL. 47, NO. 6, DECEMBER 1998
A Real-Time System for Power Quality Testing A. Lakshmikanth, Member, IEEE, Medhat M. Morcos, Senior Member, IEEE, and Warren N. White, Jr.
Abstract—This paper presents a real-time system that can be used for quick and reliable power quality testing. The system is based on a dual-processor architecture with a digital signal processor (DSP) interfaced to a personal computer (PC). Realtime tasks are delegated to run on the optimized hardware of the DSP board, while system-level requirements are handled by the PC. The real-time processing (RTP) kernel implemented on the DSP supports multitasking to handle tasks associated with data collection, data analysis, and interprocessor communication. The results of real-time analysis are presented in the PC through a menu-driven, graphical interface. Tests show that the system complies with IEC standards for power quality monitoring. This system offers many significant advantages. Real-time analysis of acquired data significantly reduces storage requirements. Data analysis algorithms can be modified to suit specific testing needs. Test results available in the PC can be exported to other computer analysis tools. The system is portable and holds promise as a powerful, low-cost tool for practicing power quality engineers. Index Terms—Digital signal processor (DSP), instrumentation, monitoring, power electronics, power quality, real-time, testing, Windows.
I. INTRODUCTION
E
LECTRIC power quality has captured increasing attention in power engineering in the recent years. The term power quality refers to a wide variety of electromagnetic phenomena which characterize the voltage and current at a given time and at a given location on a power system [1]. Very broadly, power quality is concerned with maintaining the near sinusoidal waveform of power distribution bus voltages at rated voltage magnitude and frequency [2]. Power quality disturbances can range from impulses with rise times in the microsecond range, to long-duration variations in voltage magnitude [3]. The wide range of power quality concerns imposes special requirements for monitoring equipment, and creates a need for sophisticated software to analyze the data recorded [4]. Conventional monitoring systems focus on steady-state voltages and currents, and therefore, fall short of accommodating the full spectrum of power quality variations that impact customer equipment. Therefore, there is an imminent need for a power quality measurement system that can be used to perform quick and reliable power quality surveys. In this paper, we will describe a DSP-based real-time power quality testing system that will enable power quality engineers Manuscript received November 16, 1998. This work was supported by the Engineering Experiment Station at Kansas State University. A. Lakshmikanth and M. M. Morcos are with the Department of Electrical and Computer Engineering, Kansas State University, Manhattan, KS 66506 USA (e-mail:
[email protected]). W. N. White, Jr. is with the Department of Mechanical Engineering, Kansas State University, Manhattan, KS 66506 USA. Publisher Item Identifier S 0018-9456(98)09693-4.
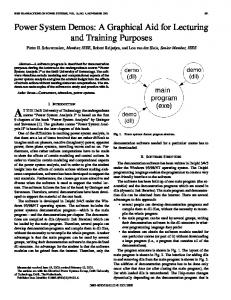
Fig. 1. Block diagram of power quality testing system.
to conduct diagnostic testing in the field, and will comply with the IEC Standard 1000-4-7 [5]. The system will • monitor waveform distortion, short-duration variations, and long-duration variations; • collect data continuously and analyze the data in realtime; • present results effectively and also make data easily available for further study; • be programmable so that custom testing can be incorporated; • be cost-effective and portable. We will discuss the design and implementation of the system, and provide detailed information on testing. We will not deal with issues regarding selection of transducers or monitoring locations, or discuss systematic data collection efforts or advanced data analysis techniques. II. SYSTEM DESIGN The goal in system design is to synthesize a system architecture that will accommodate the needs of the application at hand. The objectives of this study dictate several requirements. The primary concern is to have enough processing power to meet the computational requirements of the real-time tasks associated with power quality monitoring [6]. The system must be easy to implement, flexible, and cost-effective. In addition, the system should have a good user-interface. The dual-processor architecture meets these requirements [7]. This architecture is based on a DSP interfaced to a host computer. Real-time tasks are delegated to run on the optimized hardware of the DSP, while system-level requirements, such as user-interface, are implemented on the host computer. In actual field tests, the host will be the power quality engineer’s laptop (or notebook) computer. The block diagram of the system is shown in Fig. 1. III. SOFTWARE DEVELOPMENT FOR
THE
DSP
DSP’s deliver high performance provided the software running on the processor facilitates such performance. Programming with DSP’s presents some unique issues because
0018–9456/98$10.00 1998 IEEE
LAKSHMIKANTH et al.: REAL-TIME SYSTEM FOR POWER QUALITY TESTING
1465
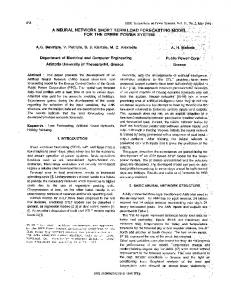
1) timer and interrupt service routine (ISR); 2) idle-loop processing; 3) application message loop. The main window of the application has menu choices that allow the user to save collected data, select the type of data processing to be performed, view real-time results, and access on-line help. Real-time results are available through dialog boxes such as the one shown in Fig. 5. V. TEST RESULTS Fig. 2. Real-time processing kernel.
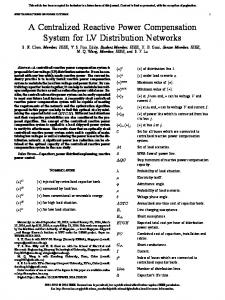
of the specialized architecture of the DSP’s, and the nature of applications. In real-time applications, the best approach is to use a judicious mixture of high-level language (HLL) and assembly [8]. HLL code is used for initialization and nonrealtime code [9]. Time-critical tasks are coded in assembly. The framework for the power quality testing application was developed using C and the real-time data-collection, dataanalysis, and communication tasks were coded in assembly. The basic environment for processing is provided by the real-time processing (RTP) kernel [10]. The kernel provides a mixed environment, and supports multitasking to handle the tasks associated with data collection, data analysis, and communication. Fig. 2 shows the principal elements of RTP. A. Real-Time Tasks The four fundamental tasks to be accomplished in real-time are as follows. 1) Data Acquisition: Samples of the test signal are acquired from the A/D converter which has a resolution of 0.1 mV. The timer interrupt rate in RTP is set such that approximately 64 samples are acquired in a 60 Hz cycle. Due to limitations of the timer in the DSP, the actual sampling frequency of 3906.25 Hz corresponds to a fundamental frequency of 61.04 Hz. 2) Data Buffering: A double buffer is implemented to manage real-time data. 3) Data Analysis: Since sampling is not strictly synchronized with the fundamental frequency of the measured signal, it is necessary to use a Hann window with half-by-half overlap between successive windows [5]. Once the window shape is applied to a block of 512 data points, the FFT routine is executed. The routine used is a 512-point, in-place, radix-2, decimation-in-time FFT. 4) Communication: In this task, the results of real-time spectral analysis are passed on to the host PC. Fig. 3 shows how these tasks are scheduled in RTP. IV. PROCESSING ENVIRONMENT
IN THE
PC
The processing environment in the PC was developed in Windows 3.1 using the Microsoft foundation class (MFC) library. The tools provided with the Windows operating system are used to develop a real-time processing environment. The three basic components in this environment, as shown in Fig. 4, are
There were two principal objectives for the testing exercise: 1) to determine whether the system complies with the IEC standards for power quality instrumentation and 2) to quantize the measurement errors using elementary test signals. The system was first calibrated to meet the accuracy requirements. Then, tests were performed to determine the attenuation capabilities. Output spectra, for sine and square wave inputs at different frequencies, were observed and compared with corresponding theoretical spectra. Finally, measurement errors for different power quality indexes were determined. A. Accuracy Requirements IEC Standard 1000-4-7 suggests two classes of accuracy for instruments measuring voltage and current harmonics—Class A and Class B. The maximum allowable measurement errors, for each of these classes, are listed in [5]. The power quality testing system was calibrated to meet the accuracy requirements of Class A instruments. A singlefrequency signal of 1-V peak magnitude, corresponding to a harmonic in the operating frequency range of the system, was applied. The output at the applied frequency was adjusted using a calibration factor to read 1 V. This process was repeated for frequencies up to the 31st harmonic. B. Attenuation Requirements The attenuation requirements in IEC 1000-4-7 specify the desired rejection of fundamental and other harmonic components. These requirements define the minimum attenuation ( where is the supply funwith reference to damental frequency) which is the frequency of the harmonic of order to be measured. The power quality testing system was tested for attenuation capabilities. A single-frequency signal of 1-V peak magnitude, in the operating frequency corresponding to a harmonic range of the system, was applied. The attenuation at the neighboring harmonic was measured. This process was repeated for frequencies up to the 31st harmonic and the minimum attenuation measured was noted. The minimum attenuation, among all frequencies, for a 1-V peak magnitude signal at was also noted. The results are the fundamental frequency shown in Table I. The system at least matches the requirements specified in [5]. C. Outputs for Test Signals The output spectra for different test signals were observed. The input signals were set to have 1-V peak amplitude. The
1466
IEEE TRANSACTIONS ON INSTRUMENTATION AND MEASUREMENT, VOL. 47, NO. 6, DECEMBER 1998
Fig. 3. Real-time tasks.
TABLE I MEASURED ATTENUATION
Fig. 4. Processing environment in the PC.
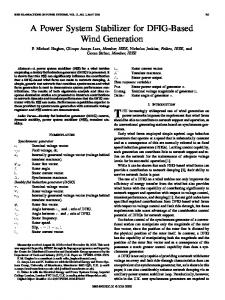
The results are quite accurate for the lower-order harmonics. However, as the order of the harmonic increases, the experimental magnitudes are less than the theoretical values. This can be explained by the fact that the fundamental frequency (61.04 Hz) corresponding to the sampling rate does not match the fundamental frequency of the input signal (60 Hz). Consequently, the FFT algorithm distributes the power at each harmonic frequency of the input signal among the available adjoining frequencies (corresponding to sampling frequency). The effect of such spreading is more noticeable at higher frequencies because the difference between the signal harmonic frequency and the corresponding harmonic frequency for the sampling rate is larger. D. Power Quality Indexes Fig. 5. Power quality indexes dialog.
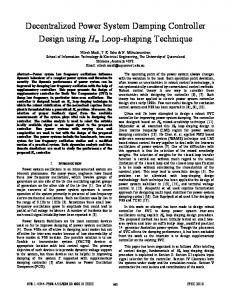
signal generator used was accurate up to 0.01 V in this range. So, only the first two decimal places in the output will be noted; the resolution of the testing system is 0.1 mV. Fig. 6 compares the theoretical and experimental spectra for a 60 Hz square wave. Table II compares the theoretical and experimental magnitude spectra for this input signal up to the 15th harmonic.
Power quality indexes were observed for an input 1-V peak square wave at 60 Hz. The theoretical values of the indexes were computed. Table III shows a comparison of the theoretical and experimental values. The error is less than 2% in all cases. E. Discussion Test results show that the system meets the accuracy and attenuation requirements specified in the IEC standards. Exper-
LAKSHMIKANTH et al.: REAL-TIME SYSTEM FOR POWER QUALITY TESTING
1467
Fig. 6. Spectrum for a 60 Hz square wave. TABLE II MAGNITUDE SPECTRUM FOR A 60 Hz SQUARE WAVE
TABLE III POWER QUALITY INDEXES FOR A 60 Hz SQUARE WAVE
specified in the standards. Overall, the system performance exceeds the guidelines put forth in the standards. Some limitations should also be noted. An antialiasing lowpass filter, to eliminate frequencies higher than the operating range of the instrument, was not used during testing because the test signals themselves were band-limited. Before using the instrument to conduct power quality surveys, it is essential to include an antialiasing filter [11]. We have noted that, since there is no strict synchronization between the sampling rate and the fundamental frequency of signal, higher frequency harmonics appear attenuated. This problem can be overcome by using a phase-locked loop (PLL) at the front end. VI. CONCLUSIONS imental spectra for test signals closely match the corresponding theoretical spectra. The errors in the power quality indexes calculated for the test signals are well within the 5% tolerance
AND
RECOMMENDATIONS
In this project, a real-time power quality testing system was designed, implemented, and evaluated. The prototype can continuously monitor one input signal with a nominal full scale
1468
IEEE TRANSACTIONS ON INSTRUMENTATION AND MEASUREMENT, VOL. 47, NO. 6, DECEMBER 1998
of 2 V - , a dynamic range of 4 V - , and a resolution of 0.1 mV. The system can determine up to the 31st harmonic of the power frequency and can compute important power quality indexes. Results are available in real-time through a graphical user-interface. Tests show that the measurement error is less than the maximum allowable error of 5%. The system also meets the attenuation requirements for time-domain instruments. The system can be used to perform diagnostic power quality testing to evaluate waveform distortion, short-duration variations, and long-duration variations. The DSP can handle signals from multiple-input channels simultaneously. Using a multichannel A/D board, monitoring three-phase voltage and current signals is possible. When voltage and current signals are simultaneously monitored, harmonic power flow can be computed. A shared-memory interface or a direct memory access (DMA) scheme can be implemented to speed up interprocessor communication. The presentation software running on the PC can be enhanced. ACKNOWLEDGMENT The authors would like to thank Dr. S. A. Dyer, Department of Electrical and Computer Engineering, Kansas State University, for his useful suggestions. REFERENCES [1] IEEE P1159/Draft 6a, “Recommended practice on monitoring electric power quality,” Apr. 1995. [2] A. Domijan, G. T. Heydt, A. P. S. Meliopoulos, S. S. Venkata, and S. West, “Directions of research on electric power quality,” IEEE Trans. Power Delivery, vol. 8, pp. 429–436, Jan. 1993. [3] D. G. Flinn, C. Gilker, and S. R. Mendis, “Methods for identifying potential power quality problems,” in Proc. Rural Expo. Tech Day, Feb. 1991, pp. C1-1–C1-5. [4] R. Dwyer, M. McGranaghan, and C. Melhorn, “A guide to monitoring distribution power quality,” EPRI Rep., TR-103208, Apr. 1994. [5] IEC 1000-4-7, “General guide on harmonics and inter-harmonics measurements and instrumentation, for power supply systems and equipment connected thereto,” July 1991. [6] J. Gou, B. Xie, and P. Enjeti, “A DSP based real-time power quality measurement system,” in Proc. IEEE Applied Power Electronics Conf., 1992, pp. 299–302. [7] D. Koenig, “Digital signal processing fundamentals,” Application Note 023, National Instruments, June 1995.
[8] M. A. R. Saghir, P. Chow, and C. G. Lee, “Application-driven design of DSP architectures and compilers,” in Proc. IEEE Int. Conf. Acoustics, Speech Signal Processing, 1994, pp. 437–440. [9] D. Mah, “Using DSP in bus-based test and measurement,” in Proc. National Electronic Packaging Production Conf., Feb. 1992, pp. 1334–1343. [10] K. D. Funk, L. E. Wagner, and J. G. Thompson, “Real-time data acquisition and control techniques for automated testing,” in Amer. Soc. Agricultural Engineers Winter Meeting, 1989, paper 893561. [11] G. T. Heydt, Electric Power Quality. Scottsdale, AZ: Stars in a Circle, 1991.
A. Lakshmikanth (S’92–M’97) received the B.E. degree in electrical and electronics engineering from Anna University, India, and the M.S. degree in electrical engineering from Kansas State University, Manhattan, in 1994 and 1996, respectively. He is currently with Cambridge Technology Partners, Cambridge, MA. His interests include power electronics, power quality, microcomputer-based systems, and software engineering. Mr. Lakshmikanth is a member of Phi Kappa Phi and Tau Beta Pi.
Medhat M. Morcos (M’78–SM’86) received the B.S. and M.S. degrees in electrical engineering from Cairo University, Cairo, Egypt, and the Ph.D. degree in electrical engineering from the University of Waterloo, Waterloo, Ont., Canada, in 1966, 1978, and 1984, respectively. From 1966 to 1981, he was an Avionics Engineer in the Egyptian Air Force. In 1985, he was an Associate Professor of electrical engineering at the Egyptian Air Force Academy. In 1986, he joined the faculty of the Department of Electrical and Computer Engineering, Kansas State University, Manhattan. His current research includes power electronics, power quality, and high voltage engineering. Dr. Morcos is a member of the American Society for Engineering Education, Eta Kappa Nu, Sigma Xi, Tau Beta Pi, and Phi Kappa Phi.
Warren N. White, Jr. received the B.S. degree with honors in electrical engineering from Tulane University, New Orleans, LA, in 1974, the M.E. degree in electrical power engineering from Rensselaer Polytechnic Institute, Troy, NY, in 1977, and the Ph.D. degree in mechanical engineering from Tulane University in 1985. From 1974 to 1978, he was with the Large Steam Turbine Generator and Power Transformer Departments of General Electric. Since 1985, he has been a faculty member of the Mechanical Engineering Department, Kansas State University, Manhattan, where he is currently an Associate Professor. His interests include control theory, numerical methods, and microcomputers.