Session R3E
A Remote Experimental Setup for performing Experiments on Temperature Sensors Ashish Mani1
and
Abstract - Remote laboratories are gaining considerable attention and acceptance in the academic world. Most of the work reported on implementation of Remote labs has been related to labs on control systems and to a certain extent to labs on Electronics Engineering. Therefore, in this paper we have described the design and implementation of a remote experimental setup for performing experiments on Sensors, specifically Temperature Sensors, from a remote location. The traditional experimental setup was interfaced with a Personal Computer, which acts as the Lab server, using data acquisition card (DAQ Card) and software programs written in LabVIEW. The PC was connected to the LAN / Internet and the experiment was published on the network using the LabVIEW Web publishing and Internet Tool box and G and Web Servers. Thus the experiment has been made accessible to anyone, over a TCP/IP network, with a standard Web Browser, relevant plug-in and permission. The aim was to control and change the temperature of the bath in which the temperature sensors were inserted for their characterization, and further collect data from the resulting change in the temperature sensor’s output. In Temperature Sensors characterization experiments, the temperature was varied over their working range on an aluminum plate and the output voltages of the Temperature Sensors (including the signal conditioner) were recorded for each variation in temperature. The remote client could control the bath’s temperature and monitor the temperature of the bath and transducers’ output in real time. This work demonstrates that traditional experiments, especially in the field of sensors and transducers can be successfully made available online. They can provide both on-campus and off-campus students with flexibility to do the experiments at their own schedule and convenience. Index Terms – Remote Laboratories, Temperature Sensors, LabVIEW, Servers. 1. INTRODUCTION The rapid advancement in Information and Communication Technologies (ICT), availability of quality infrastructure and cheap services have led to exponential expansion of
C. Patvardhan2 applications of ICT in almost all the fields of endeavor. ICT have brought about a significant change in the life style of individuals by providing easy connectivity and access to information. The world of education has also been greatly affected by advancements in ICT. It has enabled a variety of new avenues and methodologies for enhancing the experience of learning and teaching in both the types of programs for imparting education viz. Traditional Classroom & Distance Education (DE) Program. Therefore, ICT have the potential to make the higher and specialized education affordable for larger pool of students. It is well known that relevant laboratory experience can significantly improve the students’ learning and interest level in the course material in the traditional as well as DE programs. This is particularly true for courses like Science and Engineering. The students of Science and Engineering need laboratories for measurement, data collection, analysis and experience of handling equipment and other physical devices [1]. The laboratory experience is essential for developing better understanding, problem solving skills and skills of minute observation in students. However, the effective integration of relevant experiments into courses remains the most challenging aspect of any program due to constraints of time and space and limited resources available for the provision of laboratory infrastructure. A cost effective and technologically feasible solution to this problem is to use Information and Communication Technologies for providing Laboratory experience. Remote labs are equipped with real instruments where experiments can be performed by controlling the instruments and observing the real data from a distant location through the network. They simplify the logistics and requirements involved in conventional lab work, including scheduling of equipment, lab space, staffing, training and safety. Students can conduct the experiment from any computer on the network at their own schedule. It can provide for efficient sharing of expensive laboratory resources [2]. Many universities have developed Internet-based remote laboratories [2-17]. Most of the efforts on implementation of Remote labs have been related to the experiments on study of control systems [2-10] and to a certain extent to the experiments on study of Electronics Engineering [11-17].
1
Lecturer, USIC, Dayalbagh Educational Institute, Dayalbagh, Agra-5, India,
[email protected] Reader, Dept. of Electrical Engg., Faculty of Engineering., Dayalbagh Educational Institute, Dayalbagh, Agra-5, India,
[email protected]
2
San Juan, PR
July 23 – 28, 2006 9th International Conference on Engineering Education R3E-13
Session R3E However, in this paper we are concerned with experiments on study of Sensors, specifically Temperature Sensors.
described. The results and conclusions and future work are discussed in Sections 5 and 6 respectively.
There are different approaches of developing Remote Laboratories using LabVIEW as illustrated in [10, 18] as well as other proprietary platforms [2, 5, 13].
2
LabVIEW is one of the well known packages used for development of Remote Labs. Most of the work reported so far uses Internet Tool Kit and DataSocket etc. for developing remote labs which require clients to have software, developed in LabVIEW [8], i.e. Fat Clients are required. In contrast, this paper focuses on using the Thin Client technology in development of the remote lab, which needs a standard web browser with relevant plugins as Client. Thus, simplifying the client side, so that students can concentrate on experiment rather than on learning the client interface. The work reported is mainly concerned with some issues in setting up of a remote experimental setup for characterization of Temperature Sensors. There are two modes in which the experiments are performed viz. Live Mode and File Mode. In the Live Mode, the student gains control of the experimental setup, therefore only one student can perform the experiment at any time and others can view it. But in File Mode, many students can perform experiments. The File Mode is different and better than simulations as the real experimental data, which is stored in file from previous similar experimental runs, are provided. If the students perform experiments in File Mode, they gain understanding of how to do the experiments. Further, if they either perform the experiments or view the experiments being performed in Live Mode, then they gain complete understanding & feel of the actual experiments. The inclusion of the two modes reduces the waiting time of students for performing Live experiment and increases the effective utilization of the experimental setup as viewing also then becomes a significant contributor to learning. The experiments, that are currently available in both Live and File Modes, are as follows: • Characterization of Semiconductor Temperature Sensor (STS). • Characterization of Thermocouple. • Characterization of Resistance Temperature Detector (RTD). • Comparison of characteristic curve of STS & Thermocouple • Comparison of characteristic curve of STS & RTD • Comparison of characteristic curve of RTD & Thermocouple The rest of the paper is organized as follows. Section 2 describes the overall system architecture. The hardware part is discussed in Section 3. In Section 4, the software developed is
SYSTEM ARCHITECTURE OVERVIEW
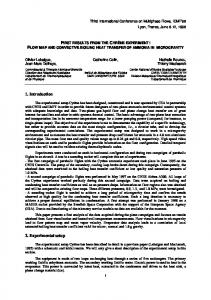
The objective of the Temperature Sensors’ Characterization experiments is to determine the output voltage of the temperature sensors (along with their signal conditioner) with change in the temperature. The experiments can be performed in the two modes as discussed above. In case of the Live Mode, the experimental setup comprises of the temperature sensors, that are inserted in a bath containing an aluminum plate fitted with two heaters and a fan. It also has a Voltage Controlled Power Supply (VCPS). This experimental setup is interfaced with the Lab Server through a Data Acquisition (DAQ) Card. The Lab Server is connected to the LAN / Internet. The experimental setup can be controlled from any remote PC connected on LAN/Internet. The Remote experimental setup is based on Client-Server Architecture. The Industry Standard TCP/IP protocol is used for communication between remote PC and Lab Server. LabVIEW Web Server is used for hosting web pages. The G Server is used for handling CGI requests. The server programs are developed using LabVIEW. The web pages are developed from VI using Web Publishing tools in LabVIEW. A software based controller written in LabVIEW is used for controlling the temperature during the experiment. The temperature is measured using a calibrated RTD based circuit which includes a signal conditioner and digital display circuit. The temperature is displayed through an inexpensive USB Web camera, which is interfaced with the server program using NI Vision toolkit. The Graphical User Interface (GUI) of the experiment is developed using LabVIEW as it provides rich repository of customizable objects. The temperature sensors whose characteristics are to be determined, are connected through their signal conditioners to the Lab Server by using DAQ card’s analog input channels so that output voltage of the temperature sensors at a particular temperature can be measured. The readings of temperature and corresponding output voltage(s) of temperature sensor(s) can be recorded to plot the characteristic curve(s). Further, the temperature is measured through another analog channel of the DAQ card by connecting the output voltage of calibrated RTD based circuit. Thereby the values of both temperature and corresponding output voltages can be stored for future reference and the characteristic curve can also be plotted as experiment is being performed. The hardware block diagram of the Experimental Setup is shown in Figure 1. In case of File Mode, the traditional experimental setup’s hardware is replaced with a File, which has the real data stored from previous Live Mode experimental runs. Therefore, the traditional experimental setup’s hardware is not required.
San Juan, PR
July 23 – 28, 2006 9th International Conference on Engineering Education R3E-14
Session R3E The software block diagram of the Experimental Setup is shown in Figure 2. Digital Display
Client PC #1
Web Cam
NET
Client PC #N
RTDs
AI DAQ CARD
Remote Lab Server
Signal Conditioner-1
tolerance of +0.1oC. The signal conditioner used for RTD gives an output voltage of 0V corresponding to 0oC and 8V corresponding to 250oC, which can be easily read with the DAQ card being used. The proportionality constant is 32mV/oC.
AO
AI
AI
VCPS
Signal Conditioner-2
Actuator (Heater & Fan) STS
TC
Signal Conditioner-3
Web Browser Client Side Server Side Authentication
Experiment Selection & Authorization
FIGURE 1 HARDWARE BLOCK DIAGRAM OF REMOTE EXPERIMENTAL SETUP
3
HARDWARE
The hardware used in implementing the Remote Experimental Setup are temperature sensors and signal conditioners, bath containing aluminum plate fitted with two 50W heaters and one fan of 5W, DAQ card, an inexpensive USB Web Camera, Lab Server, Network and Remote Computers. 3.1 TEMPERATURE SENSORS AND SIGNAL CONDITIONERS The devices which convert the temperature into electrical quantity are called as temperature sensors like Resistance Temperature Detector (RTD), Thermocouple and Semiconductor Temperature Sensor (STS). A signal conditioner is a device which converts one physical quantity into another physical quantity which is more suitable for a specific application [21]. The STS used in this experimental setup is Phillips KTY83110, which has positive temperature coefficient of 0.75%/oC and can operate over a temperature range of -55oC to 175oC with nominal resistance of 1000 Ohms (25oC & 1mA) and maximum tolerance of 1%. The signal conditioner for STS gives output voltage of 0V corresponding to 0oC and 8V corresponding to 150oC, which can be easily read with the Data Acquisition (DAQ) card being used. The proportionality constant is 53.3mV/oC. The Thermocouple used in this experimental setup is the FeConstantan type (type J), which has a temperature range of 0oC to 760oC and its Transduction constant is 53µV/oC. The signal conditioner used for Thermocouple gives an output voltage of 0 V corresponding to 0oC and 8V corresponding to 250oC, which can be easily read with the DAQ card being used. The proportionality constant is 32mV/oC.
File Mode Experiments’ VI
Live Mode Experiments’ VI
#1
#2
#1
#2
#3
#4
#3
#4
#5
#6
#5
#6
Sub-VIs
Sub-VIs
FIGURE 2 SOFTWARE BLOCK DIAGRAM OF REMOTE EXPERIMENTAL SETUP
3.2 LAB SERVER AND NETWORK The Lab Server comprises of a PC with Pentium IV, 2.8 GHz processor, 1 GB RAM, Network Interface Card and National Instruments DAQ Board PCI6070E which has been used for interfacing the experimental setup along with SC-2075 Bread Board Connector Block. The server is connected to DEI-NET, Dayalbagh Educational Institute’s LAN. DEI-NET has backbone of Fiber Optic cable, which run to all the Departments’ and Centres’ local switches and the end PCs are mostly connected through CAT-5e cables. In some of the Labs, Wireless networking is also available. 3.3 REMOTE COMPUTERS Different configurations of Pentium based computers including Laptops with Windows Operating System and Internet Explorer have been used for performing experiments in both Live & File Modes.
The RTD used in this experimental setup is Pt-100 3-wire platinum thermoresistance, which has a temperature range of 0oC to 250oC with nominal resistance of 100 Ohm at 0oC and a San Juan, PR 9th International Conference on Engineering Education R3E-15
July 23 – 28, 2006
Session R3E 4
SOFTWARE
4.2 PROGRAM FUNCTIONAL DESCRIPTION
The software for Remote Temperature Sensors’ Characterization experiments is developed using LabVIEW. The software comprises of Graphical User Interfaces, Programs, VI Web and G Servers and Remote Panel Connection Manager for administration of clients. 4.1 GRAPHICAL USER INTERFACE An intuitive Graphical User Interface (GUI) with steep and short learning curve is essential for any Remote experimental facility as it would not only facilitate in performing experiments but would also encourage the students to perform experiments without any supervision and traditional help. The programs developed in LabVIEW are known as Virtual Instrument (VI) which have two main parts viz. front panel and block diagram. The front panel can be used to develop intuitive GUI as LabVIEW provides rich in built and customizable objects. There are three levels of GUI viz. the Authentication GUI, Experiment Selection and Authorization GUI and the Experiment GUIs. The Authentication GUI is used for logging in the Remote lab. The Experiment Selection and Authorization GUIs are used for gaining control of the experiment to be performed in Live or File Mode. The Experiment GUIs are used for performing the experiments. The Experiment GUI is the user interface for performing experiment. The Experiment GUI for Characterization of STS is shown below in Figure 3. It consists of indicators which are showing the output voltage from STS circuit (which includes signal conditioner), the temperature as measured by RTD (calibrated circuit with its signal conditioner) and web camera image capture of temperature being displayed on Digital Display. There is an option for plotting the characteristic curve, while the experiment is being conducted, in the graphical indicator. It also consists of controls to change the temperature of the aluminum plate. It has option for saving the measurements in a spreadsheet file, whose path is show in the indicator. Similarly, there are GUIs for other experiments also.
The Lab Server program is used for authenticating and authorizing the students for performing experiments in Live or File Mode. If a request for performing experiment in Live Mode is made and the experimental setup is free then it is assigned for duration of 10 minutes. If the experimental setup is not available for controlling, the request is put on hold and would be catered as soon as the experimental setup could be made available for controlling. Optionally, the student can view an ongoing Live experiment. Alternatively, the student can perform the experiment in File Mode as these can be performed concurrently. After getting authorization to perform experiment in Live Mode, the relevant Experiment VI is launched. The student is expected to set the temperature in the Set-Temperature control box at which the reading is to be taken. The voltages are read from analog input channels at every 200ms interval, which are connected to the sensors’ signal conditioner’s output. The output voltage of RTD signal conditioner’s output is converted to temperature by following equation. Tm = Vin1 x 103 / 32 oC where Tm is the measured temperature, Vin1 is the voltage measured in volts at analog channel-1 from DAQ card. 32 mV/oC is the proportionality constant of the RTD’s signal conditioner. The output voltage of sensor signal conditioner’s output is Vini, where Vini is the voltage measured at analog channel-i from DAQ card. Vini is the voltage produced by the sensors’ circuits under test at the temperature indicated by RTD circuit. The readings of actual temperature & voltage(s) are displayed at the set temperature. There is no requirement of delay to ensure that all the sensors are at aluminum plate’s temperature as the sensors are continuously in contact with the bath and the thermal time constant of bath (around 30 minutes) is much larger than thermal time constant of sensors (around 30 seconds). The Sensor(s) characteristic curve(s) is a plot of set of values of Tm V/s Vini. The temperature of the bath can be changed from the GUI by using the SetTemperature control box. The controller takes the input from the Set-Temperature control and the measured temperature Tm to determine the control action. It controls Heater and Fan through analog output of DAQ card. The settings of controller are preset to reduce the complexity of the experiment. The graphical indicator can show the trail on the graph by plotting all the previous values of Tm & Vinis in every iteration, if the option Show Trail is selected. Alternatively, it can display only the point corresponding to the present value of Tm & Vini(s) by only plotting the present values in every iteration, if the option Hide Trail is selected.
FIGURE 3 USER INTERFACE FOR STS CHARACTERIZATION EXPERIMENT
The readings of Tm & Vini can be saved in a spreadsheet file if the option Save is selected. The path of spreadsheet file is displayed in the indicator in GUI. The file–name is asked from
San Juan, PR
July 23 – 28, 2006 9th International Conference on Engineering Education R3E-16
Session R3E the student and file by the name is opened with a reference number in a FTP accessible directory. The reference number is used for further writing to the file, if the user selects to store the data in the file. When VI finally terminates execution, it closes the file. This file can be obtained by a distant user through FTP services. The image from the web-cam is captured and displayed on the GUI continuously through the use of IMAQ for USB camera and NI Vision Tool. NI-IMAQ for USB Cameras provides the ability to use USB cameras that have Direct Show Filters with the NI Vision Assistant or LabVIEW and IMAQ Vision. The cameras may operate at various resolutions and frame rates, depending on camera capabilities. NI-IMAQ for USB Cameras can acquire and set properties using the camera manufacturer driver and Direct Show functions [19]. The block diagram is shown in Figure 4.
5
RESULTS
The prototype experimental setup has been made available to a group of students from Faculty of Engineering, pursuing the course on Instrumentation. They have been able to perform the experiments both in Live & File Modes successfully. The responses received from the students were very encouraging, however, they were more inquisitive and keen on learning about the implementation of the Remote experimental setup. The snapshot of the experiment performed in Live Mode on the STS characterization is shown in Figure 5. The experimental data, which was saved during the experiment in a file, has been used to plot the characterization curve off-line using MS-Excel program is also shown in Figure 6. Thus it would be helpful in preparation of reports.
4.3 LABVEIW INTERNET TOOLKIT, G AND WEB SERVERS AND REMOTE PANEL CONNECTION MANAGER LabVIEW Web Server is used for hosting the Web pages. The web pages are mostly created using the Web Publishing Tool, which creates an HTML document of front panel. The G Server is used for handling the CGI request. The CGI protocol is implemented using Internet Toolkit. The CGI protocol is used for dynamically creating Web pages and also for launching the VIs. The Remote Panel Connection Manager is used for administration purposes like configuring the VI for viewing and control by remote browser clients.
FIGURE 5 SNAPSHOT OF STS CHARACTERIZATION EXPERIMENT IN LIVE MODE
Temperature V/s Voltage 8 7 6
Voltage
5 4 3 2 1 0 0
50
100
150
200
250
o
Temperature( C)
FIGURE 6 STS CHARACTERIZATION CURVE PLOTTED OFF-LINE
6
FIGURE 4 BLOCK DIAGRAM FOR STS CHARACTERIZATION EXPERIMENT
CONCLUSIONS AND FUTURE WORK
A remote experimental setup has been successfully developed for performing experiments on Temperature sensors characterization. The work demonstrates that traditional
San Juan, PR
July 23 – 28, 2006 9th International Conference on Engineering Education R3E-17
Session R3E experiments, especially in the field of sensors and transducers can be successfully made available online. They provide students with flexibility to do the experiments at their own schedule and convenience. Further, the architecture and framework designed in this work can be extended in making the experiments on other sensors also available online. The future work would focus on including experiments on different sensors and transducers in Remote Lab. ACKNOWLEDGEMENT We are extremely grateful to Most Revered Dr. P. S. Satasangi Sahab, Chairman Advisory Committee on Education, Dayalbagh, for continuous guidance and support in our every endeavor. We are thankful to Prof. V. G. Das, Director, Dayalbagh Educational Institute, Dr. Surat Kumar, Dean, Faculty of Engineering, Prof. V. P. Pyara, Head, Electrical Engineering Department and Dr. S. P. Satsangee, Incharge USIC for encouragement and support. We also thank Mr. Rahul S. Sharma, Mr. P. S. Sudhish and Mr. V. R. Srivastava for their help at various stages of this project.
[12] Yi Z., Jian-Jun J. and Shao-Chun F., “A LabVIEW-Based, Interactive Virtual Laboratory for Electronic Engineering Education”, International Journal of Engineering Education, Vol. 21, No. 1, pp. 94-102, 2005. [13] Deniz D. Z., Bulancak A. and Ozcan G., “A Novel Approach to Remote Laboratories”, 33rd ASEE/IEEE Frontiers in Education Conference, November 5-8, 2003, Boulder, CO. [14] Blanton W.M., “Distance Learning Opportunities for Electronic Engineering Technology Graduates of Community Colleges”, Proceedings of ASEE Annual Conference, 2004. [15] Sapijaszko C. & Sapijaszko G.I., “An Innovative Electronics Laboratory System for On Campus and Distance Learning Applications”, Proceedings of ASEE Annual Conference, 2004. [16] Gustavsson I., “User-defined Electrical Experiments in a Remote Laboratory”, Proceedings of ASEE Annual Conference, 2003. [17] Gustavsson I., “A Remote Access Laboratory for Electrical Circuit Experiments”, International Journal of Engineering Education, Vol. 19, No. 3, pp. 409-419, 2003. [18] Naghedolfeizi M., Arora S., & Garcia S., “Survey of LabVIEW Technologies for building Web/Internet – Enabled Experimental Setups”, Proceedings of ASEE Annual Conference, 2002. [19] Distance-Learning Remote Laboratories using LabVIEW. Retrieved from ni.com. [20] National Instruments LabVIEW User Manual. [21] Elettronica Veneta’s Temperature Control and Transducer Module’s Manual.
REFERENCES [1]
Fiesel L. D. and Rosa A. J., “The Role of the Laboratory in Undergraduate Engineering Education”, Journal of Engineering Education, January 2005, pp 121-130. [2] Viedma G., Dancy I. J., and Lundberg K. H., “A Web-Based LinearSystem iLab”, American Control Conference 2005, available on MIT’s website. [3] Ko C. C., Chen B. M., Chen J, Zhang J and Tan K. C., “A Web-Based Laboratory on Control of a Two-Degrees-of-Freedom Helicopter”, International Journal of Engineering Education, Volume 21, No. 6, pp 1017-1030, 2005. [4] Casini M., Prattichizzo D and Vicino A, “The Auotomatic Control Telelab: A User-Friendly Interface for Distance Learning”, IEEE Transactions on Education, Vol. 46, No. 2, May 2003. [5] Nagdhy F, Vial P. and Taylor N., “Embedded Internet Laboratory”, International Journal of Engineering Education, Vol. 19, No. 3, pp. 427432, 2003. [6] Henry J. and Knight C., “Modern Engineering Laboratories at a Distance”, International Journal of Engineering Education, Vol. 19, No. 3, pp. 403408, 2003. [7] The Cockpit: An Effective Metaphor for Web-based Experimentation in Engineering Education”, International Journal of Engineering Education, Vol. 19, No. 3, pp. 389-397, 2003. [8] Rezaei E.K. & Kolla S.R., “Internet-Base ON/OFF Controller Using LabVIEW”, Proceedings of ASEE Annual Conference, 2003. [9] Tan K. K., Lee T. H. and Leu F. M., “Development of a Distant Laboratory using LabVIEW”, International Journal of Engineering Education, Vol. 16, No. 3. [10] Azad A.K.M., Otieno A., Ghrayeb O. & Anand N., “Internet Based Experiments for Physical Laboratory Set-up”, Proceedings of ASEE Annual Conference, 2003. [11] Gustavsson I, Zackrisson J., Akesson H., Hakansson L., Claesson I. and Lago T., “Remote Operation and Control of Traditional Laboratory Equipment”, iJOE International Journal of Online Engineering – www.ijoe.org.
San Juan, PR
July 23 – 28, 2006 9th International Conference on Engineering Education R3E-18