remote sensing Article
A Remote Sensing Data Based Artificial Neural Network Approach for Predicting Climate-Sensitive Infectious Disease Outbreaks: A Case Study of Human Brucellosis Jiao Wang 1,2,† , Peng Jia 3, *,† , Diego F. Cuadros 4,5 , Min Xu 6 , Xianliang Wang 2 , Weidong Guo 7 , Boris A. Portnov 8 , Yuhai Bao 9 , Yushan Chang 9 , Genxin Song 1 , Nan Chen 10 and Alfred Stein 3 ID 1
2 3 4 5 6 7 8 9 10
* †
Key Laboratory of Geospatial Technology for the Middle and Lower Yellow River Regions, Ministry of Education, Henan University, Kaifeng 475004, China;
[email protected] (J.W.);
[email protected] (G.S.) National Institute of Environmental Health, Chinese Center for Disease Control and Prevention, Beijing 100021, China;
[email protected] Department of Earth Observation Science, Faculty of Geo-Information Science and Earth Observation, University of Twente, Enschede 7500, The Netherlands;
[email protected] Department of Geography and Geographic Information Science, University of Cincinnati, Cincinnati, OH 45221, USA;
[email protected] Health Geography and Disease Modeling Laboratory, University of Cincinnati, Cincinnati, OH 45221, USA State Key Laboratory of Remote Sensing Science, Institute of Remote Sensing and Digital Earth, Chinese Academy of Sciences, Beijing 100101, China;
[email protected] Inner Mongolia Center for Disease Control and Prevention, Hohhot 010031, China;
[email protected] Department of Natural Resources and Environmental Management, Faculty of Management, University of Haifa, Haifa 3498838, Israel;
[email protected] Inner Mongolian Key Laboratory of Remote Sensing and GIS, Inner Mongolia Normal University, Hohhot 010022, China;
[email protected] (Y.B.);
[email protected] (Y.C.) Key Laboratory of Spatial Data Mining & Information Sharing of Ministry of Education, Fuzhou University, Fuzhou 350003, China;
[email protected] Correspondence:
[email protected]; Tel.: +31-5-3489-4038 These two authors contributed equally to this work.
Received: 30 June 2017; Accepted: 22 September 2017; Published: 30 September 2017
Abstract: Remote sensing technologies can accurately capture environmental characteristics, and together with environmental modeling approaches, help to predict climate-sensitive infectious disease outbreaks. Brucellosis remains rampant worldwide in both domesticated animals and humans. This study used human brucellosis (HB) as a test case to identify important environmental determinants of the disease and predict its outbreaks. A novel artificial neural network (ANN) model was developed, using annual county-level numbers of HB cases and data on 37 environmental variables, potentially associated with HB in Inner Mongolia, China. Data from 2006 to 2008 were used to train, validate and test the model, while data for 2009–2010 were used to assess the model’s performance. The Enhanced Vegetation Index was identified as the most important predictor of HB incidence, followed by land surface temperature and other temperature- and precipitation-related variables. The suitable ecological niche of HB was modeled based on these predictors. Model estimates were found to be in good agreement with reported numbers of HB cases in both the model development and assessment phases. The study suggests that HB outbreaks may be predicted, with a reasonable degree of accuracy, using the ANN model and environmental variables obtained from satellite data. The study deepened the understanding of environmental determinants of HB and advanced the methodology for prediction of climate-sensitive infectious disease outbreaks.
Remote Sens. 2017, 9, 1018; doi:10.3390/rs9101018
www.mdpi.com/journal/remotesensing
Remote Sens. 2017, 9, 1018
2 of 17
Keywords: infectious disease; climate-sensitive; artificial neural network (ANN); remote sensing; brucellosis; disease outbreak prediction; environmental health; Inner Mongolia
1. Introduction Brucellosis, an infectious disease caused by bacteria of the genus Brucella, remains rampant worldwide in both domesticated animals and humans, especially in the Mediterranean region, Asia, the Middle East, Sub-Saharan Africa, Latin America and the Balkan Peninsula [1–3]. Over 500,000 new cases of human brucellosis (HB) are reported each year, with the incidence rate of more than 10 cases per 100,000 residents in some countries [4]. Despite relatively low mortality rates, brucellosis can lead to reduced milk and meat production and subsequent economic losses [5]. Humans become infected with brucellosis via two main pathways: (1) by contact with animals that carry the pathogenic bacteria of the genus Brucella, or with infectious materials during animal husbandry and meat processing; and (2) by consuming unpasteurized dairy products [6]. The infection attacks the immune system and results in symptoms, including weaknesses and disabilities, which can trigger a substantial increase in medical costs and a decrease in productivity [1]. When untreated or treated inappropriately, brucellosis can cause non-specific flu-like symptoms and more severe health complications in different organs [7]. The incurred costs and impacts on human health call for HB eradication and control measures [8]. As one of the largest agricultural countries in the world, China has reported cases of HB in 25 out of its 34 provinces (or autonomous regions) over the past years, with an average annual economic loss of more than CNY 10 billion (approximately $145 million US dollars) caused directly by brucellosis [9]. Among these provinces, the Inner Mongolia Autonomous Region in northern China has been severely affected by brucellosis in both humans and livestock since 1999, reporting almost 50% of HB cases across China during 2005–2010 [10]. The annual incidence of brucellosis in this region ranks in the top three among all Chinese provinces [11]. A study carried over seven years, has identified Inner Mongolia, a region characterized by wide pastures and highly developed animal husbandry, as a hotspot with an abnormally high risk of HB [12]. Despite the growing public health challenge of HB in China, environmental determinants of HB remain under-investigated. A recent study [1] used the MaxEnt model, an ecological niche modeling (ENM) approach, to predict the probability of the presence of HB in northern China. The researchers found that the density of small ruminants (especially sheep), altitude, seasonality of precipitation, and temperature annual range, were key factors associated with the presence of HB. Although the MaxEnt model overcomes several methodological obstacles inherent to other algorithms, such as Genetic Algorithm for Rule Set Production (GARP), it also has disadvantages. For example, MaxEnt uses a number of functional transformations of each predictor, known as features, in conjunction with regularization to penalize for model complexity and select the best set of features from a large candidate pool, which was recently criticized for overfitting [13–15]. Moreover, according to Merow and Silander (2014), the MaxEnt model poorly explains the probability of event occurrence because the assumption of random sampling of individuals is not the same as the assumption of random sampling of space associated with the occurrence probability [16]. Artificial neural network (ANN) is an alternative method that may help to overcome the limitations of conventional approaches and can create ENM models for complex problems. An ANN model is an information processing system that models the relationships between variables and performs predictions, by simulating the human brain function and learning from given examples. The concept of artificial neuron was first introduced by McCulloch and Pitts in 1943 [17]. Soon after, the first ANN model perceptron was developed to model how the human brain recognizes new objects from a prior supervised learning [18], which was widely used for a variety of purposes beyond studying human cognition in following studies [19–21]. Because of its predictability and a broad
Remote Sens. 2017, 9, 1018
3 of 17
application range, especially in solving complex and nonlinear problems [22,23], the ANN method has recently been proposed as an efficient tool for modeling and forecasting disease outbreaks [24]. Using the ANN approach, we developed a quantitative model for prediction of HB outbreaks based on the environmental variables primarily captured by remote sensing technologies, which have Remote Sens. 9, 1018 of disciplines such as agriculture [25], archaeology [26–28], ecology 3 of 17 [1,29], been applied to 2017, a variety health [30,31] and meteorology [32]. The goal of the study was twofold: (1) to identify the important Using the ANN approach, we developed a quantitative model for prediction of HB outbreaks predictor variables for HB; andvariables (2) to construct a modelbybased those most relevant based on the environmental primarily captured remoteon sensing technologies, whichexplanatory have variables to predict the annualofnumbers HBas cases in different counties of Innerecology Mongolia of China. been applied to a variety disciplinesofsuch agriculture [25], archaeology [26–28], [1,29], health [30,31] and [32].ofThe goal of theabout study was (1) to identify the important Our study advanced themeteorology current state knowledge the twofold: environmental determinants of HB and predictor variablestools. for HB; and (2) to constructthe a model based on those most relevantinexplanatory improved its prediction More importantly, research approach developed this study can be variables to predict the annual numbers of HB cases in different counties of Inner Mongolia of China. applied to the prediction of outbreaks of a broad range of climate-sensitive infectious diseases. Our study advanced the current state of knowledge about the environmental determinants of HB and improved its prediction tools. More importantly, the research approach developed in this study can 2. Materials and Methods be applied to the prediction of outbreaks of a broad range of climate-sensitive infectious diseases.
2.1. Ethics Statement 2. Materials and Methods No work on human subjects was undertaken in this study. Human brucellosis case data were 2.1. Ethics Statement collected from the annual reports published by the Inner Mongolia Center for Disease Control No work on human subjects was undertaken this study. Humanby brucellosis were and Prevention (CDC), where the reported cases in were aggregated county case anddata year. All data collected from the annual reports published by the Inner Mongolia Center for Disease Control and were anonymized. Prevention (CDC), where the reported cases were aggregated by county and year. All data were anonymized.
2.2. Study Area
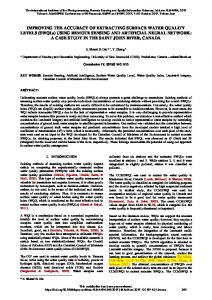
2.2. Mongolia Study Area is an autonomous region located along the northern border of China that stretches Inner Inner is to an east autonomous regionkm located northern borderlarge of China that ethnic for about 2400 kmMongolia from west and for 1700 from along norththe to south. Several minority stretches for about 2400 km from west to east and for 1700 km from north to south. Several large groups populate the region, including Mongolian, Daur, Ewenki, Hui and others. The region shares a minority ethnic groups populate the region, including Mongolian, Daur, Ewenki, Hui and others. ~3000 km international border with Mongolia and a ~1000 km border with Russia (Figure 1). Inner The region shares a ~3000 km international border with Mongolia and a ~1000 km border with Russia Mongolia is the third largest provincial unit in China (after Xinjiang and Tibet), covering approximately (Figure 1). Inner Mongolia is the third largest provincial unit in China (after Xinjiang and Tibet), 12.28% (~1.183 km2 ) 12.28% of China’s land Due tototal its land elongated shape, extending from 2) of China’s covering million approximately (~1.183total million kmarea. area. Due to its elongated ◦ ◦ ◦ to 125◦ E, a wide variety of regional climates exist in the about 40 to 50 N andfrom from about 107 shape, extending about 40° to 50°N and from about 107° to 125°E, a wide variety of regional in the region: aridpredominate and semiarid climates predominate in thehumid north and west; humid region: climates arid andexist semiarid climates in the north and west; continental climate is continental climate is predominant in the northeast; and subarctic climate is found in the far of north, predominant in the northeast; and subarctic climate is found in the far north, in the part the region in the part of the region that borders on Russia and Heilongjiang Province, China [33]. Inner Mongolia that borders on Russia and Heilongjiang Province, China [33]. Inner Mongolia consists of 12 municipal consists of 12 municipal units (nine cities and three leagues) and 89 sub-municipal units (i.e., units (nine cities and three leagues) and 89 sub-municipal units (i.e., counties). counties).
Figure 1. Eighty-nine counties of Inner Mongolia, China, with the numbers of human brucellosis (HB)
Figure 1. Eighty-nine counties of Inner Mongolia, China, with the numbers of human brucellosis (HB) cases per 100,000 people in 2010. cases per 100,000 people in 2010.
Remote Sens. 2017, 9, 1018
4 of 17
2.3. Data Sources 2.3.1. Epidemiological Data The annual numbers of HB cases at the county level in Inner Mongolia during 2006–2010 were collected from the annual reports published by the Inner Mongolia CDC. Each reported case was confirmed by both clinical signs and serological tests, or by isolation in accordance with the HB case definition by the World Health Organization (WHO) [34]. 2.3.2. Human and Animal Population Data A population grid, representing the total number of people in each 1 × 1 km cell or population density, was obtained from the Global Rural-Urban Mapping Project, Version 1 (GRUMPv1) [35]. The access to major settlements can be a strong determinant of social, health and economic differences between regions [36]. Therefore, a gridded map of accessibility in 2000, at a resolution of 1 × 1 km, represented the length of travel time (minutes) from each pixel to the nearest major settlement of population size 50,000 or more [37] was used as a separate input variable. Densities of cattle, sheep and goats in 2010 were obtained from the Food and Agriculture Organization (FAO) of the United Nations with a resolution of 5 × 5 km and resampled to 1 × 1 km grids. The worldwide Land Use Systems (Version 1.1), developed by the Land Tenure and Management Unit of the FAO, was used to extract livestock-related areas. 2.3.3. Environmental Variables Minimum, maximum and mean middle infrared radiation (MIR), land surface temperature (LST) and enhanced vegetation index (EVI) were produced by the Temporal Fourier Analysis based on 1 × 1 km gridded data obtained from MODerate-resolution Imaging Spectroradiometer (MODIS) sensors on-board NASA’s Terra and Aqua satellites during 2001–2008 [38]. These parameters were used to describe the physical environment, including water content (MIR), surface temperature (LST and MIR) and vegetation canopy greenness (EVI and MIR). Monthly precipitation data between 1960 and 1990 were downloaded from WorldClim [39] and transformed into annual minimum, maximum and mean precipitation variables by implementing raster math calculations in the ArcGIS (Version 10.4.1, Esri, Redlands, CA, USA) to describe the precipitation trends [40,41]. In addition, altitude and 19 bioclimatic variables, with a resolution of 1 × 1 km, were also derived from WorldClim to represent the general climatic conditions between 1950 and 2000. The importance of these variables as factors affecting human health was identified by previous studies [36]. All environmental variables used in the study are listed in Table S1. 2.4. Statistical Analysis A stepwise regression analysis with a forward selection procedure was conducted using the SPSS version 22.0 software [42], which started with no variables in the model and added the variable that most improved the model each time iteratively (p < 0.05), until no more improvement was achieved by adding new variables. A final set of model predictors of HB cases was selected based on the overall adjusted R-square value and further used to establish the ANN model. 2.5. ANN Model ANN models simulate human brain functioning to predict values of independent variables when the relationship between independent variables and dependent variables is non-linear. A key difference among various types of ANN models is the training algorithm used for determining the weights for neurons between different layers. The most commonly used training algorithm is called Back Propagation, a multilayer feed-forward network trained by an error back-propagation algorithm, which trains ANN models to minimize the difference between the model output and the measured
Remote Sens. 2017, 9, 1018
5 of 17
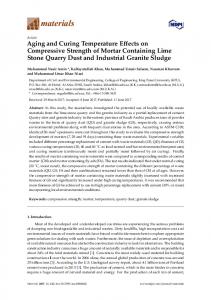
target [22].2017, The9,back-propagation ANN model used in this study consists of three layers: an input Remote Sens. 1018 5 of 17 layer, a hidden layer, and an output layer; each layer contains multiple neurons. An artificial neuron in a typical ANN architecture receives input via connections and sendsresults calculated aneuron typicalinANN architecture receives input neurons vianeurons connections and sends calculated via results via connections to output layer 2). Each connection has an unknown parameter, called connections to output layer (Figure 2).(Figure Each connection has an unknown parameter, called weight, weight,is which is kept until adjusted until the overall performance the ANN meets the which kept adjusted the overall performance of the ANN of model meets model the requirements requirements of prediction. of prediction.
Figure Figure 2. 2. Structure Structure of of an an artificial artificial neural neural network network (ANN) (ANN) model. model. Weight Weight matrix matrix vector vector and and threshold threshold vector vector are aredenoted denotedby bywwand andb,b,respectively. respectively.
2.5.1. Model Model Development Development 2.5.1. In this study, toolbox in in thethe MATLAB program (version 2013a) to train a feedIn study, we weused usedan anANN ANN toolbox MATLAB program (version 2013a) to train a forward ANN model using thethe error back-propagation feed-forward ANN model using error back-propagationalgorithm, algorithm,and andto to integrate integrate environmental environmental variables for for the the prediction prediction of of HB HB outbreaks outbreaks [43]. [43]. The The input input layer layer consisted consisted of of the the variables variables selected selected variables from the statistical analysis of different environmental predictors of HB. The number of hidden from the statistical analysis of different environmental predictors of HB. The number of hidden neurons neurons was to adjusted to 20. A log-transformation was to conducted shrink the of discrepancy of HB was adjusted 20. A log-transformation was conducted shrink thetodiscrepancy HB cases among cases among different and the comprised output layer comprised thelog-transformed raw yearly log-transformed numbers different areas, and theareas, output layer the raw yearly numbers of HB cases of HB cases at the county level as the target. at the county level as the target. For model model development, development, data data for for 2006–2008 2006–2008 (89 (89 groups groups for for each each year) year) were were combined combined and and then then For randomly split into three subsets for training (60% of data, 161 groups), validating (20%, 53 groups), randomly split into three subsets for training and testing testing (20%, 53 groups). which the weights of and groups). The Thetraining trainingset setwas wasused usedtotodesign designthe themodel, model,inin which the weights connections were estimated, while error of connections were estimated, whilethe thevalidation validationset setwas wasused usedto to estimate estimate the the mean square error (MSE) of of the the model. model. Training Training and and validating validating were were iteratively iteratively conducted conducted until until the the MSE MSE reached reached its its (MSE) minimum value. value. Then, the the unbiased unbiased generalization generalization estimate estimate of of performance, performance, i.e., i.e., linear linear correlation correlation minimum coefficient (LCC), was calculated based on the testing set, and the entire process of model coefficient (LCC), was calculated based on the testing set, and the entire process of model development development was conducted to optimize LCC. was conducted to optimize LCC. 2.5.2. 2.5.2. Model Model Assessment Assessment To the model’s model’sability abilitytotopredict predict outbreaks, 178 groups of from data 2009– from To assess the thethe HBHB outbreaks, we we usedused 178 groups of data 2009–2010 (89 groups foryear), each which year), which were outmodel in the development model development to test 2010 (89 groups for each were left outleft in the phase tophase test whether whether the prediction results were identical with the reported numbers. A range of statistical measures the prediction results were identical with the reported numbers. A range of statistical measures were were calculated to compare prediction and observation both model development and assessment calculated to compare prediction and observation in bothinmodel development and assessment stages, stages, including thecorrelation linear correlation coefficient (LCC), root meanerror square error standard (RMSE), deviation standard including the linear coefficient (LCC), root mean square (RMSE), deviation of bias (SDB), arithmetic mean and median. of bias (SDB), arithmetic mean (AM) and(AM) median. 2.6. 2.6. Sensitivity Sensitivity Analysis Analysis Sensitivity Sensitivity analysis analysis of of the the model model was was conducted conducted by by the the changing changing one-factor-at-a-time one-factor-at-a-time (OAT) (OAT) method, to demonstrate demonstrate the theextent extenttotowhich whicheach each input variable influenced output. To that method, to input variable influenced thethe output. To that end, end, each input variable included in the ANN model was alternately changed from − 20% to +20% each input variable included in the ANN model was alternately changed from −20% to +20% (increasing 5% at at aa time). time). Sensitivity Sensitivity was was measured measured by by the the percent percent change change in in the the model (increasingby by ± ±5% model output. output.
3. Results 3.1. Predictors of HB As shown in Table 1, the most significant environmental variables selected for the final regression model using the stepwise regression analysis procedure were: sheep density in 2010
Remote Sens. 2017, 9, 1018
6 of 17
3. Results 3.1. Predictors of HB As shown in Table 1, the most significant environmental variables selected for the final regression model using the stepwise regression analysis procedure were: sheep density in 2010 (Sheep10, heads/km2 ), max temperature of warmest month (Bio5, ◦ C), mean temperature of wettest quarter (Bio8, ◦ C), minimum EVI (EVImin), minimum LST (LSTmin, ◦ C), precipitation of wettest month (Bio13, mm), mean LST (LSTmean, ◦ C), accessibility (Access), mean EVI (EVImean), minimum MIR (MIRmin), Remote and precipitation Sens. 2017, 9, 1018 of warmest quarter (Bio18, mm). 6 of 17 (Sheep10, heads/km max temperature of warmest (Bio5, °C), mean temperature of wettest Table 1. Summary of the ),stepwise regression analysismonth of environmental factors affecting the annual quarter (Bio8, °C), minimum EVI (EVImin), minimum LST (LSTmin, °C), precipitation of wettest incidence of HB in counties of Inner Mongolia (note: the variables were entered if p ≤ 0.05, and removed month (Bio13, mm), mean LST (LSTmean, °C), accessibility (Access), mean EVI (EVImean), minimum if p ≥ 0.10). MIR (MIRmin), and precipitation of warmest quarter (Bio18, mm). 2
Model Table Variables Entered Variables Removed Square Significance of the F Value Change 1. Summary of the stepwise regression analysis ofRenvironmental factors affecting annual 1 2 3 4 5 6 7 8 9 10 11 12
3.2. Model
incidenceSheep10 of HB in counties of Inner Mongolia (note: the0.129 variables were entered if p0.000 ≤ 0.05, and removed if pBio5 ≥ 0.10). 0.237 0.000
Bio8 Model Variables Entered EVImin 1 Sheep10 LSTmin 2 Bio5 Bio13Bio8 3 LSTmean 4 EVImin Access 5 LSTmin EVImean 6 Bio13 7 LSTmean MIRmin 8 Access Bio18 9 EVImean 10 11 MIRmin Development 12 Bio18
Variables Removed
Bio8
Bio8
0.283 R Square 0.296 0.129 0.333 0.237 0.386 0.283 0.419 0.296 0.435 0.333 0.445 0.386 0.443 0.419 0.455 0.435 0.460 0.445 0.443 0.455 0.460
0.000Change Significance of F Value 0.000 0.004 0.000 0.000 0.000 0.000 0.004 0.000 0.000 0.000 0.000 0.006 0.000 0.313 0.000 0.002 0.006 0.044 0.313 0.002 0.044
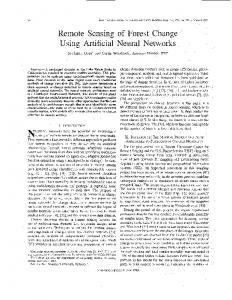
We next compared the predicted and raw log-transformed numbers of HB cases at county level 3.2. Model Development during 2006–2008 (Figure 3). In general, ANN model predictions were consistent with the raw numbers We next compared the predicted and raw log-transformed numbers of HB cases at county level with a highduring LCC of 0.9134.(Figure We conducted a comparison statisticalwere measures between and 2006–2008 3). In general, ANN modelofpredictions consistent with thepredicted raw raw yearlynumbers log-transformed numbers of HB cases during 2006–2008 (Table 2). As Table 2 shows, both with a high LCC of 0.9134. We conducted a comparison of statistical measures between predicted yearly log-transformed numbers of HB during 2006–2008 (Table 2). Aswhich Table implied AM and median ofand theraw predicted numbers were close tocases those of the raw numbers, 2 shows, both AM and median of the predicted numbers were close to those of the raw numbers, similarity between predictions and reports. This was further confirmed by a low RMSE of 0.3664. which implied similarity between predictions and reports. This was further confirmed by a low A low SDBRMSE (0.3656) revealed that(0.3656) errors in thethat prediction log-transformed numbers of HB cases of 0.3664. A low SDB revealed errors in theofprediction of log-transformed numbers tended to be uniform among different counties. of HB cases tended to be uniform among different counties.
Figure 3. Comparison between predicted (red)and and raw raw yearly log-transformed numbers of humanof human Figure 3. Comparison between predicted (red) yearly log-transformed numbers brucellosis cases (blue) at the county level in the model development phase. X-axis denotes counties, counties, brucellosis cases (blue) at the county level in the model development phase. X-axis denotes with 89 counties listed horizontally in the same order in all three panels (2006, 2007 and 2008). with 89 counties listed horizontally in the same order in all three panels (2006, 2007 and 2008).
Remote Sens. 2017, 9, 1018
7 of 17
Table 2. Comparison of predicted and raw yearly log-transformed numbers of human brucellosis cases in the model development phase (2006–2008) in Inner Mongolia, China. Statistical Measure
Raw
Predicted
Linear correlation coefficient (LCC) Root mean square error (RMSE) Standard deviation of bias (SDB) Arithmetic mean (AM) Median
NA NA NA 1.3998 1.5682
0.9134 0.3664 0.3656 1.3745 1.5826
NA: Not applicable.
Overall, the ANN model did not shown any tendency to either overestimate or underestimate the average log-transformed number of HB cases in the model development phase. The percent errors in the prediction were between −50% and 50% in 71 (79.8%) out of 89 counties (Figure 4), with the spatial distribution shown in Figure S1a. The reported averages of HB cases in 12 counties (Alxa Right Banner, Alxa Left Banner, Baiyun Mining District, Dalad Banner, Dongsheng City, Ejin Banner, Otog Banner, Otog Front Banner, Urat Rear Banner, Uxin Banner, Ejin Horo Banner, and Jungar Banner) were either 0 or 1, thus the percent error was not applicable in these counties. The percent errors in the remaining six counties (Haggin Rear Banner, Liangcheng County, Linhe District, Ningcheng County, Tumed Right Banner, and Tumed Left Banner) were −75.80%, 126.96%, −57.88%, 60.62%, 269.56%, and 102.16%, respectively.
Remote Sens. 2017, 9, 1018 Remote Sens. 2017, 9, x FOR PEER REVIEW
8 of 17 8 of 17
Figure 4. Percent errors of the log-transformed numbers of human brucellosis cases during 2006–2008 in 71 out of 89 counties in Inner Mongolia, China. The percent errors in the remaining 18 counties, outside of the −50% to 50% error range, were described in the text, but left out in this figure for the sake of clarity.
Figure 4. Percent errors of the log-transformed numbers of human brucellosis cases during 2006–2008 in 71 out of 89 counties in Inner Mongolia, China. The percent errors in the remaining 18 counties, outside of the −50% to 50% error range, were described in the text, but left out in this figure for the sake of clarity.
Remote Sens. 2017, 9, 1018
9 of 17
Remote Sens. 2017, 9, 1018
9 of 17
3.3. Model Assessment
3.3. Model Assessment
To assess the performance of the ANN model, the predicted and raw log-transformed numbers of To assess the performance of the ANN model, the predicted and raw log-transformed numbers HB cases per county were compared in 2009 and 2010 (Figure 5). In general, ANN model predictions of HB cases per county were compared in 2009 and 2010 (Figure 5). In general, ANN model were consistent the raw numbers of HB casesofwith a high LCC of LCC 0.8930, whichwhich was was close to predictions with were consistent with the raw numbers HB cases with a high of 0.8930, but slightly lower than the LCC in the model development phase (0.9134). Compared to 2006–2008, close to but slightly lower than the LCC in the model development phase (0.9134). Compared to 2006– the reported of HB cases in 2009 and 2010, Horqin Right Front 2008, thenumbers reported numbers of HB increased cases increased in 2009 and 2010,particularly particularly ininHorqin Right Front Banner. A large-scale outbreak of HB was reportedduring during 2010 Front Banner where Banner. A large-scale outbreak of HB was reported 2010in inHorqin HorqinRight Right Front Banner where 1490 people infected. total numberofofHB HBcases cases in this from 202202 in 2006 to to 1490 people werewere infected. TheThe total number thiscounty countyincreased increased from in 2006 1490 in 2010. 1490 in 2010.
FigureFigure 5. Comparison between predicted (red) log-transformed numbers of human 5. Comparison between predicted (red)and andraw raw yearly yearly log-transformed numbers of human brucellosis casescases (blue) at the county level ininthe phase.X-axis X-axis denotes counties, brucellosis (blue) at the county level themodel model assessment assessment phase. denotes counties, with 89 counties horizontally in the sameorder orderin inboth both panels panels (2009 with 89 counties listedlisted horizontally in the same (2009and and2010). 2010).
We further compared statistical measures between the predicted and raw log-transformed
We further compared statistical measures between the predicted and raw log-transformed numbers of HB cases during 2009–2010 (Table 3). Both AM and median of predicted log-transformed numbers of HB cases during 2009–2010 (Table 3). Both AM and median of predicted log-transformed numbers of HB cases were underestimated by the model in the assessment phase. There was a numbers of HBincases were underestimated the model in the assessment phase. a decrease decrease LCC (0.9134 to 0.8930) and anby increase in RMSE (0.3664 to 0.5603) in the There model was assessment in LCC (0.9134 to 0.8930) and an increase in RMSE to 0.5603) in the model assessment phase, phase, compared to the model development phase,(0.3664 thus indicating larger discrepancies between the compared to theand model development indicating larger phase. discrepancies between the predicted predicted raw numbers of HBphase, cases inthus the model assessment and raw numbers of HB cases in the model assessment phase. Table 3. Comparison of predicted and raw yearly log-transformed numbers of human brucellosis in the assessment phase (2009–2010) in Inner Mongolia, China. Table cases 3. Comparison of predicted and raw yearly log-transformed numbers of human brucellosis cases in the assessment phase (2009–2010) in Inner Mongolia, China. Statistical Measure Raw Predicted
Linear correlation coefficient (LCC) NA Statistical Measure Root mean square error (RMSE) RawNA Standard coefficient deviation of bias (SDB) NA NA Linear correlation (LCC) Arithmetic (AM) Root mean square errormean (RMSE) NA1.8190 Standard deviation of bias (SDB) NA1.9370 Median Arithmetic mean (AM) 1.8190 NA: Not applicable. Median 1.9370
0.8930 Predicted 0.5603 0.3793 0.8930 1.4067 0.5603 0.3793 1.5993 1.4067 1.5993
NA:and Not raw applicable. The percent errors of the predicted numbers of HB cases during 2009–2010 were compared. The percent errors were between −50% and 50% in 67 out of 89 counties (Figure 6), >50% in Uxin Banner (92.72%), andpredicted 50% in Uxin Banner (92.72%), and