tion of feature information for applications such as updating geographic information ... stimulated the development of techniques specifically tar- geted at taking ...
LFX-537.qxd
11/9/04
16:15
Page 1383
A Review of Techniques for Extracting Linear Features from Imagery Lindi J. Quackenbush
Abstract The automated extraction of linear features from remotely sensed imagery has been the subject of extensive research over several decades. Recent studies show promise for extraction of feature information for applications such as updating geographic information systems (GIS). Research has been stimulated by the increase in available imagery in recent years following the launch of several airborne and satellite sensors. However, while the expansion in the range and availability of image data provides new possibilities for deriving image related products, it also places new demands on image processing. Efficiently dealing with the vast amount of available data necessitates an increase in automation, while still taking advantage of the skills of a human operator. This paper provides an overview of the types of imagery being used for linear feature extraction. The paper also describes methods used for feature extraction and considers quantitative and qualitative accuracy assessment of these procedures.
Introduction Background Humans have sought to extract information from imagery ever since the first photographic images were acquired. As early as the mid nineteenth century the French Army Corps of Engineers experimented with using aerial photographs for reconnaissance and mapping (Wolf and Dewitt, 2000). The expansion of photogrammetry and remote sensing have since been stimulated by advances such as the development of color film, the invention of the airplane, and unceasing improvement in instrumentation and techniques (Wolf and Dewitt, 2000). However, interest in feature extraction has increased significantly since the advent of digital imagery and the possibilities associated with electronic processing. Focused conferences provide an overview of many of the techniques available (Baltsavias, et al., 2001; Gruen, et al., 1997; Gruen, et al., 1995). In addition, several commercially available photogrammetric workstation systems cited in the review by Plugers (1999) now incorporate some automated feature extraction capability. Other companies such as Definiens (2003) and Visual Learning Systems (VLSI, 2003) are developing software specifically targeted at feature extraction. However, since the majority of commercial vendors use proprietary algorithms this paper does not provide a comprehensive review of such systems. Within the field of feature extraction there are many areas of specialization. Some algorithms have been designed to identify specific target objects while others focus more generally on building or road extraction. The techniques for these different specializations can vary substantially. This paper
focuses on the research performed for the purpose of extracting linear features from remotely sensed imagery. One of the primary reasons that researchers in the mapping sciences focus on linear feature recognition is because of the significance of roads in our society and the need to keep road locations updated (Pigeon, et al., 1999a). Park, et al. (2002) describe many of the challenges commonly associated with linear feature extraction and overview some common techniques. Research into automated feature extraction from imagery dates back to the seventies. Since that time, technology has improved and commercial access to imagery has continued to expand. Destival (1986) described the improvements in feature extraction that were expected using 10 meter panchromatic imagery following the launch of the first SPOT satellite in 1986. In moderate resolution imagery, such as SPOT or Landsat Thematic Mapper (TM), linear features such as roads are often narrower than the spatial resolution of the satellite. Hemmer (1996) described this subpixel problem as one of the complicating factors in extracting linear features using imagery from the satellite sensors available at that time. Wang and Zhang (2000) compared high spatial resolution aerial photography with SPOT and Landsat TM imagery for extracting road networks. Wang and Zhang (2000) found that the success of linear feature extraction was particularly related to spatial resolution. Their experimentation found that photography out-performed the lower resolution satellite imagery when extracting roads in an urban environment. High spatial resolution imagery provides a detailed representation of road networks needed for many applications that cannot be obtained from lower resolution image sources (Xiong, 2001). In lower resolution imagery roads appear as curvilinear structures, while in higher resolution imagery roads appear as homogenous regions that satisfy certain shape or size constraints (Hinz, et al., 2001). Roads are often characterized in high spatial resolution imagery as elongated regions (Agouris, 2001b). The increased availability of high spatial resolution data has stimulated the development of techniques specifically targeted at taking advantage of the detail found in such imagery. For example, many of the techniques developed for road detection search for roads as pairs of edges: such techniques are unsuited to processing lower resolution imagery. Access to imagery with ground sample distances (GSD) below five meters has increased significantly in recent years with the launch of several airborne and satellite sensors. This expansion in the availability of high spatial resolution image data provides new possibilities for deriving image related products but also places new demands on processing Photogrammetric Engineering & Remote Sensing Vol. 70, No. 12, December 2004, pp. 1383–1392.
SUNY College of Environmental Science and Forestry, 312 Bray Hall, 1 Forestry Drive, Syracuse, NY 13210 (ljquack@ esf.edu). P H OTO G R A M M E T R I C E N G I N E E R I N G & R E M OT E S E N S I N G
0099-1112/04/7012–1383/$3.00/0 © 2004 American Society for Photogrammetry and Remote Sensing December 2004
1383
LFX-537.qxd
11/9/04
16:15
Page 1384
capabilities. The improvements in spatial resolution provide the potential for automatically defining linear features that were previously unattainable (Penn and Livo, 2002). However, to be most useful imagery must be processed quickly, and features must be located accurately and classified correctly. With such time restrictions and the vast amounts of data collected daily, manual processing cannot hope to keep up with the data acquisition (Gibson, 2003). The increased amount of data is one of the driving factors that is stimulating the development of automatic processing for extracting linear features (Agouris, et al., 2001b). In order to serve a wide variety of civilian and military applications, planimetric features are generally represented on maps by their centerlines, boundaries, or center points (Yee, 1987). Historically, these features were interpreted and extracted manually by a human interpreter viewing imagery on a stereoplotter (Yee, 1987). Automatically updating road layers can be a complicated effort, with partial-occlusion from cars, vegetation, and buildings blocking some roads from detection and other features with similar spectral or spatial characteristics creating confusion when performing classifications. Successfully exploiting the new high spatial resolution data sources will require developing novel, robust feature extraction and image classification tools (Guindon, 1999). A common objective of feature extraction is to facilitate the rapid update of GIS data (Ahac, et al., 1992). Such updates can include deriving new information or using existing GIS data sets to drive feature extraction (Bonnefon, et al., 2002). Manual processing of data relies heavily on human labor, pushing up the cost of developing such databases (Xiong, 2001). The potential for time reduction in creating and updating databases is an important factor in developing feature extraction techniques. Another incentive for moving to automated feature extraction is convenience. The Canada Centre for Mapping (CCM) traditionally updated maps through visual interpretation of imagery (O’Brien, 1989). Digitization of the maps at the CCM led to a logical shift from visual updates to extraction of information directly from digital sources. Improving the quality and consistency of derived data may be a further reason for using automated procedures. Fitton and Cox (1998) describe a need to identify geological features in imagery for use in deriving parameters for geophysical models. The authors state that automatically extracting features from imagery increases the speed of data processing and improves the reliability of the parameters derived from these features. Types of Imagery Considered in Feature Extraction The body of literature for linear feature extraction from panchromatic aerial imagery is substantial (e.g., Agouris, et al., 2001a; Katartzis, et al., 2001; Couloigner and Ranchin, 2000; Trinder and Wang, 1998). However, feature extraction techniques are applied to imagery with a wide variety of spectral and spatial characteristics. Many authors have reported use of radar data for extracting linear features (e.g., Hellwich, et al., 2002; Chanussot, et al., 1999; Tupin, et al., 1998; Iisaka and Sakurai-Amano, 1995), while others such as Alharthy and Bethel (2003) extracted roads from lidar data; additionally, authors such as Pelletier (1985) describe feature extraction in thermal imagery of an agricultural region. Several authors report feature extraction using multispectral image sources in the visible or near-infrared portion of the spectrum such as SPOT (e.g., Hui, et al., 2001; O’Brien, 1989; Yee, 1987; Destival, 1986), Landsat TM (Wang and Zhang, 2000; Fitton and Cox, 1998), and Ikonos imagery (Gibson, 2003; Dial, et al., 2001). Research has also been performed for linear feature extraction from hyperspectral imagery. Gardner, et al. (2001) and Penn and Livo (2002) reported some success in extracting road locations from AVIRIS imagery, while Doucette, et al. (1999) experimented with HYDICE imagery. 1384
December 2004
Much of the literature reported for feature extraction applies to single band, high spatial resolution imagery. Ikonos (Space Imaging, Inc., 2003) and Quickbird (Digital Globe, 2003) are examples of the new generation of high spatial resolution satellite based sensors: Ikonos has one meter panchromatic and four meter multispectral; QuickBird imagery has 0.61 meter panchromatic and 2.44 meter multispectral. In both cases, these sensors record their highest spatial resolution in a panchromatic mode. Processing techniques that aim to use the highest spatial resolution data sources will need to extract and exploit the spatial and/or contextual information with a limited number of spectral channels (Guindon, 1999).
Feature Extraction Manual versus Automated Extraction Humans and computers have complementary strengths: humans are good at scanning large areas and recognizing objects, whereas computers are good at optimization, detailed delineation and repetition (McKeown, et al., 1996). Whether manual, automated, or a combination of the two, feature extraction can be a very involved process. Manual feature extraction harnesses the interpretation skills of the operator but can be time consuming and thus expensive to perform (Baumgartner, et al., 1999). With a growing body of digital data archived and a rapidly changing society, the efficient revision of cartographic databases implies some form of automated feature extraction (O’Brien, 1989). Data capture is often the most expensive component in a GIS application and techniques developed that can alleviate this are welcomed (Ansoult, et al., 1990; Firestone, et al., 1996). Automated systems offer the potential for time and labor savings and potentially may improve accuracy and consistency of planimetric data (Yee, 1987). The use of automated or semi-automated procedures can also provide cost savings by significantly reducing the training time of photo interpreters (Pigeon, et al., 1999b). Automated procedures may also have other less tangible benefits such as reducing operator fatigue (Firestone, et al., 1996). Humans have the ability to group simple features, such as points and lines, into meaningful structures (Guindon, 1999). Semi-automated approaches rely on user provided cues to delineate road components (Agouris, et al., 2001b). Only a short number of years ago Gruen and Li (1997) considered fully automatic methods for feature extraction to be “far out of reach.” Furthermore, the authors believe that using a semi-automated approach is optimal because humans perform identification almost flawlessly with limited effort. Humans are able to perceive shapes in noisy data and adapt to varying conditions, without being told explicitly what to expect. Writing computer code to simulate this ability is a significant challenge. Baumgartner, et al. (1999) found that their automatic road extraction was not absolutely reliable and generally required a human operator to edit the results. This typically entailed deleting wrongly extracted roads and inserting missing parts. Incorporating existing GIS data into the feature extraction process can reduce the need for human direction (Agouris, et al., 2001a). Humans interpret imagery by evaluating a wide range of cues including both spectral and spatial patterns. Traditional classification methods are generally applied to multispectral data sets and use spectral similarity of features within a class to gather information. With high spatial resolution imagery, it is often possible to consider spatial patterns to a greater degree when looking for specific features. For example, it is possible to use structural information about roads (such as, width, linearity, or limitations on curvature) to distinguish them from other features that may be spectrally similar. Many automated or semi-automated feature extraction procedures P H OTO G R A M M E T R I C E N G I N E E R I N G & R E M OT E S E N S I N G
LFX-537.qxd
11/9/04
16:15
Page 1385
attempt to mimic the human interpretation process by incorporating both spectral and spatial information. A Feature Model To carry out object recognition, it is first necessary to establish a model or framework that describes the general characteristics of the feature of interest (Suetens, et al., 1992). Automated feature extraction requires that such a model be defined in a manner that can be implemented by computer (Trinder and Wang, 1998). Model based processing exploits the constraints and relationships that define objects, for example, the size, shape, and material of a building, or the width, material, and direction of a road. The feature model includes information relating to a range of characteristics such as intensity, shape, texture, and context (Suetens, et al., 1992). Models are often characterized as being either flexible or rigid. A rigid model defines features specifically, for example outlining the allowable size, shape and spectral response. A flexible model may include specifications in terms of generic constraints, such as smoothness, rectilinearity, curvature, compactness, symmetry, and homogeneity. An objective function is used to find a best fit between the model and the image data. Some techniques use hierarchical types of models (Suetens, et al., 1992). For example, Yee (1987) identified bridges by first finding potential road segments, then restricting the search to select those with water on either side. The simplest models rely only on local intensity values to recognize features, as is the case in a traditional supervised classification. Suetens, et al. (1992) believe that without considering geometric and semantic characteristics as well as statistical properties, most feature extraction procedures are unlikely to succeed. Baumgartner, et al. (1999) initially defined three contexts in order to subdivide a scene: urban, rural, and forest. Road sub-models were then developed locally within each of the global contexts, reflecting the complex nature of a typical feature. Katartzis, et al. (2001) used a model that combined both geometric and radiometric properties of the linear features they aimed to extract. Developing models of features to be extracted can provide significant processing benefits. Most of the techniques reviewed for this paper relied on models to some degree. When searching for roads in imagery, many authors use a simple model; for example, assuming that roads have high intensity and are linear (O’Brien, 1989). Yee (1987) incorporated structural knowledge of roads and inferred road segments by finding parallel lines separated by specified road widths. Gruen and Li (1997) specify a more detailed road model that considers a variety of characteristics. For example, road pixels are lighter in intensity than neighboring non-road pixels, and intensity values along a road generally do not change very much within a short distance; roads are usually continuous in nature, generally comprising straight line segments connected by smooth curves with an upper bound on local curvature; and the width of a road does not change significantly.
Techniques for Feature Extraction Overview There is a wide range of techniques used to detect linear features in imagery. Many of the papers reviewed developed extraction techniques for locating a specific feature class, such as roads, while others considered adaptations to generalize the search to other linear features such as streams, railroads, and runways (Fischler, et al., 1981). The level of automation in the reviewed techniques varied significantly. Some procedures described in this paper require a significant amount of human input to select potential road locations. Other procedures use a few initial assumptions, such as the relative brightness of road pixels or linearity, and allow the computer P H OTO G R A M M E T R I C E N G I N E E R I N G & R E M OT E S E N S I N G
to do the rest. A common application of linear feature extraction is updating GIS data layers. As a result, increasing numbers of techniques are taking advantage of this by using existing digital data to provide preliminary input information for processing. Techniques for feature extraction often divide the process into three primary steps: edge detection or road finding, road tracking, and vectorization or road linking (Park, et al., 2002; Trinder and Wang, 1998). Many techniques rely on some form of preprocessing to enhance edges or lines, or segment the imagery into homogeneous regions (e.g., Nevatia and Babu, 1980; Sijmons, 1987; Guindon, 1998). Rowe and Grewe (2001) found using edges, rather than individual pixels, was more reliable when considering changes in linear features between pairs of images. Even though the authors acknowledge the importance of the preprocessing procedures used for edge detection, they are often not described in detail (e.g., Fitton and Cox, 1998). Park, et al. (2002) provides a summary of some common methods used for edge detection in the context of extracting roads from imagery. Many of the techniques reported in the literature combine strategies from a variety of approaches. Categorizing such approaches becomes a challenge. The following sections of this paper present many of the different techniques used in automatically extracting roads from imagery, recognizing that there is often substantial overlap between the procedures. Mathematical Morphology The techniques of mathematical morphology have proven useful in automating feature extraction. Destival (1986) and O’Brien (1989) used mathematical morphology to search for roads in simulated and actual SPOT imagery, respectively. Dong (1997) used mathematical morphology to extract linear features from gray scale aerial imagery. Trinder and Wang (1998) used mathematical morphology to extract lines in the low-resolution component of a multi-resolution processing system. Chanussot, et al. (1999) found that morphological operators perform well for extracting roads because they are intrinsically characterized by shape. Roads are identified using mathematical morphology by considering the intensity of pixels in relation to their neighbors. The procedure uses a priori knowledge about the relative intensity of roads to perform the automated road extraction, for example, assuming that roads have brighter intensity than the background (Trinder and Wang, 1998). In mathematical morphology, images are filtered using a kernel. The output of the filtering process depends on the match between the image and the kernel and the operation being performed (O’Brien, 1989). The two basic operations of mathematical morphology are dilation and erosion (Serra, 1986). The simplest example of mathematical morphology considers the analysis of binary images. The kernel typically used for binary imagery is a 3 � 3 array consisting of 1s, 0s, or 1s. Dilation and erosion can be performed on binary images using with the kernel shown in Figure 1 (O’Brien, 1989). In dilation, the filter shown in Figure 1 is passed across the image with the resultant value for the center cell set to 1 if any 1 in the kernel matches a 1 in the image, which expands features in the image and closes any gaps. In erosion, a value of 1 is returned only if all the 1s in the kernel are matched by 1s in the image. Erosion shrinks image features and eliminates small features. Figure 2 shows a simple example where Figure 2b and Figure 2c, respectively, illustrate dilation and erosion of Figure 2a. For ease of visualization, a value of 1 in Figure 2 is shown in the image as a black square and 0 as white. Dilation followed by erosion (closing) closes small gaps and connects sets; erosion followed by dilation (opening) removes small or narrow elements, without effecting large ones (Dong, 1997). December 2004
1385
LFX-537.qxd
11/9/04
16:15
Page 1386
Figure 1. Basic kernel used for dilation and erosion in binary imagery.
(a)
(b)
(c)
Figure 2. Simple example of erosion and dilation: (a) original (b) dilated (c) eroded.
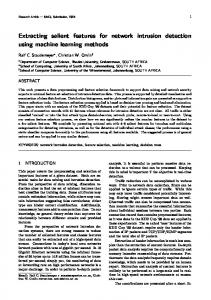
When a gray scale image is analyzed, the pixel intensity can be considered to form a three-dimensional surface (much like a digital elevation model) with changes in intensity corresponding to features such as peaks, holes, trenches, ridges, and steps (O’Brien, 1989). Dilating the gray scale image fills holes and trenches, broadens peaks and ridges, and shifts steps outward. Erosion tends to eliminate features with a width less than the kernel. The directional filter shown in Figure 3 is used to identify linear features. Eroding an image using the kernel shown in Figure 3 and also eroding the image with rotations of the same kernel defines features with linear characteristics. When the rotations of the kernel shown in Figure 3 are applied to an area with homogenous intensity or a point feature, the output will be the same for all directions. Linear features, such as ridges and steps, are detected by identifying image locations that show variation in the output for different directional kernels. Ansoult, et al. (1990) and Yamada, et al. (1993) used mathematical morphology as a means of acquiring GIS layers from scanned maps. In order to find closed boundaries of the various classes displayed on the maps, Ansoult, et al. (1990) used a mathematical morphology routine called a watershed algorithm. This algorithm is performed in two stages, a skeletonization followed by a pruning. The skeleton is formed by 1386
December 2004
Figure 3. Directional kernel used for detecting linear features.
sequentially thinning the image with structuring elements that preserve homotopy; the pruning transformation removes lines that do not form closed contours. These two operators are most easily explained by referring to the illustration shown in Figure 4. Figure 4a shows the initial binary imagery. Figure 4b shows the same image skeletonized, that is, sequentially thinned to lines of unit thickness. The watershed of the original image is shown in Figure 4c, in which the skeleton has been pruned leaving only closed contours. Daida and Vesecky (1991) used a variation of this watershed algorithm to extract features in radar imagery. Thinning linear features using mathematical morphology increases the potential for vectorization and direct input into a GIS (Dong, 1997). In order to extract roads from SPOT panchromatic imagery, O’Brien (1989) used a multi-step mathematical morphology based procedure. He reported difficulties in rural areas when roads passed near the edge of fields, and in urban areas where roads were confused with large paved areas such as parking lots. Destival (1986) observed that the automated process required human intervention in several places, and, in fact, a human could perform the road extraction more efficiently. Dong (1997) found that the mathematical morphology operations operated most efficiently when applied in conjunction with human interaction. For some studies, mathematical morphology was a component in a multi-stage feature extraction process (Chanussot, et al., 1999; Doucette, et al., 1999). Hough Transform The Hough Transform (HT) is an automatic analysis technique used for detection of linear features in a variety of applications (Karnielli, et al., 1996). The standard HT detects analytic curves, while a generalized HT can be used to detect arbitrary shaped templates (Suetens, et al., 1992). The HT uses a parametric approach to describe features of interest and can detect any feature that can be parameterized (Fitton and Cox, 1998). In the parameter space, image patterns produce local extremes at the most likely parameter values (Suetens, et al., 1992). Linear features in image space are transformed into single points in the parameter space. Successful detection of linear features using the HT requires preprocessing to threshold the input P H OTO G R A M M E T R I C E N G I N E E R I N G & R E M OT E S E N S I N G
LFX-537.qxd
11/9/04
16:15
Page 1387
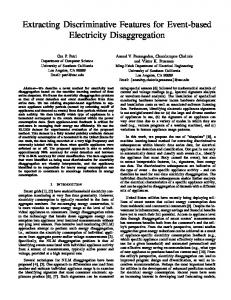
image into a binary layer. Benefits of the HT are that it detects lines with some fragmentation and it is reasonably unaffected by random noise (Fitton and Cox, 1998). Lee and Moon (2002) used the parameterization of the HT described by Duda and Hart (1972) for extracting linear features. In this transform image space (x, y) is transformed to a (�, �) parameter space. An example illustrating this parameterization is shown in Figure 5. Based on the example shown in Figure 5, the point (x, y) can be represented in polar coordinates as (r, �). That is: x � r cos � and y � r sin �. The following can also be observed from Figure 5:
(a)
� � r cos � � r cos (� � �) � r cos � cos � � r sin � sin � � (x�cos �) cos � cos � � (y�sin �) sin � sin � � x cos � � y sin �
(b)
(c)
Figure 4. Stages of watershed algorithm: (a) initial; (b) skeletonized; (c) pruned.
(1)
As mentioned earlier in this section, lines in the image space are transformed to points in the parameter space. This can be seen using the simple example shown in Figure 5. Based on Equation 1, all of the points along the dashed line including (x, y) will be transformed onto (�, �). A point in the parameter space will have amplitude proportional to the number of points that populate the line in image space (Fitton and Cox, 1998). The application of the HT reduces the problem of searching for lines in the image space to searching for peaks in the parameter space. Lee and Moon (2002) used the HT to detect lines in a range of image sources including JERS-1 SAR and Landsat TM. The HT requires a binary image input, often produced using linear and non-linear edge enhancement techniques. The successful detection of lines by the HT is dependent on this initial processing (Fitton and Cox, 1998). Fitton and Cox (1998) found a large proportion of linear features were extracted by varying different parameters to reduce artifacts. Iisaka, et al. (1995) used the HT to detect road intersections in single look synthetic aperture radar (SAR) imagery. Iisaka, et al. (1995) compared road intersections found using the HT with those
Figure 5. Illustration of parameters of Hough Transform (from Fitton and Cox, 1998).
P H OTO G R A M M E T R I C E N G I N E E R I N G & R E M OT E S E N S I N G
December 2004
1387
LFX-537.qxd
11/9/04
16:15
Page 1388
on topographic maps of the area. They found a significant number of road intersections were clearly defined. Commission errors caused by stream/road intersections were also observed though not enumerated. Karnielli, et al. (1996) used the HT to detect linear geological features using three different image sources: digitized terrestrial photography, digitized airborne photography, and Landsat TM Imagery. The research compared computerextracted to manually-interpreted features with additional verification in the terrestrial situation coming from field interpretation. The automated algorithm detected only the major features in the terrestrial imagery evaluated by Karnielli, et al. (1996), while the interpreter tended to be biased toward short lines. However, the automated algorithm successfully detected short lines when the images were divided into small pieces (Karnielli, et al., 1996). Multi-Resolution Techniques The appearance of roads in digital imagery is dependent on the spectral and radiometric characteristics of the sensor and the spatial resolution of the imagery. In lower spatial resolution imagery, roads tend to appear as lines as compared to higher resolution imagery (less than two meter GSD) where roads appear as elongated homogeneous regions with consistent width (Baumgartner, et al., 1999). Many authors (e.g., Gibson, 2003; Couloigner and Ranchin, 2000; Baumgartner, et al., 1999; Daida and Vesecky, 1991; Trinder and Wang, 1998; Shneier, 1982) report multi-resolution based approaches to extract roads from imagery. Many multi-resolution approaches generate lower resolution imagery by degrading a high-resolution source. Both Shneier (1982) and Baumgartner, et al. (1999) extracted lines in imagery with reduced resolution, then used this information to identify the roads in the higher resolution imagery. The image degradation often involves generating an image pyramid. Shneier (1982) created a pyramid of images by successively passing a 2 � 2 filter over the image and replacing the four-pixel neighborhood with the median value. As an alternative, Couloigner and Ranchin (2000) used a wavelet transform to generate pyramid layers. Instead of degrading a high-resolution dataset for multi-resolution analysis, some authors use multiple image types. Bonnefon, et al. (2002) used SPOT imagery to approximately identify linear features then used this preliminary data to identify roads in Ikonos imagery. The pyramid approach used by Shneier (1982) took a series of progressively lower resolution images and applied a line detector to the low-resolution images. The author assumed each line in the lower resolution image corresponded to an elongated region in the original image, and attempted to identify the position and extent of these regions. Many authors found distinct benefits by combining the abstraction of the coarser scale with the detailed information found at the finer scale. Trinder and Wang (1998) identified pairs of edges in high-resolution imagery and combined this with lines in lower resolution (re-sampled) imagery in order to fully extract the road network. Baumgartner, et al. (1999) degraded images with 0.2–0.5 meter GSD until roads were a few pixels wide and abstracted lines from this lower resolution image. These lines were used to select edges in the original image that were candidates for roadsides. A pair of edges are accepted as a road if they are approximately parallel, have an approximately homogeneous region between them, and have a corresponding line in the reduced resolution image. A dynamic programming approach (see later section) was used to optimally fit a curve to the individual road segments. Baumgartner, et al. (1999) used a texture-based segmentation procedure to subdivide the imagery into three regions (urban, rural, and forest) and developed local road models to suit each region. In rural areas more than
1388
December 2004
95 percent of roads extracted were actually roads and 80 to 90 percent of roads were extracted. This approach was less successful in urban areas, with a visual assessment showing that the fragmented roads in the built-up area were a challenge for the automated processing algorithm. The test scenes did not include significant forest areas for evaluation. Template Matching Another approach to feature extraction is the use of template matching. In this approach, a template describing the general characteristics of the feature of interest is defined. Templates are often fixed in terms of attributes such as size, shape, and intensity. Features are extracted by moving the template through the image and evaluating the match at each location using a similarity measure (e.g., correlation) to find optimal locations (Suetens, et al., 1992). The measure can include shape (e.g., rectilinearity, parallelism or radial symmetry), image constraints (e.g., forcing consideration of only homogenous regions) or external constraints (Suetens, et al., 1992). While the science behind Feature Analyst® (VLSI, 2003), an extension to ESRI ARCGIS® and ERDAS IMAGINE® software, remains proprietary, the machine learning approach implemented utilizes user-defined templates when searching for specific features. Such templates incorporate both spatial and spectral information. Opitz (2002) evaluated Feature Analyst for extracting roads in pan-sharpened Ikonos imagery. He found that the automated tool provided accurate results with a substantial reduction in labor. Gruen and Li (1997) used a template matching approach to identify roads in digitized aerial imagery with an effective GSD of 1.5 meters. Rather than using a rigidly defined template, they used a least-squares template matching approach to fit roads to a B-spline snake (LSB-SNAKES) using a deformable contour as the template. A snake is a curve that deforms itself from a given initial position to the nearest local maximum of an appropriate metric (Suetens, et al., 1992). The LSB-SNAKES approach used by Gruen and Li (1997) considers both intensity variation and spatial observations. Intensitybased observation equations are developed by matching gray level variation in the image to the intensity variation specified by the model. Spatial observation equations are based on geometric constraints and knowledge of the limitations of the location and shape of the feature to be extracted. The LSBSNAKES technique relies on an operator to identify seed points located approximately along the curve (Gruen and Li, 1997). Agouris, et al. (2001a) used a differential snakes approach to perform change detection of road locations using imagery with a ground resolution of 5 m. The technique developed by Agouris, et al. (2001a) used existing GIS road information for seed points, avoiding the need for manual point identification. A visual evaluation performed by Gruen and Li (1997) showed that the LSB-SNAKES technique was successful even when faced with varying road width, and partial-occlusion caused by buildings, trees and cars. Despite Gruen and Li (1997) emphasizing that one of the benefits of the LSB-SNAKES approach was the metrics available, the results of the leastsquares fitting procedures were not reported, nor were any other numerical results listed. Agouris, et al. (2001a) used manually developed road layers, including intentional discrepancies, to evaluate their change detection process. Poz (2001) presented an edge following technique that used a local template to define roads in imagery with a 2 meter pixel size. The edge-based model used by Poz (2001) was a modified version of that developed by Nevatia and Babu (1980). Poz (2001) evaluated edges by comparing image regions to rotated templates of width equal to the road. The technique required seed points from the operator and relied on a well-defined road model. The road tracing method was
P H OTO G R A M M E T R I C E N G I N E E R I N G & R E M OT E S E N S I N G
LFX-537.qxd
11/9/04
16:15
Page 1389
visually determined to be successful in the relatively simple test case presented by Poz (2001). Dynamic Programming Dynamic programming is a means of optimization through a recursive search, for example to find a global optimum (Suetens, et al., 1992). This approach is applicable only if a function can be expressed in terms of relationships between neighboring pixels alone and involves a sequential decisionmaking process (Gruen and Li, 1997). In the application presented by Gruen and Li (1997), dynamic programming was used to optimize road extraction in SPOT imagery based on the procedure summarized below:
• •
•
Define a curve as a polygon with n vertices; Develop a merit function based on several of the radiometric and geometric properties of the road model (as described in an earlier section e.g., roads are bright, smooth, linear features, with little change in intensity over a short distance), with limitations on road curvature forming a fixed constraint; Move each vertex around in a window (for example, 5 � 5) to find the maximum of the merit function based on the characteristics described above.
To reduce computational complexity, the search at vertex pi was restricted to points that were on the line perpendicular to the curve at pi. To further reduce the complexity an image pyramid approach (as described earlier in the multiresolution discussion) was simulated. Rather than explicitly re-sampling to create the image pyramid, early iterations selected candidates along the line at specified intervals, for example, every third pixel. Later iterations then decreased this interval. As mentioned earlier, the procedure described by Gruen and Li (1997) is performed automatically after receiving input from an operator to define a few approximate locations of the curve vertices. After the first iteration, two new vertices are added if the distance between adjacent vertices is greater than a specified threshold distance. A second iteration is then performed using the new polygon. Vertices are also removed dynamically if they are found to be too close to another vertex, are not necessary for defining the curve, or do not fit the constraints of the model. Bonnefon, et al. (2002) also applied dynamic programming to find an optimal solution when using SPOT imagery to update existing GIS data layers. Pixel Swapping Iisaka and Sakurai-Amano (1995) describe a feature detection approach combining spectral and spatial information. In traditional spectral analysis, the intensity of a pixel (ai) is defined simply by the location of the pixel (xi, yi), that is, spatial relationships between pixels are generally not considered. Iisaka and Sakurai-Amano (1995) described a spectral relationship as a mapping between two ordered sets. This is shown in a simplified form in Equation 2 below where ai is the intensity of pixel (xi, yi): T: {(x0, y0), (x1, y1), . . . , (xi, yi), . . . , (xn, yn)} ⇒ {a0, a1, . . . , ai, . . . , an}.
(2)
The mapping in Equation 1 can be transformed as follows: T: {. . . ,
1 � (ai 2
� ai�k) �
1 � (ai 2
� ai�k), . . .}
or
T � T� � T� (3)
where ai�k is the intensity of a pixel at (xi�k, yi�k) and T+ � {. . . ,
1 � (ai 2
� ai�k), . . .) and T� � {. . . ,
P H OTO G R A M M E T R I C E N G I N E E R I N G & R E M OT E S E N S I N G
1 � (ai 2
� ai�k), . . .).
Considering n pixels within a window, the image T can be expanded as follows: n
n
1 1 1 1 T: . . . , � ai � � a � � ai � � a ,... 2 n k�1 i�k 2 n k�1 i�k
�
�
�
�
�
�
� �
(4)
or
�
n
� �
n
� �
1 1 T+: . . . , � ai � � a , . . . , and 2 n k�1 i+k
�
�
1 1 T_: . . . , � ai � � a ,... . 2 n k�1 i+k
�
�
�
(5)
It can be observed that the subsets T� and T� intrinsically carry spatial relationships by considering an image neighborhood. As an example, a homogenous region has T� � 0 because ai � ai�k (for all local k): an isolated point in a binary image will have T� � T � �12�, since T� and T� will both equal �12� (ai+k � 0 for all k). An inside region has T� � T � 1 when considering a 3 � 3 neighborhood window. Iisaka and SakuraiAmano (1995) call this approach “pixel swapping” because it evaluates the effect of swapping intensity values among pixels. Iisaka and Sakurai-Amano (1995) attempted to extract road data from Landsat TM imagery. A brightness band was calculated from TM bands 1, 2, and 3 and a thresholding was applied to create a binary image that emphasized bright objects (roads and clouds). Using the pixel swapping approach, clouds were then eliminated by dilating areas that were identified as inner regions (Iisaka and Sakurai-Amano, 1995). Iisaka and Sakurai-Amano (1995) made qualitative assessments of the success of the procedure. Knowledge Integration Knowledge engineering is the task of converting knowledge, which may be intuitive, into some exploitable form (Pigeon, et al., 1999a). Combining rules from a variety of sources, including human intuition, can be challenging. Some commercial software vendors now provide tools that support integrating rules from a variety of image and ancillary data sources, for example Expert Classifier©, a component of ERDAS IMAGINE® (Leica, 2003). Fischler, et al. (1981) used a knowledge integration approach to locate roads in imagery. Fischler, et al. (1981) used rules to establish a numerical score for each pixel to indicate the likelihood of that pixel lying on a road (low values represented a greater probability). The road location was determined by finding the lowest cost route that satisfied all imposed constraints, such as continuity. This process can combine a variety of local image feature operators (such as edge detectors) and additional constraint layers in order to optimize the search for roads. Scores from different layers are combined based on knowledge, for example, about the responsiveness of the operators used and the applicability to a particular scene. Fischler, et al. (1981) used the multisource knowledge integration technique to find roads in low-resolution aerial imagery. In their evaluation, they defined “low-resolution” to be imagery where the width of a road was three pixels or less. Fischler, et al. (1981) specified several performance criteria to evaluate the success of the road delineation. These included:
• • • •
No point on the delineated road should be located outside the road boundary when the road is clearly visible; The delineated road should be smooth where the road is straight or smoothly curving (within the limitations of the scanning); The delineated road should be labeled accordingly if it overlays portions of the road that are occluded; The delineated road should follow the actual center of the road if it includes portions of the road that are partially occluded.
December 2004
1389
LFX-537.qxd
11/9/04
16:15
Page 1390
Fischler, et al. (1981) tested their knowledge integration procedure on 50 road segments in imagery covering seven geographic locations. They found no failures when the roads were clearly visible and all assumptions were satisfied. Fischler, et al. (1981) did not find a single model that reliably detected all roads. By using multiple operators, Fischler, et al. (1981) were able to integrate a range of knowledge sources and overcome the limitations of any single operator. Classification-based Feature Extraction A number of articles specifically take advantage of the multispectral nature of sensors such as Landsat TM, SPOT and Ikonos to extract road information. Classification is useful as a preprocessing step in feature extraction, for example, to segment images and focus a model on particular cover types. Classification techniques have also been directly applied to solving the problem of linear feature extraction. In most cases, even with hyperspectral datasets, the spectral information alone was not sufficient to define roads and the classification was one component of a multistage process. Gardner, et al. (2001) found that classification of roads using AVIRIS imagery was challenging because of the similarities of construction materials in roads and roofs. They found that following the classification with the spatial pattern recognition technique of a Q-tree filter improved the result. In some applications, a road network is simply one component of an output product. The focus of the project presented by Baraldi and Parmiggiani (1994) was not aimed specifically at extracting roads, but rather at accurately classifying multispectral satellite imagery such as Landsat TM and SPOT. They used an ISODATA classification in conjunction with geometric image cues, such as defining roads as thin, elongated regions, to extract roads as part of their hierarchical approach to feature extraction. Most traditional classification algorithms, such as ISODATA, perform classification using spectral analysis based on single pixels. The feature extraction routines utilized by the eCognition® software consider image objects rather than single pixels when performing classifications (Definiens, 2003). In many cases, the amount of human intervention required for a spectral based classification limits its utility in developing automated processes. Incorporating other information, such as existing GIS data, allows development of more automated systems. Doucette, et al. (1999) performed a principal component analysis on HYDICE imagery, and then used a maximum likelihood classification to generate a classified layer. This classified layer was combined with coarse GIS data in a neural network in order to extract linear features. The GIS data provided approximate location information for the extraction, speeding up convergence while minimizing user input. Agouris, et al. (2001b) applied an unsupervised classification to Daedalus 3600 imagery, and then used spatial processing through a K-Medians algorithm to determine which of the defined classes represented roads. Other Issues While many of the approaches described in this paper focused on one method for feature extraction, others merged procedures to overcome limitations of one technique by harnessing the strengths of another. Several authors raised the importance of context in image interpretation. Computers, and humans, need appropriate context models to carry out object recognition and scene interpretation (Suetens, et al., 1992). Terrain information may provide a knowledge source for feature extraction; for example, this may provide a constraint on the location of roads and rivers (Yee, 1987). As discussed earlier, in their search for roads, Baumgartner, et al. (1999) first segmented images into different contexts, and then used the appropriate context to focus the extraction accordingly. Many feature extraction techniques incorporate contextual considerations.
1390
December 2004
There are a variety of programming approaches used to solve the extraction problem. Iisaka and Sakurai-Amano (1995) used genetic algorithms in order to reduce the computing cost of the extraction method they implemented. Neural networks were important in many analyses (e.g., Doucette, et al., 1999; Lepage, et al., 2000). Suetens, et al. (1992) described more complex search strategies that systematically constrain the search space by finding and refining partial matches. These procedures may include techniques that refine matches based on re-segmentation, template matching, flexible model matching, or by any of the other techniques described above. The advantages of data fusion were discussed in the multi-resolution context. For example, Gibson (2003) combined one meter panchromatic with four meter multispectral Ikonos imagery in seeking to extract roads. Hellwich and Guenzl (2000) discuss the advantage of fusing different data types based on the fundamental differences in image content. The material an object is made of largely determines the appearance of that object in multispectral imagery; panchromatic imagery often has higher spatial resolution and therefore, provides geometric detail; microwave sensors such as synthetic aperture radar contain information about surface roughness. Hellwich and Guenzl (2000) combined the differing information within these various sources to great advantage in feature extraction. Assessing Feature Extraction Techniques Many authors list a host of reasons for automating feature extraction, ranging from time, cost and energy savings, to product improvements, such as, increased detail or accuracy. Unfortunately, many of the papers reviewed did not provide results to support these claims. Many authors stated intentions of locating points in the field for verification of absolute position, but did not include accuracy statistics for the study reported. Most of the papers reviewed relied heavily on visual assessment for reporting the success of the feature extraction algorithm. For example, Yee (1987) visually compared road extraction using two different automated methods to roads extracted manually, reporting only that the manual identification results were comparable to that of the automated procedure. Baumgartner, et al. (1999) compared roads automatically identified in several test images with manually plotted reference data to report errors of omission and commission in applying their road extracting techniques. Baumgartner, et al. (1999) also reported the relative geometric accuracy for correctly identified roads, comparing the distance in pixels between visually identified road locations and those that had been extracted automatically. Such assessments are limited by the accuracy of the manual road identification. Authors such as Agouris, et al. (2001a) experimented with synthetic images in order to evaluate the validity of their algorithm. For the papers that did report accuracy statistics, the most commonly reported measures were total correct, errors of commission and errors of omission. Some authors (e.g., Fischler, et al., 1981) also defined performance criteria to evaluate their extraction technique. Many authors state that automated feature extraction procedures provide significant benefits in terms of saving operator time and effort. In spite of this, few of the studies reviewed stated results to support this assertion. Some papers showed that the automated procedure was in fact slower than manual extraction (e.g., O’Brien, 1989). However, these evaluations typically considered only a small test area and many were performed at a time when computer power was significantly less than what it is today. Additionally, many algorithms presented were in experimental stages and issues such as robustness were more of a priority that computational efficiency (Agouris, et al., 2001a).
P H OTO G R A M M E T R I C E N G I N E E R I N G & R E M OT E S E N S I N G
LFX-537.qxd
11/9/04
16:15
Page 1391
Conclusions Feature extraction is important for a variety of applications, particular due to the increasing interest in automatically updating GIS databases from imagery. Automation is becoming increasingly important to efficiently manage the vast amount of imagery that is being collected and archived. This includes imagery from across the electromagnetic spectrum with a range of spatial resolutions. This paper reviewed a variety of techniques used for identifying linear, planimetric features in remotely-sensed imagery. The techniques reviewed relied on spectral, spatial, and radiometric rules in order to effectively extract features of interest. Many of the papers reviewed reported qualitative results that were based on a visual assessment. Those that provided more quantitative results were often very vague in defining how the evaluation was performed. Traditional methods used for classification typically use confusion matrices for expressing accuracy. Feature extraction routines tend to focus on a single feature, for example roads, which reduces the confusion matrix to a report of a total count of the feature detected and errors of commission and omission. Some authors developed synthetic images with defined noise levels in order to evaluate the success of the feature extraction algorithm. Many of the techniques described require preliminary input from either a human operator or from existing data layers. One of the aims of ongoing research into feature extraction is to increase the level of automation while reducing the amount of human input required. To achieve this will require significant improvements in the reliability of the automated systems. Whether knowledge based computer systems will improve to the level that the interpreter is no longer required is yet to be seen. What is certainly true is that civilian access to imagery is increasing, and without automation, much of this imagery will never be used.
References Agouris, P., A. Stefanidis, and S. Gyftakis, 2001a. Differential snakes for change detection in road segments, Photogrammetric Engineering & Remote Sensing, 67(12):1391–1399. Agouris, P., P. Doucette, and A. Stefanidis, 2001b. Spatiospectral cluster analysis of elongated regions in aerial imagery, Proceedings of the IEEE International Conference on Image Processing, 07–10 Oct, Thessaloniki, Greece, pp. 789–792. Ahac, A.A., R. Defoe, and M.C. van Wijk, 1992. Considerations in the design of a system for the rapid acquisition of geographic information, Photogrammetric Engineering & Remote Sensing, 58(1): 95–100. Alharthy, A., and J. Bethel, 2003. Automated road extraction from lidar data, Proceedings of the ASPRS Annual Conference, 05–09 May, Anchorage, Alaska (American Society for Photogrammetry and Remote Sensing), unpaginated CD-ROM. Ansoult, M.M., P.J. Soille, and J.A. Loodts, 1990. Mathematical morphology: A tool for automated GIS data acquisition from scanned thematic maps, Photogrammetric Engineering & Remote Sensing, 56(9):1263–1271. Baltsavias, E.P., A. Gruen, and L. Van Gool (editors), 2001. Automated Extraction of Man-Made Objects from Aerial and Space Images (III), A. A. Balkema Publishers, Lisse, The Netherlands, 415 p. Baraldi A., and F. Parmiggiani, 1994. A Nagao-Matsuyama approach to high-resolution satellite image classification, IEEE Transactions on Geoscience and Remote Sensing, 32(4):749–758. Baumgartner, A., C. Steger, H. Mayer, W. Eckstein, and H. Ebner, 1999. Automatic road extraction based on multi-scale, grouping, and context, Photogrammetric Engineering & Remote Sensing, 65(7): 777–785. Bonnefon, R., P. Dhérété, and J. Desachy, 2002. Geographic information system updating using remote sensing images, Pattern Recognition Letters, 23(9):1073–1083.
P H OTO G R A M M E T R I C E N G I N E E R I N G & R E M OT E S E N S I N G
Chanussot, J., G. Mauris, and P. Lambert, 1999. Fuzzy fusion techniques for linear features detection in multitemporal SAR images, IEEE Transactions on Geoscience and Remote Sensing, 37(3): 1292–1305. Couloigner, I., and T. Ranchin, 2000. Mapping of urban areas: A multiresolution modeling approach for semi-automatic extraction of streets, Photogrammetric Engineering & Remote Sensing, 66(7): 867–874. Daida, J.M., and J.F. Vesecky, 1991. Mathematical morphology for automated analysis of remotely sensed objects, Proceedings of International Geoscience and Remote Sensing Symposium, 03– 06 June, Espoo, Finland, pp. 1795–1799. Definiens, 2003. Definiens eCognition homepage, URL: http://www. definiens-imaging.com (last date accessed: 22 September 2004). Destival, I., 1986. Mathematical morphology applied to remote sensing, Acta Astronautica, 13(6/7):371–385. Dial, G., L. Gibson, and R. Poulsen, 2001. IKONOS satellite imagery and its use in automated road extraction, Automated Extraction of Man-Made Objects from Aerial and Space Images (III) (E. Baltsavias, A. Gruen, and L. Van Gool, editors), A. A. Balkema Publishers, Lisse, The Netherlands, pp. 349–358. Digital Globe, 2003. Digital Globe homepage, URL: http://www.digitalglobe.com (last date accessed: 22 September 2004). Dong, P., 1997. Implementation of mathematical morphological operations for spatial data processing, Computer and Geosciences, 23(1):103–107. Doucette, P., P. Agouris, M. Musavi, and A. Stefanidis, 1999. Automated extraction of linear features from aerial imagery using Kohonen learning and GIS data, Lecturer Notes in Computer Science: Integrated Spatial Databases Workshop—Digital Images and GIS, Volume 1737, pp. 20–33. Duda, R.O., and P.E. Hart, 1972. Use of the Hough transformation to detect lines and curves in pictures, Communications of the ACM, 15(1):11–15. Firestone, L., S. Rupert, J. Olsen, and W. Mueller, 1996. Automated feature extraction: The key to future productivity, Highlight Article in Photogrammetric Engineering & Remote Sensing, 62(6): 671–674. Fischler, M.A., J.M. Tenenbaum, and H.C. Wolf, 1981. Detection of roads and linear structures in low-resolution aerial imagery using a multisource knowledge integration technique, Computer Graphics and Image Processing, 15:201–233. Fitton, N.C., and S.J.D. Cox, 1998. Optimising the application of the Hough transform for automatic feature extraction from geoscientific images, Computers and Geosciences, 24(10):933–951. Gardner, M.E., D.A. Roberts, C. Funk, and V. Noronha, 2001. Road extraction from AVIRIS using spectral mixture and Q-tree filter techniques, Proceedings of the AVIRIS Airborne Geoscience Workshop, 27 February–March, Pasadena, California, URL: http:// aviris. jpl.nasa.gov/docs/workshops/aviris.proceedings.html (last date accessed: 22 September 2004). Gibson, L., 2003. Finding road networks in IKONOS satellite imagery, Proceedings of the ASPRS Annual Conference, 05–09 May, Anchorage, Alaska (American Society for Photogrammetry and Remote Sensing), unpaginated CD-ROM. Gruen, A., and H. Li, 1997. Semi-automatic linear feature extraction by dynamic programming and LSB-snakes, Photogrammetric Engineering & Remote Sensing, 63(8):985–995. Gruen, A., E. Baltsavias, and O. Henricsson (editors), 1997. Automatic Extraction of Man-Made Objects from Aerial and Space Images (II), Birkhaeuser Verlag, Basel, Switzerland, 364 p. Gruen, A., O. Kuebler, and P. Agouris (editors), 1995. Automatic Extraction of Man-Made Objects from Aerial and Space Images, Birkhaeuser Verlag, Basel, Switzerland, 320 p. Guindon, B., 1998. Application of spatial reasoning methods to the extraction of roads from high resolution satellite imagery, Proceedings of International Geoscience and Remote Sensing Symposium, 6–10 July, Seattle, Washington, pp. 1076–1078. Guindon, B., 1999. The development of perceptual grouping operators to aid in the extraction of planimetric features from high resolution satellite images, Proceedings of ASPRS Annual Conference, 17–21 May, Portland, Oregon, pp. 257–260.
December 2004
1391
LFX-537.qxd
11/9/04
16:15
Page 1392
Hellwich, O., I. Laptev, and H. Mayer, 2002. Extraction of linear objects from interferometric SAR data, International Journal of Remote Sensing, 23(3):461–475. Hellwich, O., and M. Guenzl, 2000. Landuse classification by fusion of optical and multitemporal SAR imagery, Proceedings of the International Geoscience and Remote Sensing Symposium, 24–28 July, Honolulu, Hawaii, pp. 1921–1923. Hemmer, T.H., 1996. Towards automation of the extraction of lines of communication from multispectral images using a spatio-spectral extraction technique, Proceedings of the SPIE: Algorithms for Multispectral and Hyperspectral Imagery II, 09–11 April, Orlando Florida, Volume 2758, pp. 115–126. Hinz, S., A. Baumgartner, H. Mayer, C. Wiedemann, and H. Ebner, 2001. Automated Extraction of Man-Made Objects from Aerial and Space Images (III) (E. Baltsavias, A. Gruen and L. Van Gool, editors), A. A. Balkema Publishers, Lisse, The Netherlands, pp. 255–265. Hui, A., S.C. Liew, and L.K. Kwoh, 2001. Extraction of linear features in multispectral imagery, Proceedings of the International Geoscience and Remote Sensing Symposium, 09–13 July, Sydney, NSW, Australia, pp. 2310–12. Iisaka, J., and T. Sakurai-Amano, 1995. Automated terrain feature detection from remotely sensed images integrating spectral, spatial and geometrical attributes of objects, Proceedings of the GIS/LIS Conference, 14–16 May, Nashville, Tennessee, pp. 486–495. Iisaka, J., T. Sakurai-Amano, and T.I. Lukowski, 1995. Automated detection of road intersections from ERS-1 SAR imagery, Proceedings of International Geoscience and Remote Sensing Symposium, 10–14 July, Firenze, Italy, pp. 676–678. Karnielli, A., A. Meisels, L. Fisher, and Y. Arkin, 1996. Automatic extraction and evaluation of geological linear features from digital remote sensing data using a Hough transform, Photogrammetric Engineering & Remote Sensing, 62(5):525–531. Katartzis, A., H. Sahli, V. Pizurica, and J. Cornelis, 2001. A modelbased approach to the automatic extraction of linear features from airborne images, IEEE Transactions on Geoscience and Remote Sensing, 39(9):2073–2079. Lee, T.H., and W.M. Moon, 2002. Lineament extraction from Landsat TM, JERS-1, and DEM for geological applications, Proceedings of International Geoscience and Remote Sensing Symposium, 24–28 June, Toronto, Ontario, Canada, pp. 3276–3278. Leica, 2003. Leica Geosystems GIS and Mapping Division homepage, URL: http://gis.leica-geosystems.com (last date accessed: 22 September 2004). Lepage, R., R.G. Rouhana, B. St-Onge, R. Noumeir, and R. Desjardins, 2000. Cellular neural network for automated detection of geological lineaments on radarsat images, IEEE Transactions on Geoscience and Remote Sensing, 38(3):1224–1233. McKeown, Jr., D.M., C. McGlone, S.D. Cochran, Y.C. Hsieh, M. Roux, and J.A. Shufelt, 1996. Feature Extraction and Object Recognition, Manual of Photogrammetry Addendum, American Society for Photogrammetry and Remote Sensing, Bethesda, Maryland, pp. 195–211. Nevatia, R., and K.R. Babu, 1980. Linear feature extraction and description, Computer Graphics and Image Processing, 13: 257– 269. O’Brien, D., 1989. Road network extraction from SPOT panchromatic data, CISM Journal ACSGC, 43(20):121–126. Opitz, D.W., 2002. Hierarchical feature extraction: Removing the clutter, Proceedings of the ESRI International User Conference, 08–12 July, San Diego, California, unpaginated CD-ROM. Park, J.S., R.A. Saleh, and Y. Yeu, 2002. Comprehensive survey of extraction techniques of linear features from remote sensing imagery for updating road spatial databases, Proceedings of the ACSM-ASPRS Annual Conference, 21–26 April, Washington D.C. (American Society for Photogrammetry and Remote Sensing), unpaginated CD-ROM. Pelletier, R.E., 1985. Identification of linear features in agricultural landscapes through spatial analyses of thermal infrared multispectral scanner data, Proceedings of ASP/ACSM Convention, 10–15 March, Washington D.C., pp. 381–390.
1392
December 2004
Penn, B.S., and K.E. Livo, 2002. Using the semi-automated plugin tool for feature identification, recognition and extraction (SPITFIRE) to extract roads and surface material types from AVIRIS imagery, Proceedings of the AVIRIS Airborne Geoscience Workshop, Pasadena, California, URL: http://aviris.jpl.nasa.gov/ docs/workshops/aviris.proceedings. html (last date accessed 22 September 2004). Pigeon, L., B. Moulin, B. Solaiman, T. Toutin, and K.P.B. Thomson, 1999a. Human-experts features extraction strategies for topographical map production and updating, Proceedings of International Geoscience and Remote Sensing Symposium, 28 June–02 July, Hamburg, Germany, pp. 296–298. Pigeon, L., B. Solaiman, K.P.B. Thomson, B. Moulin, and T. Toutin, 1999b. Human-experts rules modeling for linear planimetric features extraction in a remotely sensed images data fusion context, Proceedings of International Geoscience and Remote Sensing Symposium, 28 June–02 July, Hamburg, Germany, pp. 2369–2371. Plugers, P., 1999. Product survey on digital photogrammetric workstations, GIM International, 15(5/7):61-61/53. Poz, A.P.D., 2001. Semi-automatic road extraction based on edge and correlation analyses, Proceedings of the ASPRS Annual Conference, 23–27 August, St Louis, Missouri (American Society for Photogrammetry and Remote Sensing), unpaginated CD-ROM. Rowe, N.C., and L.L. Grewe, 2001. Change detection for linear features in aerial photographs using edge-finding, IEEE Transactions on Geoscience and Remote Sensing—Communications, 39(7): 1608–1612. Serra, J., 1986. Introduction to mathematical morphology, Computer Vision, Graphics and Image Processing, 35:283–305. Shneier, M.O., 1982. Extracting linear features from images using pyramids, IEEE Transactions on Systems, Man and Cybernetics, July–Aug:569–572. Sijmons, K., 1987. Computer-assisted detection of linear features from digital remote sensing data, ITC Journal, 1:23–31. Space Imaging, Inc., 2003. Space Imaging home page, URL: http://www. spaceimaging.com (last date accessed: 22 September 2004). Suetens, P., P. Fua, and A.J. Hanson, 1992. Computational strategies for object recognition, ACM Computing Surveys, 24(1):5–61. Trinder, J.C., and Y. Wang, 1998. Automatic road extraction from aerial images, Digital Signal Processing, 8(4):215–224. Tupin, F., H. Maitre, J.-F. Mangin, J.-M. Nicholas, and E. Pechersky, 1998. Detection of linear features in SAR images: Application to road network extraction, IEEE Transactions on Geoscience and Remote Sensing, 36(2):434–453. VLSI (Visual Learning Systems, Inc.), 2003. Feature Analyst home page, URL: http://www.featureanalyst.com (last date accessed: 22 September 2004). Wang, J., and Q. Zhang, 2000. Applicability of a gradient profile algorithm for road network extraction: Sensor, resolution and background considerations, Canadian Journal of Remote Sensing, 26(5):428–439. Wolf, P.R., and B.A. Dewitt, 2000. Elements of Photogrammetry: With Applications in GIS, Third Edition, McGraw Hill, Boston, Massachusetts, 608 p. Xiong, D., 2001. Automated road network extraction from high resolution images, Technical Notes, U.S. Department of Transportation, National Consortia on Remote Sensing in Transportation, Albuquerque, New Mexico, Issue 3, May, pp. 1–4. Yamada, H., K. Yamamoto, and K. Hosokawa, 1993. Directional mathematical morphology and reformalized Hough transformation for the analysis of topographic maps, IEEE Transactions on Pattern Analysis and Machine Intelligence, 15(4):380–387. Yee, B., 1987. An expert system for planimetric feature extraction, Proceedings of International Geoscience and Remote Sensing Symposium, 18–21 May, Ann Arbor, MI, pp. 321–325.
P H OTO G R A M M E T R I C E N G I N E E R I N G & R E M OT E S E N S I N G