Interpolation Technique for Extracting Features from ECG Signals Sampled at Low Sampling Rates P Castiglioni, L Piccini, M Di Rienzo Centro di Bioingegneria FDG, Fond. Don Gnocchi, Milan, Italy with good accuracy from ECG sampled at low sampling rates. This low sampling can be performed because the parameters of interest are derived from the QRS complex only and this component of the ECG wave has a frequency content between 10 and 25 Hz [3]. To test the method, we analysed a public database of ECG signals [4], and we compared the tR and AQRS estimates obtained with and without the use of the interpolation technique.
Abstract The occurrence of the R peak (tR), and the area of the QRS complex (AQRS) are among the features estimated from each ECG wave. To estimate these parameters ECG is traditionally sampled at a high sampling rate (250-500Hz). However, since tR and AQRS are identified by the selective analysis of the QRS complex and since the QRS maximal frequency component is about 25 Hz, we propose a new procedure to identify tR and AQRS from ECG sampled at the relatively low rate dictated by the frequency content of the QRS complex. The procedure identifies each QRS complex from the sampled ECG, and estimates tR and AQRS after interpolation of the QRS complex. The interpolation is obtained as the Inverse Discrete Fourier Transform (IDFT) of the zero-padded DFT of the QRS. The technique was tested on a public database of ECG. Results showed that by this technique tR and AQRS can be accurately derived from ECG sampled at frequency as low as 70 Hz.
1.
2.
The method is based on the identification and local reconstruction of the QRS complex by means of an interpolation obtained with a zero-padding procedure. This section briefly reviews the theory of zero-padding and describes the algorithms used to derive tR and AQRS from the interpolated QRS.
2.1.
Theory of zero-padding
Zero-padding consists of extending the length of a series of numbers by adding zeros. If we compute the Discrete Fourier Transform (DFT) of a signal after zeropadding, we obtain a Fourier transform with additional interpolated values. After zero-padding the spectral estimate is smoother and, although the frequency resolution is unchanged, the identification of spectral peaks may be easier. Signal zero-padding is often used when Fast Fourier Transform (FFT) algorithms, which requires the number of data to be a power of two, should be applied on shorter time-series. Zeros are appended to cause the sequence length to become a power of two and the FFT is calculated on the zero-padded sequence. However, zero-padding can be also applied to a DFT in order to interpolate in the time-domain. If zeros are added to a DFT at frequencies higher than the Nyquist frequency, the inverse DFT results in an interpolation of the original time-series. The sampling rate of the interpolated series is twice the highest frequency in the zero-padded DFT (fig.1). Since zero-padding largely increases the number of complex terms in the DFT, the calculation of IDFT after
Introduction
In studies focussing on Heart Rate Variability (HRV), specific features of each ECG wave are identified from the QRS complex: typically, the time of occurrence of the R peak (tR) - from which the tachogram is computed - or the area of the QRS complex (AQRS) - which is used to derive the respiratory frequency [1]. Traditionally, a good estimate of these parameters is obtained by over sampling of the ECG signal. This approach results in a large amount of data. Alternatively, ECG can be sampled at the Nyquist frequency but this procedure requires a sinc (x) interpolation of the sampled signal [2] which is extremely time consuming. In both instances, however, a large amount of data need to be stored or large computation power is required. These requirements may be impractical in specific areas, like in telemonitoring applications, or where signals should be recorded by low power and low cost systems. In this paper we propose and validate a computationally efficient method to identify tR and AQRS
0276−6547/03 $17.00 © 2003 IEEE
Method
481
Computers in Cardiology 2003;30:481−484.
ms window centred around R' (this window is sufficiently wide to contain the whole QRS complex); Step 3. DFT of the M samples; Step 4. Zero-padding of the DFT. Zeros are added at frequencies higher than the Nyquist frequency until the frequency of the last padded zero is half the required sampling rate of the interpolated QRS; Step 5. Calculation of the IDFT between R'-1 and R'+1 and identification of the position of the IDFT maximum: this is the estimated time of occurrence of the R peak, tR.
zero-padding should require a greater computational load. In practice, however, it is possible to rewrite the expression of the IDFT so that after zero-padding the calculation of any value of the Inverse DFT does not require the use of larger arrays to store all the DFT values, and does not require a higher number of calculations.
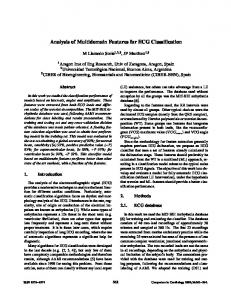
Figure 1. Effects of zero-padding the DFT. Left: the DFT of 16 samples of a 0.1-Hz sinusoid sampled at 1 Hz; its IDFT gives the original time-series. Right: zeros are padded to the DFT up to 8.5 Hz; the IDFT is an interpolation of the original series at 17 Hz. In fact, let's call Xm, {m=0, 1, …, M-1} the M values of the DFT spectrum, and Ym {m=0, 1, …, N-1} the N values of the same DFT after zero-padding with Z zeroes (N=M+Z). By definition, the k-th sample of the IDFT of Ym, xk, is:
Since : Ym= Xm for m=0, 1, …, M-1 Ym= 0 for m=M, M+1, …N we have that:
Thus, the calculation of xk with or without zero-padding of the DFT requires the same usage of memory and the same number of complex multiplications.
2.2.
Identification of tR
The time position of the R peak is derived as follows. Step 1. Identification of the position of the maximum sample of the QRS complex, R'; Step 2. Identification of the M samples falling in a 180
Figure 2. Main steps of the algorithm for the identification of tR (see text). R' is the highest sample of the QRS complex.
482
2.3.
Identification of AQRS
The area of the QRS complex is derived as follows. Step 1. Bandpass filtering for baseline removal. Step 2. Identification of tR (as described above) Step 3. Interpolation of the QRS complex in an 80 ms window centred around tR Step 4. Calculation of the area of the interpolated signal.
Figure 4. Tachograms derived from an ECG sampled at 62.5 Hz without and with zero-padding interpolation. In both panels the reference tachogram (dotted line) is also shown. When the interpolation is applied, reference values and estimates are practically superimposed.
Figure 3. Identification of the QRS area (see text).
3.
Validation
The method was tested by analyzing a public database of ECG signals recorded in 21 subjects for about 10-12 minutes twice: in supine and standing positions [4]. The ECG was sampled at 500 Hz. For each recording, we derived the beat-by-beat series of tR, and AQRS: these were our reference values. Then we sub-sampled each ECG signal by taking 1 sample every 2 samples (sampling frequency=250 Hz), 1 every 3 (166.7 Hz), 1 every 4 (125 Hz) and so on up to 1 every 10 samples (50 Hz). In each sub-sampled series, tR and AQRS were derived twice: without and with zero-padding interpolation. We padded enough zeros in the DFT so that the last zero was placed at 250 Hz (corresponding to a sampling frequency of 500 Hz in the reconstructed signal). Figures 4 and 5 show an example of beat-by-beat estimates of tR and AQRS obtained without and with interpolation. The clear differences between estimates and references almost disappear when the interpolation is applied. The accuracy of the estimates was quantified by comparing tR and AQRS with the reference values. This was done by computing the Root Mean Square (RMS) Error for each ECG, and by assessing median and percentiles of RMS Error over the group of subjects.
Figure 5. Area of QRS derived from an ECG sampled at 100 Hz without and with zero-padding interpolation. In both panels the reference values (dotted line) are also shown.
483
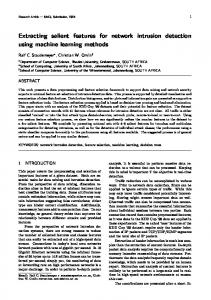
Figure 6. RMS Error of the beat-by-beat estimation of tR (left) and AQRS (right) without (′) and with (⊗) the use of the interpolation technique: median and percentiles (10% and 90%) in the group of 21 subjects. RMS Error is expressed in ms for tR and as percentage of the reference value for AQRS compatible with the frequency content of the QRS complex, which typically does not exceed 25 Hz [3].
Results are shown in figure 6. Without interpolation, the median error of tR is equal to 2 ms at 250 Hz, linearly increasing when the sampling rate decreases. With the interpolation, the median error is lower than 2 ms even if the ECG is sampled at about 60 Hz only. As to AQRS, the interpolation maintains the median error lower than 2% up to 70 Hz while, without interpolation, the error exceeds the 2% threshold at rates lower than 200 Hz. However, even with the interpolation, the error dramatically increases at frequencies lower than 70 Hz.
4.
References [1] Moody GB, Mark RG, Zoccola A, Mantero S. Derivation of Respiratory Signals from Multi-lead ECGs Computers in Cardiology 1985; 12:113-116 [2] Oppenheim AV, Willsky AS. Signals and Systems. Prentice-Hall, Englewood Cliffs, NJ, 1983 [3] Kohler BU, Henning C, Orglmeister R. The principles of software QRS detection IEEE Engineering in Medicine and Biology 2002;1:42-57 [4] The Eurobavar dataset for BRS estimation: http://www.cbi.polimi.it/glossary/eurobavar.html
Conclusions
The proposed procedure is computationally fast and does not require high usage of memory. Thus, it seems suitable for improving the accuracy of HRV measures in those applications where a high sampling rate is difficult to obtain. The validation on real signals showed that it can interpolate sufficiently well the peak of the R wave and the whole QRS complex even at sampling rates as low as 60 Hz and 70 Hz respectively, providing reliable estimates of tR and AQRS at these very low rates. These good performances in signal reconstruction are
Address for correspondence. Paolo Castiglioni. Centro di Bioingegneria FDG Fondazione Don C. Gnocchi via Capecelatro 66, I 20148 Milan, ITALY E-mail
[email protected]
484