*Manuscript Click here to view linked References
1 2 3 4 5 6 7 8 9 10 11 12 13 14 15 16 17 18 19 20 21 22 23 24 25 26 27 28 29 30 31 32 33 34 35 36 37 38 39 40 41 42 43 44 45 46 47 48 49 50 51 52 53 54 55 56 57 58 59 60 61 62 63 64 65
A review on computer vision based defect detection and condition assessment of concrete and asphalt civil infrastructure Christian Kocha,* Kristina Georgievaa, Varun Kasireddyb, Burcu Akincib, and Paul Fieguthc a
Chair of Computing in Engineering, Ruhr-Universität Bochum, Universitätstraße 150, 44801 Bochum, Germany;
b
*
Dept. of Civil and Environmental Engineering, Carnegie Mellon University, Pittsburgh, PA 15213, United States c Dept. of Systems Design Engineering, Faculty of Engineering, University of Waterloo, Waterloo, Ontario, Canada N2L 3G1
Corresponding author: Phone: +49-234-32-26174; E-mail:
[email protected]
1 2 3 4 5 6 7 8 9 10 11 12 13 14 15 16 17 18 19 20 21 22 23 24 25 26 27 28 29 30 31 32 33 34 35 36 37 38 39 40 41 42 43 44 45 46 47 48 49 50 51 52 53 54 55 56 57 58 59 60 61 62 63 64 65
Abstract: To ensure the safety and the serviceability of civil infrastructure it is essential to visually inspect and assess its physical and functional condition. This review paper presents the current state of practice of assessing the visual condition of vertical and horizontal civil infrastructure; in particular of reinforced concrete bridges, precast concrete tunnels, underground concrete pipes, and asphalt pavements. Since the rate of creation and deployment of computer vision methods for civil engineering applications has been exponentially increasing, the main part of the paper presents a comprehensive synthesis of the state of the art in computer vision based defect detection and condition assessment related to concrete and asphalt civil infrastructure. Finally, the current achievements and limitations of existing methods as well as open research challenges are outlined to assist both the civil engineering and the computer science research community in setting an agenda for future research. Keywords: Computer Vision, Infrastructure, Condition assessment, Defect detection, Infrastructure monitoring
Research Highlights:
Visual inspection of civil infrastructure is essential for condition assessment. We focus on concrete bridges, tunnels, underground pipes, and asphalt pavements. Accordingly, we review the latest computer vision based defect detection methods. Using computer vision most relevant types of defects can be automatically detected. Automatic defect properties retrieval and assessment has not been achieved yet.
2
1 2 3 4 5 6 7 8 9 10 11 12 13 14 15 16 17 18 19 20 21 22 23 24 25 26 27 28 29 30 31 32 33 34 35 36 37 38 39 40 41 42 43 44 45 46 47 48 49 50 51 52 53 54 55 56 57 58 59 60 61 62 63 64 65
1. INTRODUCTION Manual visual inspection is currently the main form of assessing the physical and functional conditions of civil infrastructure at regular intervals in order to ensure the infrastructure still meets its expected service requirements. However, there are still a number of accidents that are related to insufficient inspection and condition assessment. For example, as a result of the collapse of the I-35W Highway Bridge in Minneapolis (Minnesota, USA) in 2007 13 people died, and 145 people were injured [1]. In the final accident report the National Transportation Safety Board identified major safety issues including, besides others, the lack of inspection guidance for conditions of gusset plate distortion; and inadequate use of technologies for accurately assessing the condition of gusset plates on deck truss bridges. A different, less tragic example is the accident of a freight train in the Rebunhama Tunnel in Japan in 1999 that resulted in people losing the trust in the safety and durability of tunnels. According to [2], the failure to detect shear cracks had resulted in five pieces of concrete blocks, as large as several tens of centimeters, which had fallen onto the track causing the train to derail. In order to prevent these kinds of accidents it is essential to continuously inspect and assess the physical and functional condition of civil infrastructure to ensure its safety and serviceability. Typically, condition assessment procedures are performed manually by certified inspectors and/or structural engineers, either at regular intervals (routine inspection) or after disasters (post-disaster inspection). This process includes the detection of the defects and damage (cracking, spalling, defective joints, corrosion, potholes, etc.) existing on civil infrastructure elements, such as buildings, bridges, tunnels, pipes and roads, and the defects’ magnitude (number, width, length, etc.). The visual inspection and assessment results help agencies to predict future conditions, to support investment planning, and to allocate limited maintenance and repair resources, and thus ensure the civil infrastructure still meets its service requirements. This review paper starts with the description of the current practices of assessing the visual condition of vertical and horizontal civil infrastructure, in particular of reinforced concrete bridges (horizontal: decks, girders, vertical: columns), precast concrete tunnels (horizontal: segmental lining), underground concrete pipes (horizontal) (wastewater infrastructure), and asphalt pavements (horizontal). In order to motivate the potential of computer vision, this part focuses on answering the following questions: 1) what are the common visual defects that cause damage to civil infrastructure; 2) what are the typical manual procedures to detect those defects; 3) what are the limitations of manual defect detection; 4) how are the defects measured; and 5) what tools and metrics are used to assess the condition of each infrastructure element. Due to the availability of low cost, high quality and easy-to-use visual sensing technologies (e.g. digital cameras), the rate of creation and deployment of computer vision methods for civil engineering applications has been exponentially increasing over the last decade. Computer vision modules, for example, are becoming an integral component of modern Structural Health Monitoring (SHM) frameworks [3]. In this regards, the second and largest part of the paper presents a comprehensive synthesis of the state of the art in computer vision based defect detection and condition assessment of civil infrastructure. In this respect, this part explains and 3
1 2 3 4 5 6 7 8 9 10 11 12 13 14 15 16 17 18 19 20 21 22 23 24 25 26 27 28 29 30 31 32 33 34 35 36 37 38 39 40 41 42 43 44 45 46 47 48 49 50 51 52 53 54 55 56 57 58 59 60 61 62 63 64 65
tries to categorize several state-of-the-art computer vision methodologies, which are used to automate the process of defect and damage detection. Basically, these methods are built upon common image processing techniques, such as template matching, histogram transforms, background subtraction, filtering, edge and boundary detection, region growing, texture recognition, and so forth. It is shown, how these techniques have been used, tested and evaluated to identify different defect and damage patterns in remote and close-up images of concrete bridges, precast concrete tunnels, underground concrete pipes and asphalt pavements. The third part summarizes the current achievements and limitations of computer vision for infrastructure condition assessment. Based on that, open research challenges are outlined to assist both the civil engineering and the computer science research community in setting an agenda for future research.
2. STATE OF PRACTICE IN VISUAL CONDITION ASSESSMENT This section presents the state of practice in visual condition assessment of reinforced concrete bridges, precast concrete tunnels, underground concrete pipes and asphalt pavements. 2.1 Reinforced concrete bridges As per US Federal Highway Administration (FHWA)’s recent bridge element inspection manual [4], during a routine inspection of a reinforced concrete (RC) bridge, it is mandatory to identify, measure (if necessary) and record information related to damage and defects, such as delamination/spall/patched area, exposed rebar, efflorescence/rust staining, cracking, abrasion/wear, distortion, settlement and scouring. While this list of defects comprises the overall list for common RC bridge element categories, such as decks and slabs, railings, superstructure, substructure, culverts and approach ways, not all defects are applicable to all components. Table 1 highlights which defects are applicable to which components and hence need to be checked for each type of component on a bridge. While some of the stated defects are visually detected, some others of them may require physical measurements for accurate documentation and assessment. The size of the defect plays an important factor in deciding if it is necessary to go beyond the visual approach. In addition to the list of defects stated above, FHWA also mandates that all bearings should be checked during inspection, irrespective of the material type and functional type of the bridge. Some of the relevant defects for bearings are corrosion, connection problems, excessive movement, misalignment, bulging, splitting and tearing, loss of bearing area, and damage. Furthermore, for seals and joints, inspectors focus on a specific set of defects, such as leakage, adhesion loss, seal damage, seal cracking, debris impaction, poor condition of adjacent deck, and metal deterioration or damage. While most of these defects can be detected visually, assessing
4
1 2 3 4 5 6 7 8 9 10 11 12 13 14 15 16 17 18 19 20 21 22 23 24 25 26 27 28 29 30 31 32 33 34 35 36 37 38 39 40 41 42 43 44 45 46 47 48 49 50 51 52 53 54 55 56 57 58 59 60 61 62 63 64 65
severity of the defects however needs close-up examination and measurements with suitable tools and equipment. All of the existing defects on a bridge are categorized on a scale of 1 to 4 - each corresponding to the condition state of a particular element (1-Good, 2-Fair, 3-Poor, and 4-Severe). The condition state is an implicit function of severity and extent of a defect on a component. Though such categorization of condition states provides uniformity for each component and effects, the actual assessment that results in such categorization can be subjective. Table 2 provides some examples of guidelines provided in [4] for categorization of the condition states of different defects. Please refer to Appendix D2.3 in [4] for the complete list of guidelines for all defects. There are typically three ways to perform manual inspection for concrete bridge elements: visual, physical and advanced. A combination of these methods is required depending on the condition of the bridge member under consideration. During visual inspection, an inspector focuses on surface deficiencies, such as cracking, spalling, rusting, distortion, misalignment of bearings and excessive deflection. Usually, the inspector can visually detect most of the relevant defects, provided there is suitable access to the bridge element. Visual inspections might not be adequate during the assessment of specific defect. For example, an inspector can identify visually that there is delamination when looking at a patch of concrete, but would not be able to gauge the extent and depth of it accurately by just visual inspection. Visual inspections, without utilization of any other inspection techniques, are also known to be subjective which might result in unreliable results [5] [6]. In contrast to the visual inspection, efforts during physical inspections are mainly towards quantifying the defects once they are identified visually. For example, to determine delamination areas in a pier or concrete deck, physical methods, namely, hammer sounding or chain drag may be used [7]. Measurements concerning expansion joint openings and bearing positions are also essential during the inspection and evaluation of a bridge. In some cases, advanced inspection methods like those based on strength, sonic, ultrasonic, magnetic, electrical, nuclear, thermography, radar and radiography, are used to detect sub-surface defects or for precise measurements of even surface defects.
2.2 Precast concrete tunnels Precast concrete tunnels are one example of civil infrastructure components that are becoming increasingly important when developing modern traffic concepts worldwide. However, it is commonly known that numerous tunnels, for example in the US, are more than 50 years old and are beginning to show signs of deterioration, in particular due to water infiltration [8]. In order to support owners in operating, maintaining, inspecting and evaluating tunnels, the US Federal Highway Administration (FHWA), for example, has provided a Tunnel Operations, Maintenance, Inspection and Evaluation (TOMIE) Manual [8] and a Highway and Rail Transit Tunnel 5
1 2 3 4 5 6 7 8 9 10 11 12 13 14 15 16 17 18 19 20 21 22 23 24 25 26 27 28 29 30 31 32 33 34 35 36 37 38 39 40 41 42 43 44 45 46 47 48 49 50 51 52 53 54 55 56 57 58 59 60 61 62 63 64 65
Inspection Manual [9] that promote uniform and consistent guidelines. In addition, Best Practices documents summarize the similarities and differences of tunnel inspection procedures among different US federal states and transportation agencies [10]. There are different types of tunnel inspections: initial, routine, damage, in-depth and special inspections [8]. Routine inspections usually follow an initial inspection at a regular interval of five years for new tunnels and two years for older tunnels, depending on condition and age. According to [9], inspections should always be accomplished by a team of inspectors, consisting of registered professional engineers with expertise in civil/structural, mechanical, and electrical engineers, as both structural elements and functional systems have to be assessed. However, the focus of this review is on civil and structural condition assessment of precast concrete tunnels. Accessing the various structural elements for up-close visual inspection requires specific equipment and tools. Commonly, dedicated inspection vehicles, such as Aerial bucket trucks and rail-mounted vehicles, equipped with, for example, cameras (used for documentation), chipping hammers (used to sound concrete), crack comparator gauges (used to measure crack widths), and inspection forms (used to document stations, dates, liner types, defect locations and condition codes), are driven through the tunnel and permit the inspectors to gain an up-close, hands-on view of most of the structural elements. More recently, integrated and vehicle-mounted scanning systems have entered the market. For example, the Pavemetrics Laser Tunnel Scanning System (LTSS) uses multiple high-speed laser scanners to acquire both 2D images and high-resolution 3D profiles of tunnel linings at a speed of 20 km/h [11]. Once digitized the tunnel data can be viewed and analyzed offline by operators using multi-resolution 3D viewing and analysis software that allows for high-precision measurement of virtually any tunnel feature. A different system is the Dibit tunnel scanner that is manually moved through the tunnel [12]. It provides an actual comprehensive visual and geometrical image of the recorded tunnel surface. The corresponding tunnel scanner software allows easy, quick and versatile data evaluations to visualize the inspected tunnel and manually assess its condition. According to [9], visual inspection must be made on all exposed surfaces of the structural (concrete) elements (e.g. precast segmental liners, placed concrete, slurry walls), and all noted defects have to be documented for location and measured to determine the scale of severity (Table 3). Based on the amount, type, size, and location of defects found on the structural element as well as the extent to which the element retains its original structural capacity, elements are individually
6
1 2 3 4 5 6 7 8 9 10 11 12 13 14 15 16 17 18 19 20 21 22 23 24 25 26 27 28 29 30 31 32 33 34 35 36 37 38 39 40 41 42 43 44 45 46 47 48 49 50 51 52 53 54 55 56 57 58 59 60 61 62 63 64 65
rated using a numerical rating system of 0 to 9, 0 being the worst condition (critical, structure is closed and beyond repair) and 9 being the best condition (new construction) [9].
2.3 Underground concrete pipes There is a great deal of buried infrastructure in modern cities, most of which appears to be out-ofsight and out-of-mind. Thus, whereas the number of cracks or depths of potholes in asphalt and concrete pavements may very well be the subject of water-cooler conversation, an interest in or an awareness of the state of underground sewage pipes is quite far removed from the perception of most citizens. However there are two key attributes that motivate attention to underground infrastructure: 1. Being buried, the infrastructure is challenging to inspect 2. Being buried, the infrastructure is very expensive to fix or replace. Indeed, the costs associated with sewage infrastructure modernization or replacement are staggering, with dollar figures quoted in the range of one or more trillion dollars [13]. There is, however, a strong incentive to undertake research and to develop sophisticated methods for underground concrete pipe inspection, due to the huge cost gap between trenchless approaches and the far more expensive digging up and replacement. The North American Society for Trenchless Technology and corresponding No-Dig conferences worldwide demonstrate the widespread interest in this strategy, dating back many years [14]. Direct human inspection, which is possible, at least in principle, for above-ground exposed infrastructure such as tunnels and road surfaces, is simply not possible for sewage pipes because of their relatively small size and buried state. Thus there has long been interest [15] in automated approaches, normally a small remotely-controlled vehicle with a camera. A sewage pipe would normally be classified [16] into anticipated structures, Undamaged pipe Pipe joints (connections between pipe segments) Pipe laterals (connections to other pipes) and some number of unanticipated problem classes: Cracks Mushroom cracks (networks of multiple, intersecting cracks, a precursor to collapse) Holes Damaged / eroded laterals or joints Root intrusion Pipe collapse In common with other forms of infrastructure, the primary challenge to sewage pipe inspection is the tedium of manual examination of many hours of camera data, exacerbated by the sheer physical extent of the infrastructure which, in the case of sewer pipes, exceeds 200,000 km in each of the UK, Japan, Germany, and the US [17]. There are, however, a few attributes unique to sewage pipe inspection:
7
1 2 3 4 5 6 7 8 9 10 11 12 13 14 15 16 17 18 19 20 21 22 23 24 25 26 27 28 29 30 31 32 33 34 35 36 37 38 39 40 41 42 43 44 45 46 47 48 49 50 51 52 53 54 55 56 57 58 59 60 61 62 63 64 65
Lighting is typically poor, since the only light available is that provided by the inspecting vehicle, and any forward-looking camera sees a well-lit pipe at the sides transitioning to completely dark ahead. Sewage pipes are subject to extensive staining and background patterning that can appear as very sudden changes in color or shade, giving the appearance of a crack. Since the focus of this paper is on the computer vision analysis techniques, this following overview of data acquisition is brief, and the reader is referred to substantial review papers [15] [17] [18] [19]. Closed circuit television (CCTV) [15] [17] [20] [18] [19] [21] [22] [23] [24] is the most widespread approach to data collection for sewage pipe inspection; nevertheless the sewer infrastructure which has been imaged amounts only to a miniscule fraction of perhaps a few percent [19]. Because the most common approach is to have a forward-looking camera looking down the pipe, the CCTV method suffers from drawbacks of geometric distortion, a significant drawback in automated analysis. Sewer scanner and evaluation technology (SSET) [15] [16] [25] [26] [19] represents a significant step above CCTV imaging. The pipe is scanned in a circular fashion, such that an image of a flattened pipe is produced with very few distortions and is uniformly illuminated. Laser profiling [17] [27] [28] [20] is similar to the SSET approach, in that a laser scans the pipe surface circularly, with an offset camera observing the laser spot and allowing the three-dimensional surface geometry of the pipe to be constructed via triangulation. There are a few further strategies, albeit less common, for sewer pipe inspection. A SONAR approach [15] [28] [19] has been proposed for water-filled pipes, where most visual approaches will fail, particularly if the water is not clear. Ultrasound methods [29] [30] [31] [17], widely used to assess cracks in above-ground pipes, have been proposed to allow an assessment of crack depth, which is difficult to infer from visual images. Infrared Thermography [15] [17] [19] relies on the fact that holes, cracks, or water intrusion may affect the thermal behavior of the pipe and therefore be revealed as a thermal signature. Finally, ground penetrating radar [15] [17] allows the buried pipe to be studied from the surface, without the clutter and challenges of driving robots in buried pipes, but at a very significant reduction in resolution and contrast. Because of rather substantial cost associated with data acquisition of sewer pipes, there is significant interest in maximizing the use of data. Prediction methods [32] [33] [34] [35] develop statistical, neural, or expert system deterioration models to predict pipe state, over time, on the basis of earlier observations.
2.4 Asphalt pavements As reported by the American Society of Civil Engineers (ASCE), pavement defects, also known as pavement distress, cost US motorists $67 billion a year for repairs [36]. Therefore, road surface should be evaluated and defects should be detected timely to ensure traffic safety. Condition assessment of asphalt pavements is essential to road maintenance. There exist several techniques to detect distress in asphalt pavements. These techniques differ in the pavement data which is being collected and in the way this data is processed. Sensor-based 8
1 2 3 4 5 6 7 8 9 10 11 12 13 14 15 16 17 18 19 20 21 22 23 24 25 26 27 28 29 30 31 32 33 34 35 36 37 38 39 40 41 42 43 44 45 46 47 48 49 50 51 52 53 54 55 56 57 58 59 60 61 62 63 64 65
techniques utilize devices to measure parameters of the pavement surface. Visual-based techniques make use of observations of the pavement surface to identify anomalies that indicate distress. Depending on the way of processing data, techniques are classified as purely manual, semi-automated or automated [37]. Manual processing is entirely performed by experts, while semi-automated and automated techniques require little or no human intervention. Visual-based techniques consist in manually inspecting the road surface or employing digital images and computing devices to assess the pavement condition. In case of manual inspection, trained personnel walks over the road shoulder and rates the pavement condition according to distress identification manuals. The disadvantage of this technique is that it is subjective despite the use of manuals and it depends on the experience of the personnel. Also, the personnel are exposed to traffic and weather, which makes the inspection procedure hazardous. Another issue related to the manual inspection of the road service is the time required to perform it. To speed up the assessment process, pavement images are analyzed instead of walking on the roads. Pavement images are obtained using downward-looking video cameras mounted on sophisticated vehicles. When the images and data are analyzed by human experts, the process of assessing the pavement condition is semi-automated. However, the rating of the pavement still depends on the experience of the analyzer and the subjectivity issue remains. Most distress detection techniques, regardless of whether they are manual, semi- automated or automated, depend on the pavement distress type. Pavement distress varies in its form and causes. Commonly, distress is characterized as alligator cracking, bleeding, block cracking, depression, longitudinal or transverse cracking, patches, potholes, rutting, raveling and more. The U.S. Army Corps of Engineers, for example, distinguishes between 19 types of distress [38]. Distress types and measurements are defined in visual pavement distress identification manuals. Some of these measurements and indices vary between different countries, and federal states. Table 4 presents examples of defect assessment measurements and condition indices defined in such manuals [39] [40] [41] [42] [43]. As can be seen, severity and extent are present in most of the manuals. The common procedure to obtain the extent value is to count the occurrences of the different severity levels for each type of distress for the whole segment and convert the amount of distress into distress percentage. Condition assessment indices are calculated based on the distress measurements. Several pavement condition assessment indices have been developed and the procedures of their calculation are described in visual distress identification manuals. For instance, the pavement condition index (PCI) is widely used. The pavement condition index is a statistical measure of the pavement condition developed by the US Army Corps of Engineers [38]. It is a numerical value that ranges from 0 to 100, where 0 indicates the worst possible condition and 100 represents the best possible condition. A verbal description of the pavement condition can be defined depending
9
1 2 3 4 5 6 7 8 9 10 11 12 13 14 15 16 17 18 19 20 21 22 23 24 25 26 27 28 29 30 31 32 33 34 35 36 37 38 39 40 41 42 43 44 45 46 47 48 49 50 51 52 53 54 55 56 57 58 59 60 61 62 63 64 65
on the PCI value. This description is referred to as pavement condition rating (PCR). PCR classifies the pavement condition as failed, serious, very poor, poor, fair, satisfactory or good.
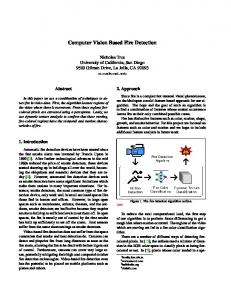
3. COMPUTER VISION METHODS FOR DEFECT DETECTION AND ASSESSMENT This section presents a comprehensive synthesis of the state of the art in computer vision based defect detection and assessment of civil infrastructure. In this respect, this part explains and tries to categorize several state-of-the-art computer vision methodologies, which are used to automate the process of defect and damage detection as well as assessment. Figure 1 illustrates the general computer vision pipeline starting from low-level processing up to high-level processing (Fig. 1, top). Correspondingly, the bottom part of Figure 1 categorizes specific methods for the detection, classification and assessment of defects on civil infrastructure into pre-processing methods, feature-based methods, model-based methods, pattern-based methods, and 3D reconstruction. These methods, however, cannot be considered fully separately. Rather they build on top of each other. For example, extracted features are learned to support the classification process in patternbased methods. Subsequently, it is shown, how these methodologies have been used, tested and evaluated to identify different defect and damage patterns in remote and close-up images of concrete bridges, precast concrete tunnels, underground concrete pipes and asphalt pavements.
3.1 Reinforced concrete bridges Much of the research in defect detection and assessment using computer vision methods for RC bridges have largely focused on cracks, and to some extent on spalling/delamination and rusting. Many of these research studies targeted and contributed successfully to the automation of detection and measurement of defects. More studies need to be done to improve the methods used for automatic assessment as they are currently based on several assumptions. In addition to cracks, there are also other defects that are essential to be detected and assessed in relation to a RC bridge. Being able to detect, assess and document all defects as independent entities is paramount to provide a comprehensive approach for bridge inspection. Currently, some of the other categories of defects are being inherently detected or assessed as part of other major dominating defects present at the using computer vision methods. For example, some methods detect abrasion as part of the crack [44]. In other cases, such as distortion and misalignment of bearings etc., no automated method exists for detecting and assessing them. This clearly indicates that more research needs to be done in the direction of automating the detection and assessment of various defects. To be able to perform automatic assessment and condition rating assignment, as a first step, it is necessary to identify the relevant defect parameters to accurately and comprehensively represent the defect information.
10
1 2 3 4 5 6 7 8 9 10 11 12 13 14 15 16 17 18 19 20 21 22 23 24 25 26 27 28 29 30 31 32 33 34 35 36 37 38 39 40 41 42 43 44 45 46 47 48 49 50 51 52 53 54 55 56 57 58 59 60 61 62 63 64 65
Below we will present the synthesis of the research done so far in the computer vision domain for various types of defects. 3.1.1 Cracking Previously, Jahanshahi et al. [45] reviewed automatic defect detection approaches. Very recently, Rose et al. [46] reviewed existing crack detection and assessment algorithms for concrete bridges and classified them broadly as edge detection, segmentation and percolation, machine learning methods, morphology operations, ground and aerial robot photography, template matching, and other techniques. Building on this categorization, we reviewed and discussed some of the existing algorithms below. Abdel-Qader et al. [47] compared various edge detection algorithms and found the Haar Wavelet method to be the most reliable among them, for the purpose of crack detection. However, the performance of edge detection algorithms on noisy image data is questionable, and same is the case with morphological operation based methods [48]. Yamaguchi et al. [49] used scalable local percolation-based image processing techniques and they proved to be efficient and accurate even for large surface images [50]. Abdel-Qader et al. [51] used a Principle Component Analysis based algorithm to detect cracks on a bridge surface. In this case, the accuracy of results varied with camera pose and distance from where images are taken. Prasanna et al. [52] developed a histogram-based classification algorithm and used it along with Support Vector Machines to detect cracks on a concrete deck surface. The results of this algorithm on real bridge data highlighted the need for improving the accuracy. Nevertheless, training data from various locations on the bridge could be used to build the classifier and testing could be done on data from a different location of similar structural composition. Similarly, Lattanzi and Miller [53] developed an automatic clustering method for segmentation based on Canny and K-Means to achieve greater accuracy of crack detection under various environmental conditions at a greater speed. Lattanzi and Miller's work is significant, especially if training data comprises images from different locations because it is important to offset the environment variability associated with variable lighting and shading conditions at different locations on the bridge, which is often the case with real world bridges. Some researchers also combined image-based 3D scene constructions with other techniques, in order to obtain depth perception that a 2D image lacks, to support automatic crack detection [54] [55]. While the above algorithms demonstrated capabilities to detect cracks, it is also important in a bridge inspection to understand the crack properties such as location, width, length and orientation, because condition ratings for bridge elements are assigned based on such properties. As outputs of the process of extracting properties from images are quantities, it is imperative that images are mapped to the global coordinate system. This requirement stems from the likelihood that images are collected on field with varying configurations i.e. resolutions, positions, orientations etc., over different inspections, which is primarily due to difficulty in replicating the same image capture configuration as well as a result of rapid advances in camera technologies over relatively shorter time periods. Towards normalizing different images to true world scale, 11
1 2 3 4 5 6 7 8 9 10 11 12 13 14 15 16 17 18 19 20 21 22 23 24 25 26 27 28 29 30 31 32 33 34 35 36 37 38 39 40 41 42 43 44 45 46 47 48 49 50 51 52 53 54 55 56 57 58 59 60 61 62 63 64 65
different researchers used techniques such as 3D pose estimation, multiple image stitching or by making measurements relative to the host structural element. In relation to that, some data acquisition systems used by researchers also had 3D pose control feature. These systems likely comprised surface-based (ground-based, water-based, bridge surface crawler) or aerial robots, which can either, have pre-configured settings or can log accurate image capture configuration dynamically. Targeting to achieve the goal of going beyond mere crack detection, Yu et al. [56] developed a graph-based search method to extract crack properties for further assessment and used a groundbased robot for collecting images; however, this method needed manual input of start and end points of crack [50]. Later, Oh et al. [57] demonstrated a technique implementing automatic twostep: crack detection and crack tracing algorithm to be able to detect as well as identify crack properties, such as width and length, and tested the developed algorithm on a real bridge. They collected images with a ground-based robotic system that had controlled pan and tilt mechanisms, and used median filter for smoothening in the pre-processing stage, then isolated the candidate crack points and applied morphological operations such as dilation and thinning to maintain crack segment connectivity. As part of their study, they compared their results with Fujita, Sobel and Canny’s method. The performance of the algorithm proposed by Oh et al. [57] matched the other three methods in terms of eliminating shaded regions and detecting major cracks, while outperforming them in the case of thinner cracks. Other researchers targeted developing crack maps. Jahanshahi et al. [58] proposed a crack detection system to extract a complete crack map using 3D scene reconstruction, morphological operations and machine learning classifiers, and followed it up with a robust photogrammetrybased approach to compensate for camera perspective errors [59]. In another recent case, Zhu et al. [60] proposed a novel method involving thinning of the crack maps and subsequent measurement of each crack skeleton point to the crack boundary to automatically extract necessary crack parameters [50]. More recently, Lim et al. [61] proposed a Laplacian of Gaussian (LoG) based algorithm to perform crack detection and mapping on an RC bridge deck, and uses a mobile robotic system that can traverse a deck surface to capture images. The robot stores the spatial locations of image capture and uses robot coordinate system to transform from image coordinate system to global coordinate system. The results presented in most of these cases were based on application of their methods on bridge deck surface, or in some cases image data of the beams and columns were considered. Generally speaking, most of the images used in these studies were images from simple flat and curved surfaces. However, the joints, seals, bearings and other connections present more complex geometry, often comprise of many sub-components and generally have varying material composition. Thus, these conditions render it hard to distinguish cracks from true edges. Also, as bridge inspectors commonly look out for connection related defects, algorithms should be tested on images from these components.
12
1 2 3 4 5 6 7 8 9 10 11 12 13 14 15 16 17 18 19 20 21 22 23 24 25 26 27 28 29 30 31 32 33 34 35 36 37 38 39 40 41 42 43 44 45 46 47 48 49 50 51 52 53 54 55 56 57 58 59 60 61 62 63 64 65
3.1.2 Delamination/ Spalling Only recently, there have been developments in the detection and assessment of spalling on concrete surface and these works seem to have drawn inspiration from rusting detection and assessment [50]. German et al. [62] considered a combination of segmentation, template matching and morphological pre-processing, both for spall detection and assessment on concrete columns. They identified length of spalled region along longitudinal direction and distance between exposed reinforcement bars in the transverse direction and developed an approach for assessing the cumulative severity of the spalling based on different enumeration levels – (i) spalling of concrete cover without exposing reinforcement, (ii) spalling exposing longitudinal reinforcement and that of core concrete. The results obtained for the test images indicated spall detection with a precision of 81.1% and a recall of 80.2% for a set of 70 images. However, they indicated that more work is needed to achieve more detailed categorization of spall property result, with particular focus on spalling that exposes transverse reinforcement. Adhikhari et al. [63] presented a novel approach based on orthogonal transformation, using shape preserving algorithms such as affine and projective transformation, to overcome perspective and parallax errors of a camera during data collection that can result in inaccurate defect quantification. They could determine if spalling had occurred, and if spalling was present, they could retrieve spall properties automatically. Their research also used Bridge Condition Index (BCI) after quantifying the defects to map them to condition ratings. While they could achieve reasonably accurate results (85% accuracy) for automatic procedures, their algorithm could not completely address automatic identification and assessment in situations where multiple defects (e.g. spall and crack) interact at the same spatial location. Though work on spalling detection and assessment started only recently, the progress so far is very promising. The algorithms have been tested with images from decks and columns. Like in the case of cracks, even spalling needs to be checked for at concrete joints. Therefore, including images from those locations will be valuable for better detection and assessment performance of the algorithms. 3.1.3 Other damage scenarios Zaurin et al. [3] used video imagery and bridge responses collected by strain gauges and fused them together to detect loss of connectivity between different composite sections, and change in boundary conditions. In the process, unit influence line of the bridge is extracted and statistical outlier detection is done to differentiate damage state from the baseline state. This method was tested using a four span experimental bridge belonging to University of Central Florida. Adhikari et al. [64] presented an change detection approach based on fourier transformation of the images, which could useful for detecting subtle defects such as periodic and sudden settlement of substructure. The review of the paper also suggests no proper basis for thresholding, and the results vary depending on the chosen threshold limit chosen. However, this method is a significant improvement over traditional change detection approach using the image difference, and can be used to quickly do a temporal comparison of different images. Uhl et al. [65] 13
1 2 3 4 5 6 7 8 9 10 11 12 13 14 15 16 17 18 19 20 21 22 23 24 25 26 27 28 29 30 31 32 33 34 35 36 37 38 39 40 41 42 43 44 45 46 47 48 49 50 51 52 53 54 55 56 57 58 59 60 61 62 63 64 65
developed a method to detect deflection in structural members by applying homography mapping. Specifically, they implemented an automatic shape filter and a corner detector to calculate the deflection using homography mapping between the two views. They implemented this algorithm on an experimental set up in a lab, and also on a real bridge, and verified their results with the deflection calculated using a laser scanner. The results seem to be very accurate with the average difference between both the measurements being less than 0.5%. Though the deflection is being calculated accurately, it did not address the problem of damage localization and assessment. Kohut et al. [66] extended Uhl et al.’s work [65] to include damage localization and assessment using a wavelet transform based analysis method to do irregularity detection. Various algorithms, related to detection and assessment of cracking, spalling and some damage scenarios in RC bridges, have been discussed above, and our focus was on the progress of the computer vision research in terms of automation in detection and assessment of these defects.
3.2 Precast concrete tunnels In contrast to concrete bridge inspection, the image and video data acquired inside a tunnel is much different in terms of artificial lighting and camera distance. From that perspective, it is interesting to review the current state-of-the-art computer vision algorithms for defect detection in tunnel image data. According to Chaiyasarno [67], automated tunnel inspection systems that cover both defect detection and condition assessment can be grouped into the following themes: detection, visualization and interpretation. 3.2.1 Defect detection In analogy to concrete bridges, the most sought after defects are cracks as they are the primary indicator of deterioration patterns, which are due to other severe causes that need to be further analyzed [68]. Yu et al. [56] also highlight that cracks are of particular concern as they most significantly affect the state of the concrete within a tunneling environment. Computer vision methods for crack detection generally involve a pre-processing step and a crack identification step. First, in the pre-processing step image processing techniques are applied to extract potential crack features, such as edges (threshold-based approaches). Second, the identification step usually applies crack modelling (model-based approaches) and/or pattern recognition techniques (pattern-based approaches) in order to classify if the extracted features belong to crack regions. Next to methods described in the previous section, mentionable contributions that are applicable to crack detection during tunnel inspection are the described below. Threshold-based approaches Miyamoto et al. [69] calculate the difference in intensity between each pixel and the average intensity of each row in an image. A pixel that differs considerably from the average is said to be a crack pixel. Fujita et al. [70] use a line filter based on the Hessian matrix to emphasize line 14
1 2 3 4 5 6 7 8 9 10 11 12 13 14 15 16 17 18 19 20 21 22 23 24 25 26 27 28 29 30 31 32 33 34 35 36 37 38 39 40 41 42 43 44 45 46 47 48 49 50 51 52 53 54 55 56 57 58 59 60 61 62 63 64 65
structures associated with cracks before they apply thresholding to separate cracks from background. The major drawback of threshold-based approaches is the question on how to choose a suitable threshold for extracting crack features. The described algorithms select a threshold based on prior knowledge. However, such methods can hardly be generalized and may be inapplicable to the imaging conditions found in real tunnel images. Moreover, they are prone to inaccuracy caused by shadows as the intensities of shadow pixels tend to have a similar brightness compared to crack pixels. Model-based approaches Ukai [71] developed a crack detection system based on the deformation of tunnel walls. Under this method, the model of a crack is characterized by eight quantities, such as area and Feret’s occupancy rate. Subsequently, a filter is used to remove noise. Yamaguchi et al. [49] modelled cracks based on the concept of percolation, which is a physical model describing the phenomenon of liquid permeation. The algorithm starts by initializing a seed region and then the neighboring regions are labelled as crack regions based on the percolation process. Paar et al. [72] present a crack detection algorithm based on the line tracing algorithm that assumes a crack is a series of short straight lines connected together. Again, the algorithm starts from a seed point followed by searches for a line within the neighboring regions. Yu et al. [56] proposed a crack detection method in conjunction with a mobile robot system for automated inspection of concrete cracks in tunnels. Their method calculates the length, thickness and orientation of concrete cracks through a graph search; however, it requires the crack’s start and end point to be manually provided. Moreover, the robot is required to maintain a constant distance from the tunnel wall in order to achieve accurate measurements of the damage properties. This system claims to have an overall detection accuracy rate of 75-85% and a measurement error of recognized cracks of less than 10%. According to [67], model-based methods for crack detection strongly rely on user input to initialize the seed pixels. Consequently, hairline cracks may not be detection because users may be unable to identify the seed pixels. Due to reliance on the user input, these methods may not be scalable. Pattern-based approaches Liu et al. [73] apply a Support Vector Machine (SVM) classifier to determine if crack features appear in an image patch. Potential crack features are pre-defined based on intensity. Abdelqader et al. [51] use a Principal Component Principles (PCA) algorithm that reduces the dimensions of feature vectors based on eigenvalues, and extracts cracks from concrete images. The images are first pre-processed by line filters in three directions: vertical, horizontal and oblique; then further processed by the PCA algorithm and classified based on the nearest neighbor algorithm.
15
1 2 3 4 5 6 7 8 9 10 11 12 13 14 15 16 17 18 19 20 21 22 23 24 25 26 27 28 29 30 31 32 33 34 35 36 37 38 39 40 41 42 43 44 45 46 47 48 49 50 51 52 53 54 55 56 57 58 59 60 61 62 63 64 65
Methods based on pattern recognition considerably rely on training data in order to set up robust classifiers. Training and validation data are usually performed by manual labelling (supervised learning), which is a labor-intensive and error-prone procedure. 3.2.2 Visualization The main goal of visualization is to visually organize large image and video data sets to enhance inspection. Image stitching or image mosaicing is a common method to combine and visualize a collection of images. In the domain of tunnel inspection, Chaiyasarn et al. [74] present a system that constructs a mosaic image of the tunnel surface with little distortion. Their system obtains a sparse 3D model of the tunnel by multi-view reconstruction [75]. Then, the Support Vector Machine (SVM) classifier is applied in order to separate image features lying on the cylindrical surface from those of the non-surface. The reconstructed 3D points are reprojected into images for accurate cylindrical surface estimation. Jahanshahi et al. [76] create stitched images of structural systems from a specialized camera that can tilt and pan. The method detects missing parts, such as bolts, when comparing images taken at different times for the purpose of structural health monitoring (SHM). The method applies a machine-vision algorithm to perform image registration to rectify images so that they are in the same coordinate frame. In general, image stitching provides a feasible way of increasing the field of view that cannot be achieved by a single image. Consequently, a wide-angle or stitched image may improve defect detection results, in particular in case of hairline cracks, since the stitched image provides a higher resolution of defects, e.g. cracks. 3.2.3 Change monitoring Apart from detecting cracks, classifying crack patterns and associated sizes, it is essential to observe if cracks in tunnel liners have changed over time and how quickly they do so. This kind of information helps determine the deterioration rate of the structural tunnel components [67]. Lim et al. [77] propose a system for change monitoring of cracks from multi-temporal images. Their system is based on a 2D projective transformation that can accurately determine the crack size, which is then monitored in consecutive images as the crack propagates. Although this system that can cope with images taken from different viewpoints, it requires explicit user input for the control points, which makes the system unscalable for a large number of images. Chen and Hutchinson [78] propose a framework for concrete surface crack monitoring and quantification. Their method is based on optical flow in order to track the movement of cracks. However, current solutions related to monitoring cracks or anomalies rely greatly on some degree of user input [67].
3.3 Underground concrete pipes Deplorably, on the basis of a search of sewage pipe inspection methods currently offered by North American contractors, most buried pipe inspection continues to be manual and CCTV based, implying a slow inspection process subject to operator fatigue and boredom. Although this 16
1 2 3 4 5 6 7 8 9 10 11 12 13 14 15 16 17 18 19 20 21 22 23 24 25 26 27 28 29 30 31 32 33 34 35 36 37 38 39 40 41 42 43 44 45 46 47 48 49 50 51 52 53 54 55 56 57 58 59 60 61 62 63 64 65
limitation is frustrating, it strongly motivates continued research work on machine intelligence and computer vision in this application, and is the driving motivation for this section. There have been significant with computer vision contributions to pipe inspection, in whole integrated systems such as PIRAT [28] [18], KARO [18], and AIMP [18] [79], and the mapping the underworld (MTU) project [19]. The computer vision analysis of underground concrete sewer pipes has much in common with other forms of infrastructure. In particular, all of the parallel sections in this paper discuss aspects of crack detection, hole detection, and the classification of cracks into different forms or degrees of severity: multiple cracks, networked cracks etc. The forms of concrete deterioration in different parts of infrastructure do, after all, share a great deal in common. As discussed in Section 2.3 and in review articles [15] [17] [18] [19], an unusually wide variety of possible imaging modalities has been developed for buried pipe inspection. In terms of the role of computer vision, we will focus our discussion on the most widespread methods, which have seen the most attention in the literature, namely the CCTV, SSET, and laser profiling methods. Other approaches, such as SONAR, ultrasonics, and ground penetrating radar do produce image-like data, but of a too specialized nature to consider here. The analysis of buried sewage pipes possesses certain unique aspects which influence the associated computer vision strategy: Lighting: The pipes are buried, dark and, depending on the modality of imaging, there may be constraints on the lighting possible, particularly in the case of CCTV imaging. Patterned background and contrast: Sewage pipes suffer from significant degrees of deposits and staining, which may be dark, affecting image contrast, or may be highly and irregularly patterned, looking very much like any of a number of sewage failure classes – holes, single cracks, networks of cracks, root intrusion etc. Limited quality and quantity of data: The slow, expensive approach to data collection strongly limits the total amount of data available for machine learning. Furthermore the lack of standardization – varied methodologies of imaging, machine standards, concrete pipe standards, concrete pipe contents and staining – make it challenging to learn broadly applicable approaches. The methods of image analysis in the literature mostly involve feature extraction or modeling, both of which are widely used in computer vision and machine learning. Feature extraction [80] is the crucial bridge between a raw image and an information-rich feature vector that can be used for classification. The related problems of image modeling fall into three categories in the context of pipe inspection, from the most specific to the most abstract: of parametric / explicit models, morphology / shape-based models, and implicit / black-box models. 3.3.1 Feature Extraction Methods of pattern recognition and classification, such as a support vector machine or nearest neighbor classifier [80], expect to be given a vector of values describing the object to be classified. An image, containing thousands to millions of pixels, represents data in far too dilute 17
1 2 3 4 5 6 7 8 9 10 11 12 13 14 15 16 17 18 19 20 21 22 23 24 25 26 27 28 29 30 31 32 33 34 35 36 37 38 39 40 41 42 43 44 45 46 47 48 49 50 51 52 53 54 55 56 57 58 59 60 61 62 63 64 65
a form to be classified, since computation time and training data requirements are exponential in the number of dimensions. Feature extraction is essentially dimensionality reduction; in the context of analyzing images, computer vision has developed a vast range of approaches for extracting salient features. Because buried concrete pipes are patterned and poorly lit, robust feature extraction is an essential step and appears throughout the pipe inspection literature. Methods include edge detection [25] [22] or the Hough transform [22] for edge/line detection, image segmentation [26] and background subtraction [18] for foreground object extraction, methods of image registration [18] and optical flow [24] for the tracking and association of objects in successive video frames, particularly relevant in CCTV imaging. More advanced methods include texture-based methods, including co-occurrence [21] and histograms of oriented gradients [23], and multi-resolution or wavelet-based approaches [29] [17]. Not all of these methods can be described here, and the reader is referred to a comprehensive review [81]. 3.3.2 Parametric models In principle, any object which we can recognize in an image, such as a crack, hole, or joint, can be modeled parametrically, with parameters explicitly describing properties such as width, length, radius, color etc. The strength of parametric models lies in their explicit nature, being relatively easy to understand and diagnose, however their limitation lies in their limited generalizability: in practice, any special case for which a given model is unprepared leads to a further iteration with a newly revised model addressing that case, and after repeated such iterations leading to ugly, clunky models containing a variety of exceptions. Given an explicit model, the most fundamental, albeit slow, approach to detecting such objects in an image is using a generalized Hough transform [82] [83]. Essentially the Hough transform is a matched filter, placing the model in all possible parametric permutations at all points in the image and asking regarding degree of fit. If the number of parameters is sufficiently few, say two parameters describing the position plus one or two parameters describing size and shape, then the Hough approach may be possible, but given five or more parameters the Hough search space becomes far too large to search densely, and optimization approaches are needed. Significant challenges for parametric approaches arise, by definition, for those objects which cannot be well modeled. So whereas a joint (line) or lateral (circle) is relatively simple, a crack is more challenging but may be modeled as a set of connected line segments, but a model to describe the wide range of appearances of root intrusions is very difficult. Most parametric computer vision models focus on crack detection, such as modeling a crack as being darker or having a higher variance than its immediate surroundings [25] or as a set of segments [22]. 3.3.3 Morphology Image morphology represents image shape on the basis of mathematical operations such as shape erosion (shrinking) and dilation (growing). The morphological approaches are more limited than parametric ones since, in principle, a parametric model can encode any imaginable behavior, 18
1 2 3 4 5 6 7 8 9 10 11 12 13 14 15 16 17 18 19 20 21 22 23 24 25 26 27 28 29 30 31 32 33 34 35 36 37 38 39 40 41 42 43 44 45 46 47 48 49 50 51 52 53 54 55 56 57 58 59 60 61 62 63 64 65
however the strength of morphological approaches is their elegance and operating in a manner similar to humans. Any morphological operation is described or controlled through a structuring element, normally a relatively simple shape, such as a line, a rectangle, or a disc, which controls the extent to which a given pixel in the image affects its neighbors in dilating or eroding. Many textbooks and tutorial papers have been written [84] [85] and the interested reader is referred to them for greater background. Much of pipe inspection is on the basis of binary (light/dark) primitive shapes, making image morphology a natural tool. The most basic shapes are elongated (cracks, joints) and round (holes, laterals), and so analysis can proceed on the basis of one or more round and one or more rectangular structuring elements. Recent uses of morphological approaches in buried pipes can be found in Sinha et al. [16], Su et al. [86], and Halfawy et al. [22]. 3.3.4 Neural models There has been a huge resurgence in computer vision interest in neural-like models, particularly in the area of deep belief networks [87]. The key advantage of a neural approach is that all stages of the problem – contrast enhancement, feature extraction, texture / shape analysis, classification – are machine learned all at once, in an integrated fashion. If the machine learning optimization converges well, then the integrated approach can offer robust classification. On the other hand the sewage pipe problem, with huge numbers of images and a wide range of background patterning and texture, is a very large nonlinear optimization problem for which convergence may be poor. Neural-like methods are essentially black-box in nature, and therefore the actual effect or role of individual parameters is exceptionally hard to understand, in contrast to parametric models where the researcher can understand the operations of different parts of the algorithm and where, although parameters would ideally be machine learned, in principle the parameters could be tuned by hand on the basis of an understanding of their effect. Nevertheless, the limitations of the preceding paragraph notwithstanding, neural approaches have seen rather significant application in buried pipe inspection. In most cases, the neural network is preceded by computer vision approaches for feature extraction, followed by neural learning [29] [27] [20] [21] or neuro-fuzzy approaches [26] [88]. 3.3.5 3D Reconstruction A final contribution from computer vision relates to the three dimensional reconstruction of a buried pipe, as a direct geometric detection of deep cracks and holes, rather than indirectly through visual appearance. The computer vision literature has developed a vast range of methods for 3D reconstruction, most notably shape from shading and stereo vision, both relatively complex problems. In contrast, the instruments for pipe inspection employ a laser and generate 3D shape one dot at a time, a far more constrained problem and relatively simple compared to 3D scene reconstruction from images.
19
1 2 3 4 5 6 7 8 9 10 11 12 13 14 15 16 17 18 19 20 21 22 23 24 25 26 27 28 29 30 31 32 33 34 35 36 37 38 39 40 41 42 43 44 45 46 47 48 49 50 51 52 53 54 55 56 57 58 59 60 61 62 63 64 65
The use of laser reconstruction is widespread in computer vision, to generate 3D models of heads, limbs for prosthetics, or objects for 3D printing. For pipe inspection, methods for 3D reconstruction based on laser illumination are developed in Duran et al. [27] [20] and Kawasue et al. [89].
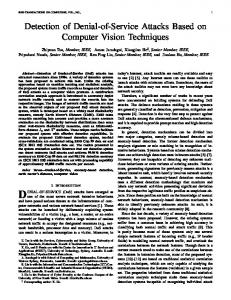
3.4 Asphalt pavements 3.4.1 Pre-processing To automatically detect distress on pavement images, it is required to perform some preprocessing of the images. A common problem is that images are taken under different weather conditions or daytime and may contain shadows of trees. As a result non-uniform lighting is present in the images. Many of the methods for pavement distress detection are based on the assumption that distress pixels are darker than the background. Wang [90] and Tsai et al. [91] have concluded that such methods perform differently well according to varying lighting conditions and shadows. Figure 2 illustrates the so-called checker shadow illusion [92]. Square A looks darker than square B, but their pixel intensities are equal. This means, humans might be able to easily identify an asphalt crack in an image because it appears darker compared to the local background. Computers, however, may fail as they sometimes solely rely on global intensity values. Several solutions to the non-uniform lighting problem have been proposed. Varadharajan et al. [93] select only images that were taken during daytime and when the weather was overcast or mostly cloudy, so that the lighting conditions are good. The disadvantage of this approach is that the selection process is also time-consuming and all captured images must be saved before selection and processing, which results in large amounts of data that is stored. Cheng [94] proposed a method to convert all images to a standardized background. For that purpose, a frame is split into rectangular windows. The average light intensity of the pixels in the windows is calculated for each window. Notably low average values are then replaced by the average value of the neighbor windows. Finally, multipliers are generated based on the average values. The multipliers are interpolated for each pixel so that all intensities vary around a base intensity. Zou [95] proposed a geodesic shadow-removal algorithm to remove the pavement shadows while preserving the cracks in images. Another issue related to distress detection in pavement images is the presence of lane-marking on the images. Nguyen et al. [96] detect lane-marking regions and do not consider these regions for the distress detection. First, a binary image is obtained by applying a threshold. Second, the probabilistic Hough Transform is used to detect lines on this binary image. Lane-markings are detected based on the orientations and dimensions of these lines. A range of techniques are applied to eliminate noise or for image enhancement. Lokeshwor [97] and Radopoulou [98] use median filtering and morphological operations (erosion, dilation, 20
1 2 3 4 5 6 7 8 9 10 11 12 13 14 15 16 17 18 19 20 21 22 23 24 25 26 27 28 29 30 31 32 33 34 35 36 37 38 39 40 41 42 43 44 45 46 47 48 49 50 51 52 53 54 55 56 57 58 59 60 61 62 63 64 65
opening, closing). Li [99] applies Gaussian smoothing for further denoising. Varadharajan [93] calculates the blur magnitude in the images and considers for assessment only images for which the blur-score is below a certain threshold. In some cases it might also be beneficial to compress the images to reduce the size and computation time, as done by Salman [100]. 3.4.2. Defect detection Several methods have been proposed, which are capable of detecting different types of distress in pavement images. Zhou et al. [101] use wavelet transform to decompose an image into approximation and detail coefficients. The detail coefficients represent distress in the pavement images. Zhou also proposed three statistical criteria and a norm of pavement distress quantification, which can be used as an index for pavement distress evaluation. Lokeshwor et al. [102] developed an algorithm which applies segmentation of distress pixels from the background pixels using an adaptive thresholding technique. User defined decision logic based on the area covered by the distress pixels categorizes video frames as frames with distress or frames without distress. Most detection methods are developed for a specific type of distress. Some of the methods are presented below. Cracks As cracks are the most common distress type, a plenty of crack detection algorithms have been developed and presented. In particular, methods for real time crack analysis [103] [104], crack classification [105] crack depth estimation from vision [106], and automating crack sealing have been presented [107] [108]. Most of the algorithms for crack detection are based on the assumption that crack pixels are darker than the surroundings. Based on statistical measures of the pixel intensities, thresholding methods that classify pixels as crack or non-crack pixels are applied. Tsai et al. [91] have made a critical assessment of distress segmentation methods, in particular statistical thresholding, Canny edge detection, multiscale wavelets, crack seed verification, iterative clipping methods, and dynamic optimization based methods. Koutsopoulos et al. [109] developed an algorithm for crack image segmentation based on a model that describes the statistical properties of pavement images. Huang et al. [104] also proposed a classification method. An image is divided into cells. Depending on the contrast of each cell to its neighbor, the cells are classified as crack or noncrack cells. However, a limitation of the method is that it is hard to find a universal contrast threshold [91]. Salman et al. [100] proposed an algorithm which uses a Gabor filter. The preprocessed pavement image is convolved with the filter and the real component of the result image is thresholded to generate the binary image. Binary images resulting from differently oriented filters are combined and an output image is produced. The output image contains detected crack segments. Moussa and Hussain [110] presented an approach for automatic crack detection, classification and parameter estimation based on machine learning. They apply Graph Cut segmentation to segment an image into crack and background pixels. A binary vector is created after 21
1 2 3 4 5 6 7 8 9 10 11 12 13 14 15 16 17 18 19 20 21 22 23 24 25 26 27 28 29 30 31 32 33 34 35 36 37 38 39 40 41 42 43 44 45 46 47 48 49 50 51 52 53 54 55 56 57 58 59 60 61 62 63 64 65
segmentation. Seven features are extracted from the vector for classification purposes. Then, a Support Vector Machine is used to classify the crack type in transverse cracking, longitudinal cracking, block cracking or alligator cracking. Moussa and Hussain also presented an approach to compute the crack extent and severity based on the length and the width of the crack in the image [110]. Varadharajan et al. [93] also use machine learning. They assume input images which can contain background, such as cars, traffic signs and buildings. First, the ground plane is segmented out from the rest of the image. After that, feature descriptors are computed based on the color and texture of the preprocessed pixels. A total of nine features and data obtained from human annotators are used to train a Support Vector Machine which classifies the images. Li et al. [99] partition the image into crack regions and regions without cracks using the difference value between the maximum and the minimum grayscales of an image region. Then, the foreground is separated from the background by segmenting with Otsu’s method and the images are classified using binary trees and back propagation neural networks. Zou et al. [95] analyze the intensity difference in regions of the image to determine whether the pixels belong to cracks or not. After that, using tensor voting, a crack map is produced. In the crack map the probability of the pixels that are likely to be located along long crack curves is enhanced. The cracks in the image may sometimes be disconnected, so Zou et al. connect the crack parts with the help of an edge pruning algorithm. Potholes Usually, potholes also differ significantly from the background surface. Current computer vision research efforts in automating the detection of potholes can be divided into 3D reconstructionbased, 2D vision-based methods. Detection methods that are based on a 3D reconstruction of the pavement surface rely on 3D point clouds provided by stereo-vision algorithms using a pair of video cameras. Also there are hybrid systems available that use digital cameras to capture consecutive images of lines projected by infrared lasers [111]. A stereo-vision based surface model for comprehensive pavement conditioning has been proposed by Wang [112] and Hou et al. [113]. With the availability of a 3D point cloud, Chang et al. [114] have presented a clustering approach that can quantitate the severity and coverage of potholes and Jiaqiu et al. [115] have created a method for identifying, locating, classifying and measuring sag deformations like potholes and depression. The drawbacks of stereo-vision-based approaches are that they require a complete 3D reconstruction of the pavement surface and that the procedure of matching points between the two views is quite challenging due to the very irregular texture and color of the pavement surface. Karuppuswamy et al. [116] integrated a vision and motion system to detect simulated potholes. Their approach detects potholes in the center of a lane. However, it relies on computer generated (simulated) potholes that are larger than 2 feet in diameter and white in color. The latter are simplified assumptions that do not reflect realistic pavement conditions. Jahanshahi et al. [117] used a depth sensor to detect and quantify defects in pavements. Based on the depth values of the 22
1 2 3 4 5 6 7 8 9 10 11 12 13 14 15 16 17 18 19 20 21 22 23 24 25 26 27 28 29 30 31 32 33 34 35 36 37 38 39 40 41 42 43 44 45 46 47 48 49 50 51 52 53 54 55 56 57 58 59 60 61 62 63 64 65
pixels, pixels are classified as deep or flat using thresholding. Then, the maximum depth of the defective regions is computed. However, the limitation of the proposed approach is that the data acquisition system, which is the Kinect sensor, is designed for indoor use. As a result, all the captured depth values are zero when the Kinect is exposed to direct sunlight. Koch et al. [118] also presented a computer vision based approach for pothole detection in asphalt images. Based on surrounding shadows, elliptic shape and grain surface texture, the method identifies potholes in images. Image segmentation, shape approximation, and texture comparison are performed in this order. The image is divided into defect and non-defect pavement regions using histogram shape based thresholding and the triangle algorithm proposed by Zack et al. [119]. The shape of the pothole is approximated by applying morphological thinning and elliptic regression. Finally, the surface texture of the pothole candidate region is compared to the nondefect pavement region using spot filter responses. The region is determined as a pothole if the region inside the pothole candidate is coarser and grainer than the one outside. Koch et al. extended the method with video processing [120]. Using the described pothole detection method, potholes in a sequence of pavement images are counted. Patches Cafiso et al. [121] observed that pixels which belong to patches have different gray levels from the pixels which belong to the background. They use a clustering method to analyze the image with respect to patches. Radopoulou et al. [98] detect patches in pavement images by applying morphological operations. Patch regions are segmented based on the assumption that patch pixels have greater intensities than pixels belonging to the background. Then, texture information is utilized and four different filters are applied. Subsequently, feature vectors of both intact and patch regions are constructed and compared after the convolution of the image with the filters. 4. ACHIEVEMENTS AND CHALLENGES This section summarizes the current achievement and open challenges of computer vision for infrastructure condition assessment. A corresponding overview regarding the level of automation in defect detection and condition assessment is presented in table 5. 4.1 Achievements When looking at defect detection and condition assessment of reinforced concrete bridges – classified as both vertical and horizontal civil infrastructure – it can be concluded that the current state-of-the-art computer vision based methods contribute successfully to the automation of detection and measurements of defects. The detection, localization and properties retrieval of both concrete cracks and concrete spalling is to a very large degree automated. Spalling defects can even be quantified and to some extend be mapped to condition ratings. Other important achievements include the ability of computer vision based methods to successfully support the detection of connectivity losses between composite sections, changes in boundary conditions, 23
1 2 3 4 5 6 7 8 9 10 11 12 13 14 15 16 17 18 19 20 21 22 23 24 25 26 27 28 29 30 31 32 33 34 35 36 37 38 39 40 41 42 43 44 45 46 47 48 49 50 51 52 53 54 55 56 57 58 59 60 61 62 63 64 65
changes in substructure settlements and deflection of structural members. The accuracy of vision based deflection detection can even compete with methods employing high accurate laser scanners. With regard to very long horizontal civil infrastructure, such as precast concrete tunnels, underground concrete pipes and asphalt road networks, it is found that respective data collection technologies are fully automated. Moreover, available computer vision based algorithms successfully support the automation of detecting and localizing defects, such as cracks and joint spalling in concrete tunnels; cracks, holes and joint damage in concrete pipes; and cracks, potholes and patches in asphalt pavements. In case of bridge and tunnel inspection, computer vision based visualization methods (e.g. image stitching) successfully assist in defect detection and assessment as they improve the defect detection results due to better resolution. Concerning asphalt pavements, the crack properties retrieval procedure (type, with, length) is fully automated and some computer vision based distress quantification measures have the potential to be converted to indexes for distress assessment. 4.2 Challenges Concerning computer vision supported concrete bridge inspection, it has to be mentioned that the process of image and video data collection is not yet fully automated. In terms of crack detection and assessment, existing methods need to be improved as performances on noisy data are questionable and accuracies vary with camera pose, camera distance and environmental conditions (lighting and shading at different locations). Moreover, several methods still require a significant amount of manual user input. In general, most of the methods assume images from simple flat and curved concrete surfaces, so that they may fail in cases of more complex geometries and material, such as joints, seals and bearings. Accordingly, there are currently no methods available that support the detection and assessment of bearing distortion and misalignment. When looking at underground civil infrastructure, such as tunnels and pipes, it is concluded that poor lighting conditions, irregularly patterned background and contrast as well as limited data quality and quantity impose the most significant problems when dealing with computer vision based approaches to defect detection and assessment. With respect to lighting, common methods either use prior knowledge, thus can hardly be generalized or they rely on some degree of manual input and therefore do not scale well. More recent methods that use machine learning strongly rely on training data to create robust classifiers. Usually, the training process is based on supervised learning concepts (manual labeling) and is therefore labor-intensive and error prone. With regard to pipe inspection, the limited amount of data for machine learning and the lack of standardization on defect patterns prevent those methods to perform reasonably well. In addition, detection models with few parameters have limited generalizability, whereas models with many parameters fail in environments with a wide range of background pattern and texture due to the poor convergence of inherent non-linear optimization problems.
24
1 2 3 4 5 6 7 8 9 10 11 12 13 14 15 16 17 18 19 20 21 22 23 24 25 26 27 28 29 30 31 32 33 34 35 36 37 38 39 40 41 42 43 44 45 46 47 48 49 50 51 52 53 54 55 56 57 58 59 60 61 62 63 64 65
With respect to asphalt pavement monitoring, natural weather conditions and the daytime determine the success of available computer vision based defect detection and assessment methods. Shadows from trees, for example are very natural and prevent several methods, which usually work well in good lighting conditions, to perform reasonably well in real environments. Moreover, many algorithms endeavor to perform real-time and therefore are based on some kind of thresholding. However, these methods are not robust enough for image data with average image quality in practice as it is hard to find universal thresholds. Consequently, fully automated and comprehensive pavement distress detection and classification in a real-time environment has remained a challenge. Also, there is no comprehensive and robust method available to determine the severity level of distress for defect and condition assessment of asphalt pavements. In general, reliable defect detection and condition assessment of civil infrastructure must be based not only on visual inspection methods. First, computer vision methods work under the principle “What you see is what you can analyze.” This means, that scenes under observation have to be sufficiently illuminated to make computer vision methods work. Visible shadows, for example, might have a significant impact on the capability of CV methods. In case of pothole detection shadows support the process, where in cases of 3D reconstruction they hinder the procedure. Moreover, the internal condition of infrastructure components cannot be captured, thus neither assessed using visual methods. On top of visual assessment techniques (whether manual or CVsupported), other advanced in-depth inspection methods (so-called Non-destructive evaluation (NDE) methods) are required to assess the overall condition, such as sonic, ultrasonic, magnetic, electrical, nuclear, thermography, radar technologies. However, defects on the surface are good indicators of the overall condition as they are part of many visual condition assessment manuals. Second, the data quality plays an important role in terms of noise, distance and perspective to the object of interest and the corresponding image resolution. For instance, if one wants to detect a crack of 1 millimeter width, he or she has to make sure that this 1 millimeter is mapped to a least 1 image pixel. Third, a number of safety risks are associated with working at certain heights and under heavy traffic. In this case, however, emerging remote-controlled unmanned aerial vehicles (UAV) might be a good practical solution for this issue. Forth, the operation of cameras always has to face privacy issues when monitoring public scenes, such as bridges and roads. Thus, it is recommended avoiding people in image and video data. In summary, the authors conclude that more studies need to be conducted to improve the methods and algorithms for integrated condition assessment. It is currently not possible to detect, measure assess and document all different defects as independent entities to provide an integrated and comprehensive approach for bridge, tunnel, pipe and asphalt inspections. This is mainly due to the unsolved problem of identifying and assessing multiple interacting defects at the same location and the lack of standardization in identifying relevant defect parameters to comprehensively represent defect information. Moreover, no publically available large datasets exist to leverage supervised learning methods for the robust detection and classification of several infrastructure defect types.
25
1 2 3 4 5 6 7 8 9 10 11 12 13 14 15 16 17 18 19 20 21 22 23 24 25 26 27 28 29 30 31 32 33 34 35 36 37 38 39 40 41 42 43 44 45 46 47 48 49 50 51 52 53 54 55 56 57 58 59 60 61 62 63 64 65
The following listing highlights the key research questions that have to be addressed by future research both in the civil engineering and computer science community in order to take the quality of computer vision based defect detection and condition assessment of civil infrastructure to the next level: How can we comprehensively detect, measure and assess interacting defect patterns at the same location to support integrated condition assessment of civil infrastructure, How can we generalize available detection models to adequately and universally address realistic environmental conditions, such as noisy image and video data, varying lighting conditions, different surface geometries and materials, and different camera poses and distances? How can we limit the amount of manual user input to improve the level of automation from poor defect detection to sophisticated defect and condition assessment? How can we create sufficiently large, publically available and standardized datasets to leverage the power of existing supervised machine learning methods for detection, classification and assessment of defects? How can we create unsupervised machine learning methods (online learning) for efficient training and on-demand updating of model parameters in defect detection and assessment models?
5. SUMMARY To ensure the safety and serviceability of civil infrastructure it is essential to visually inspect and assess its physical and functional condition, either at regular intervals (routine inspection) or after disasters (post-disaster inspection). Typically, such condition assessment procedures are performed manually by certified inspectors and/or structural engineers. This process includes the detection of the defects and damage (cracking, spalling, defective joints, corrosion, potholes, etc.) existing on civil infrastructure elements, such as buildings, bridges, roads, pipes and tunnels, and the defects’ magnitude (number, width, length, etc.). The condition assessment results are used to predict future conditions, to support investment planning, and to allocate limited maintenance and repair resources. This paper has presented the current practices of assessing the visual condition of vertical and horizontal civil infrastructure, in particular of reinforced concrete bridges (horizontal: decks, girders, vertical: columns), precast concrete tunnels (horizontal: segmental lining), underground concrete pipes (horizontal) (wastewater infrastructure), and asphalt pavements (horizontal). Following this, the second and largest part of the paper has focused on a comprehensive synthesis of the state of the art in computer vision based defect detection and condition assessment of civil infrastructure. Several methodologies have been described and categorized, and literature on respective tests and evaluations on the current performances to detect and measure different defect and damage pattern in remote and close-up images of buildings, bridges, roads, pipes and tunnels has been presented. In the third part of this paper the current achievements and limitations 26
1 2 3 4 5 6 7 8 9 10 11 12 13 14 15 16 17 18 19 20 21 22 23 24 25 26 27 28 29 30 31 32 33 34 35 36 37 38 39 40 41 42 43 44 45 46 47 48 49 50 51 52 53 54 55 56 57 58 59 60 61 62 63 64 65
of computer vision for infrastructure condition assessment have been summarized. Finally, open research challenges have been outlined to assist both the civil engineering and the computer science research community in setting an agenda for future research.
REFERENCES [1]
National Transportation Safety Board, "Collapse of I-35W Highway Bridge, Minneapolis, Minnesota, August 1, 2007," 2008. [Online]. Available: http://www.dot.state.mn.us/i35wbridge/ntsb/finalreport.pdf.
[2]
T. Asakura and Y. Kojima, "Tunnel maintenance in Japan," vol. 18, no. 2-3, pp. 161 - 169, 2003.
[3]
R. Zaurin and F. N. Catbas, "Integration of computer imaging and sensor data for 912 structural health monitoring of bridges," Smart Mater. Struct., vol. 19, no. 1, 2010.
[4]
AASHTO publication, "Manual for Bridge Element Inspection," 2013.
[5]
Z. Zhu, S. German and I. Brilakis, "Detection of large-scale concrete columns for automated bridge inspection," Automation in Construction, vol. 19, no. 8, pp. 1047-1055, 2010.
[6]
FHWA report, "Reliability of Visual Inspection for Highway Bridges," 2001.
[7]
NHI-FHWA online course, "Introduction to Safety Inspection of In-Service Bridges".
[8]
Federal Highway Admistration (FHWA), "Tunnel Operations, Maintenance, Inspection and Evaluation (TOMIE) Manual," 2011.
[9]
Federal Highway Administration (FHWA) and Federal Transit Admistration, "Highway and Rail Transit Tunnel Inspection Manual," U.S. Department of Transportation, 2005.
[10] National Cooperative Highway Research Program Project 20-68A, "Best Practices for Roadway Tunnel Design, Construction, Maintenance, Inspection, and Operation," 2011. [11] Pavemetrics, "Laser tunnel scanning system (LTSS), Advanced Vision Technology 3D | Pavemetrics TM," Pavemetrics Systems Inc., [Online]. Available: http://www.pavemetrics.com/en/ltss.html. [Accessed 3 11 2014]. [12] DIBIT, "Tunnel Scanning, Tunnel, Service, Home, DIBIT Messtechnik GmbH," DIBIT Messtechnik GmbH, [Online]. Available: http://www.dibit.at/dienstleistungen/tunnelbau/tunnelscanning/. [Accessed 3 11 2014]. [13] B. Cohen, "Fixing America's Crumbling Underground Water Infrastructure," Issue Analysis, vol. 4, 2012. [14] T. Iseley, D. M. Abraham and S. Gokhale, "Intelligent sewer condition evaluation
27
1 2 3 4 5 6 7 8 9 10 11 12 13 14 15 16 17 18 19 20 21 22 23 24 25 26 27 28 29 30 31 32 33 34 35 36 37 38 39 40 41 42 43 44 45 46 47 48 49 50 51 52 53 54 55 56 57 58 59 60 61 62 63 64 65
technologies," Proc. of Intl. NO-DIG Conf., pp. 254 - 265, 1997. [15] R. Wirahadikusumah, D. M. Abraham, T. Iseley and R. K. Prasanth, "Assessment technologies for sewer system rehabilitation," Journal of Automation in Construction, vol. 7, no. 4, p. 259– 270, 1998. [16] S. K. Sinha and P. Fieguth, "Segmentation of buried concrete pipe images," Automation in Construction, vol. 15, pp. 47 - 57, 2006. [17] O. Duran, K. Althoefer and L. Seneviratne, "State of the Art in Sensor Technologies for Sewer Inspection," IEEE Senors Journal, vol. 2, no. 2, pp. 73--81, 2002. [18] W. Guo, L. Soibelman and J. H. Garrett, "Automated defect detection for sewer pipeline inspection and condition assessment," AUTOMATION IN CONSTRUCTION, vol. 18, no. 5, pp. 87-596, 2009. [19] T. Hao, "Condition assessment of the buried utility service infrastructure," TUNNELLING AND UNDERGROUND SPACE TECHNOLOGY, vol. 28, pp. 331-344, 2012. [20] O. Duran, K. Althoefer and L. D. Senevatne, "Automated pipe defect detection and categorization using camera/laser-based profiler and artificial neural network," IEEE 1063 TRANSACTIONS ON AUTOMATION SCIENCE AND ENGINEERING, vol. 4, no. 1, pp. 118-126, 2007. [21] M.-D. Yang and T.-C. Su, "Automated diagnosis of sewer pipe defects based on machine learning approaches," EXPERT SYSTEMS WITH APPLICATIONS, vol. 35, no. 3, pp. 13271337, 2008. [22] M. Halfawy and J. Hengmeechai, "Efficient Algorithm for Crack Detection in Sewer Images from Closed-Circuit Television Inspections," Journal of Infrastructure Systems, vol. 20, no. 2, 2014. [23] M. Halfawy and J. Hengmeechai, "Automated defect detection in sewer closed circuit television images using histograms of oriented gradients and support vector machine," Automation in Construction, vol. 38, pp. 1-13, 2014. [24] J. Halfawy and J. Hengmeechai, "Optical flow techniques for estimation of camera motion parameters in sewer closed circuit television inspection videos," Automation in Construction, vol. 38, no. 2014, pp. 39-45. [25] S. K. Sinha and P. Fieguth, "Automated detection of crack defects in buried concrete pipe images," Automation in Construction, vol. 15, no. 1, pp. 58 - 72, 2006. [26] M. Chae and D. Abraham, "Neuro-fuzzy approaches for sanitary sewer pipeline condition assessment," JOURNAL OF COMPUTING IN CIVIL ENGINEERING, vol. 15, no. 1, pp. 414, 2001. [27] O. Duran, K. Althoefer and L. D. Seneviratne, "Pipe inspection using a laser-based transducer and automated analysis techniques," IEEE-ASME TRANSACTIONS ON MECHATRONICS, vol. 8, no. 3, pp. 401-409, 2003.
28
1 2 3 4 5 6 7 8 9 10 11 12 13 14 15 16 17 18 19 20 21 22 23 24 25 26 27 28 29 30 31 32 33 34 35 36 37 38 39 40 41 42 43 44 45 46 47 48 49 50 51 52 53 54 55 56 57 58 59 60 61 62 63 64 65
[28] R. Kirkham, P. D. Kearney and K. J. Rogers, "PIRAT - A system for quantitative sewer pipe assessment," INTERNATIONAL JOURNAL OF ROBOTICS RESEARCH, vol. 19, no. 11, pp. 1033-1053, 2000. [29] S. Iyer, S. K. Sinha, B. R. Tittmann and M. K. Pedrick, "Ultrasonic signal processing methods for detection of defects in concrete pipes," Automation in Construction, vol. 22, p. 135–148, 2012. [30] S. Iyer, S. K. Sinha, M. K. Pedrick and B. R. Tittmann, "Evaluation of ultrasonic inspection and imaging systems for concrete pipes," Automation in Construction, vol. 22, p. 149–164, 2012. [31] Y. Lei and Z. Zheng, "Review of Physical Based Monitoring Techniques for Condition Assessment of Corrosion in Reinforced Concrete," Mathematical Problems in Engineering, 2013. [32] F. Chughtai and T. Zayed, "Infrastructure condition prediction models for sustainable sewer pipelines," JOURNAL OF PERFORMANCE OF CONSTRUCTED FACILITIES, vol. 22, no. 5, pp. 333-341, 2008. [33] M. A. Hahn, R. N. Palmer and M. S. Merrill, "Expert system for prioritizing the inspection of sewers: Knowledge base formulation and evaluation," JOURNAL OF WATER RESOURCES PLANNING AND MANAGEMENT-ASCE, vol. 128, no. 2, pp. 121-129, 2002. [34] J. Dirksen and F. H. L. R. Clemens, "Probabilistic modeling of sewer deterioration using inspection data," WATER SCIENCE AND TECHNOLOGY, vol. 57, no. 10, pp. 1635-1641, 2008. [35] E. V. Ana and W. Bauwens, "Modeling the structural deterioration of urban drainage pipes: the state-of-the-art in statistical methods," URBAN WATER JOURNAL, vol. 7, no. Special Issue: SI, pp. 47-59, 2010. [36] "2013 Report Card for America’s Infrastructure," http://www.infrastructurereportcard.org/a/documents/Roads.pdf.
[Online].
Available:
[37] NCHRP, "Automated Pavement Distress Collection Techniques: A Synthesis of Highway Practice," 2004. [38] U.S. Army Corps of Engineers, "PAVER Asphalt Distress Manual, TR 97/104," 1997. [39] The Ohio Department of Transportation, "Pavement Condition Rating System," 2004. [40] Opus Consultants International (Canada) Limited, "Pavement Surface Condition Rating Manual," 2012. [41] Northwest Pavement Management Systems Users Group and and R. Keith Kay Washington State Department of Transportation, "Pavement Surface Condition Rating Manual". [42] The South African National Roads Agency Limited, "Visual Pavements Assessment for Concrete Pavements," 1998. 29
1 2 3 4 5 6 7 8 9 10 11 12 13 14 15 16 17 18 19 20 21 22 23 24 25 26 27 28 29 30 31 32 33 34 35 36 37 38 39 40 41 42 43 44 45 46 47 48 49 50 51 52 53 54 55 56 57 58 59 60 61 62 63 64 65
[43] German Department of Transportation - Road and Transportation Research Association (FGSV), "Additional technical contractual terms and guidelines for pavement condition survey and assessment (ZTV ZEB-StB)," 2006. [44] P. Prasanna, "Computer vision for automated surface evaluation of concrete bridge decks," Rutgers University, Master’s thesis, 2013. [45] M. R. K. J. S. M. S. F. a. S. G. S. Jahanshahi, "A survey and evaluation of promising approaches for automatic image-based defect detection of bridge structures," J. Struct. Infrastruc. Eng., vol. 5, no. 6, pp. 455-486, 2009. [46] P. Rose, B. Aaron, D. E. Tamir, L. Lu, J. Hu and H. Shi, "Supervised Computer-VisionBased Sensing of Concrete Bridges for Crack-Detection and Assessment," Transportation Research Board, 2014. [47] I. Abdel-Qader, O. Abudayyeh and M. E. Kelly, "Analysis of egde-detection techniques for crack identification in bridges," Journal of Computing in Civil Engineering, vol. 17, no. 4, pp. 255-263, 2003. [48] T. Yamaguchi, S. Nakamura, R. Saegusa and S. Hashimoto, "Image-based crack detection for real concrete surfaces," IEEJ Trans.Electr. Electron. Eng., vol. 3, no. 1, p. 128–135, 2008. [49] T. Yamaguchi and S. Hashimoto, "Fast crack detection method for large-size concrete surface images using percolation-based image processing," Mach. Vision Appl., vol. 21, no. 5, p. 797–809, 2010. [50] C. Koch, S. Paal, A. Rashidi, Z. Zhu, M. König and I. Brilakis, "Achievements and Challenges in Machine Vision-Based Inspection of Large Concrete Structures," Advances in Structural Engineering, vol. 17, no. 3, pp. 303-318, 2014. [51] I. Abdel-Qader, S. Pashaie-Rad, O. Abudayyeh and S. Yehia, "PCA-based algorithm for unsupervised bridge crack detection," Adv. Eng. Softw., vol. 37, no. 12, p. 71–778, 2006. [52] P. Prasanna, K. Dana, N. Gucunski and B. Basily, "Computer-vision based crack detection and analysis," SPIE Smart Structures and Materials+ Nondestructive Evaluation and 945 Health Monitoring. International Society for Optics and Photonics, p. 834 542, 2012. [53] D. Lattanzi and G. R. Miller, "Robust Automated Concrete Damage Detection Algorithms for Field Applications," J. Comput. Civ. Eng., vol. 28, no. 2, p. 253–262, 2014. [54] M. R. M. S. F. Jahanshahi, "Adaptive vision-based crack detection using 3D scene reconstruction for condition assessment of structures," Automation in Construction, vol. 22, pp. 567-576, 2012. [55] M. G.-F. M. K. K. Torok, "Image-Based Automated 3D Crack Detection for Post-disaster Building Assessment," Journal of Computing in Civil Engineering, vol. 28, no. 5, 2014. [56] S. Yu, J. Jang and C. Han, "Auto inspection system using a mobile robot for detecting concrete cracks in a tunnel," Journal of Computation in Civil Engineering, vol. 17, no. 4,
30
1 2 3 4 5 6 7 8 9 10 11 12 13 14 15 16 17 18 19 20 21 22 23 24 25 26 27 28 29 30 31 32 33 34 35 36 37 38 39 40 41 42 43 44 45 46 47 48 49 50 51 52 53 54 55 56 57 58 59 60 61 62 63 64 65
pp. 255-263, 2006. [57] J. K. Oh, G. Jang, S. Oh, J. H. Lee, B. J. Yi, Y. S. Moon, J. S. Lee and Y. Choi, "Bridge inspection robot system with machine vision," Automation in Construction, vol. 18, p. 929– 941, 2009. [58] M. R. M. S. F. P. C. W. a. S. G. S. Jahanshahi, "An innovative methodology for detection and quantification of cracks through incorporation of depth perception.," Mach. Vis. Appl., vol. 24, no. 2, pp. 227-241, 2013. [59] M. R. M. S. F. Jahanshahi, "A new methodology for non-contact accurate crack width measurement through photogrammetry for automated structural safety evaluation," Smart Mater. Struct., vol. 22, no. 3, 2013. [60] Z. Zhu, S. German and I. Brilakis, "Visual retrieval of concrete crack properties for automated post-earthquake structural safety evaluation," Autom. Constr., vol. 20, no. 7, p. 874–883, 2011. [61] R. S. Lim, H. M. La and W. Sheng, "A Robotic Crack Inspection and Mapping System for Bridge Deck Maintenance," Automation Science and Engineering, vol. 11, no. 2, 2014. [62] S. German, I. Brilakis and R. DesRoches, "Rapid entropy-based detection and properties measurement of concrete spalling with machine vision for post-earthquake safety assessments," Advanced Engineering Informatics, vol. 26, no. 4, pp. 846-858, 2012. [63] R. S. Adhikari, O. Moselhi and A. Bagchi, "A study of Image-based Element Condition Index for Bridge Inspection," in ISARC, 2013. [64] R. S. Adhikari, O. Moselhi and A. Bagchi, "Image-based retrieval of concrete crack properties for bridge inspection," Automation in Construction, vol. 39, pp. 180-194, 2014. [65] T. Uhl, P. Kohut, K. Holak and K. Krupinski, "Vision based condition assessment of structures," Journal of Physics: Conference Series, vol. 305, no. 1, 2011. [66] P. Kohut, K. Holak and T. Uhl, "Monitoring of civil engineering structures supported by vision system," European Workshop on Structural health monitoring, pp. 1575-1582, 2012. [67] K. Chaiyasarn, "Damage Detection and Monitoring for Tunnel Inspection based on Computer Vision," Christ’s College, University of Cambridge, UK, Dissertation, 2011. [68] K. Soga, "Micro-measurement and monitoring system for ageing underground infrastructures (underground m3)," in Proceedings of the World Forum on Smart Materials and 994 Smart Structures Technology (SMSST’07), Chongqing & Nanjing, China, 2007. [69] A. Miyamoto, M. Konno and E. Bruhwiler, "Automatic crack recognition system for concrete structures using image processing approach," Asian Journal of Information Technology, vol. 6, no. 5, p. 553–561, 2007. [70] Y. Fujita, Y. Mitani and Y. Hamamoto, "A method for crack detection on a concrete structure," ICPR’2006:IEEE 18th International Conference on Pattern Recognition, vol. 3, p. 901–904, 2006. 31
1 2 3 4 5 6 7 8 9 10 11 12 13 14 15 16 17 18 19 20 21 22 23 24 25 26 27 28 29 30 31 32 33 34 35 36 37 38 39 40 41 42 43 44 45 46 47 48 49 50 51 52 53 54 55 56 57 58 59 60 61 62 63 64 65
[71] M. Ukai, "Development of image processing technique for detection of tunnel wall deformation using continuously scanned image," Quarterly report - RTRI, vol. 41, no. 3, p. 120–126, 2000. [72] G. Paar, H. Kontrus and O. Sidla, "Optical crack following on tunnel surfaces," Proceedings of the SPIE International Society for Optical Engineering, vol. 6382, 2006. [73] Z. Liu, S. Azmin, T. Ohashi and T. Ejima, "A tunnel crack detection and classification systems based on image processing," Society of Photo-Optical Instrumentation Engineers (SPIE) Conference Series, vol. 4664, p. 145–152, 2002. [74] K. Chaiyasarn, K. Tae-Kyun, F. Viola, R. Cipolla and K. Soga, "Image mosaicing via quadric surface estimation with priors for tunnel inspection," 16th 1018 IEEE International Conference on Image Processing (ICIP), pp. 537-540, 2009. [75] N. Snavely, S. Seitz and R. Szeliski, "Photo tourism: exploring photo collections in 3d," ACM Transactions on Graphics, vol. 25, no. 3, p. 835–846, 2006. [76] M. R. Jahanshahi, S. F. Masri and G. S. Sukhatme, "Multi-image stitching and scene reconstruction for evaluating defect evolution in structures," Structural Health Monitoring, vol. 10, no. 6, p. 643–657, 2011. [77] Y. Lim, G. Kim, K. Yun and H. Sohn, "Monitoring crack changes in concrete structures," Computer-Aided Civil and Infrastructure Engineering, vol. 20, p. 52–61, 2005. [78] Z. Chen and T. C. Hutchinson, "Image-Based Framework for Concrete Surface Crack Monitoring and Quantification," Advances in Civil Engineering, 2010. [79] H.-B. Kuntze and H. Haffner, "Experiences with the development of a robot for smart multisensoric pipe inspection," Proceedings of the 1998 IEEE, International Conference on 1093 Robotics & Automation, Leuven, Belgium, 1998. [80] R. Duda, P. Hart and D. Stork, Pattern Classification, Wiley, 2001. [81] A. Bovik, Handbook of Image and Video Processing, Academic Press, 2004. [82] K. Castleman, Digital Image Processing, Prentice-Hall, 1996. [83] L. Shapiro and G. Stockman, Computer Vision, Prentice-Hall, 2001. [84] P. Soille, Morphological Image Analysis, Springer, 2003. [85] J. Serra, Image Analysis and Mathematical Morphology, Academic Press, 1988. [86] T. Su and M. Yang, "Application of Morphological Segmentation to Leaking Defect Detection in Sewer Pipelines," Sensors, vol. 14, no. 5, pp. 8686-8704, 2014. [87] G. Hinton, S. Osindero and Y. The, "A fast learning algorithm for deep belief nets," Neural Computation, 2006. [88] S. Sinha and P. Fieguth, "Neuro-Fuzzy Network for the Classification of Buried Pipe Defects," Automation in Construction, vol. 15, pp. 73-83, 2006. [89] K. Kawasue and T. Komatsu, "Shape Measurement of a Sewer Pipe Using a Mobile Robot
32
1 2 3 4 5 6 7 8 9 10 11 12 13 14 15 16 17 18 19 20 21 22 23 24 25 26 27 28 29 30 31 32 33 34 35 36 37 38 39 40 41 42 43 44 45 46 47 48 49 50 51 52 53 54 55 56 57 58 59 60 61 62 63 64 65
with Computer Vision," International Journal of Advanced Robotic Systems, vol. 10, no. 52, 2013. [90] K. C. Wang, "Positioning and Imaging Sensors for Automated Asset Management of Transportation Facilities," Proc. of the 1st International Conference on Transportation Engi-neering (ICTE), 2007. [91] Y.-C. Tsai, V. Kaul and R. M. Mersereau, "Critical Assessment of Pavement Distress Segmentation Methods," J. Transp. Eng., vol. 136, no. 1, p. 11–19, 2010. [92] E. H. Adelson, "Checkershadow Illusion," http://persci.mit.edu/gallery/checkershadow.
1995.
[Online].
Available:
[93] S. Varadharajan, S. Jose, K. Sharma, L. Wander and C. Mertz, "Vision for Road 1134 Inspection," pp. 2-9. [94] H. D. Cheng, "Automatic pavement distress detection system," vol. 108, no. 1-4, p. 219– 240, 1998. [95] Q. Zou, Y. Cao, Q. Li, Q. Mao and S. Wang, "CrackTree: Automatic crack detection from pavement images," Pattern Recognit. Lett., vol. 33, no. 3, p. 227–238, 2012. [96] T. S. Nguyen, M. Avila and B. Stephane, "AUTOMATIC DETECTION AND CLASSIFICATION OF DEFECT ON ROAD PAVEMENT USING ANISOTROPY 1141 MEASURE," p. 617–621, 2009. [97] H. Lokeshwor , L. K. Das and S. K. Sud, "Method for Automated Assessment of Potholes Cracks and Patches from Road Surface Video Clips," Procedia - Soc. Behav. Sci., vol. 104, p. 312–321, 2013. [98] S. C. Radopoulou and I. Brilakis, "Improving Patch Distress Detection Using Vision Tracking on Video Data," Proceedings of the 21st International Workshop on Intelligent Computing in Engineering, 2014. [99] L. Li, G. N. Sun and S. Tan, "AUTOMATIC PAVEMENT CRACK RECOGNITION BASED ON BP NEURAL NETWORK," vol. 26, no. 1, pp. 11-22, 2014. [100] M. Salman, S. Mathavan, K. Kamal and M. Rahman, "Pavement crack detection using the Gabor filter," 16th Int. IEEE Conf. Intell. Transp. Syst. (ITSC 2013), p. 2039–2044, 2013. [101] J. Zhou, P. S. Huang and F.-P. Chiang, "Wavelet-based pavement distress detection and evaluation," Opt. Eng., vol. 45, no. 2, 2006. [102] H. Lokeshwor, L. K. Das and S. Goel, "Robust Method for Automated Segmentation of Frames with/without Distress from Road Surface Video Clips," Journal of Transportation Engineering, vol. 140, no. 1, pp. 31-41, 2014. [103] K. P. Wang and W. Gong, "Real-Time Automated Survey System of Pavement Cracking," Journal of Infrastructure Systems, vol. 11, no. 3, p. 154–164, 2005. [104] Y. Huang and B. Xu, "Automatic inspection of pavement cracking distress," Journal of Electronic Imaging, vol. 15, no. 1. 33
1 2 3 4 5 6 7 8 9 10 11 12 13 14 15 16 17 18 19 20 21 22 23 24 25 26 27 28 29 30 31 32 33 34 35 36 37 38 39 40 41 42 43 44 45 46 47 48 49 50 51 52 53 54 55 56 57 58 59 60 61 62 63 64 65
[105] Y. Sun, E. Salari and E. Chou, "Automated Pavement Distress Detection Using Advanced Image Processing Techniques," Proc. of the Int. Conf. on Electro/Information Technology, p. 373–377, 2009. [106] S. Amarasiri, M. Gunaratne and S. Sarkar, "Modeling of Crack Depths in Digital Images of Concrete Pavements Using Optical Reflection Properties," J. Transp. Eng, vol. 136, no. 6, p. 489–499. [107] C. Haas, "Evolution of an automated crack sealer: A study in construction technology development," Automation in Construction, vol. 4, no. 4, p. 293–305, 1996. [108] Y. S. Kim, H. S. Yoo, J. H. Lee and S. W. Han, "Chronological development history of X– Y table based pavement crack sealers and research findings for practical use in the field," Auto-mation in Construction, vol. 18, no. 5, p. 513–524, 2009. [109] H. N. Koutsopoulos and A. B. Downey, "Primitive-based classification of pavement cracking images," J. Transp. Eng, vol. 19, no. 3, pp. 136-143, 1993. [110] G. Moussa and K. Hussain, "A New Technique for Automatic Detection and Parameters Estimation of Pavement Crack," 4th Int. Multi-Conference Eng. Technol. Innov. IMETI 2011, 2011. [111] Q. Li, M. Yao, X. Yao and B. Xu, "A real-time 3D secanning system for pavement distortion inspection," Meas. Sci. Technol., vol. 21, p. 8, 2010. [112] K. Wang, "Challenges and feasibility for comprehensive automated survey of pavement conditions," in Proc. of the 8th Int. Conf. on Applications of Advanced Technologies in Transportation Engineering, 2004. [113] Z. Hou, K. Wang and W. Gong, "Experimentations of 3D pavement imaging through stereovision," in Proc. of Int. Conf. on Transportation Engineering (ICTE 2007), 2007. [114] K. Chang, Chang, J.R. and J. Liu, "Detection of pavement distresses using 3D laser scanning technology," in Prof. of the 2005 ASCE Int. COnf. on Computing in Civil Engineering, 2005. [115] W. Jiaqiu, M. Songlin and J. Li, "Research on automatic identification method of pavement sag deformation," in Prof. of the 9th Int. Conf. of Chinese Transportation Professionals (ICCTP), 2009. [116] J. Karuppuswamy, V. Selvaraj, M. M. Ganesh and E. L. Hall, "Detection and avoidance of simulated potholes in autonomous vehicle navigation in an unstructured environment," Intelligent Robots and Computer Vision XIX: Algorithms, Techniques, and Active Vision, Proc. of SPIE, vol. 4197, p. 70–80, 2000. [117] M. Jahanshahi, F. Jazizadeh, S. Masri and B. Becerik-Gerber, "Unsupervised Approach for Autonomous Pavement-Defect Detection and Quantification Using an Inexpensive Depth Sensor," Journal of Computing in Civil Engineering, vol. 27, no. 6, p. 743–754, 2013. [118] C. Koch and I. Brilakis, "Pothole Detection in Asphalt Pavement Images," Advanced
34
1 2 3 4 5 6 7 8 9 10 11 12 13 14 15 16 17 18 19 20 21 22 23 24 25 26 27 28 29 30 31 32 33 34 35 36 37 38 39 40 41 42 43 44 45 46 47 48 49 50 51 52 53 54 55 56 57 58 59 60 61 62 63 64 65
Engineering Informatics, vol. 25, no. 3, pp. 507-515, 2011. [119] G. W. Zack, W. E. Rogers and S. A. Latt, "Automatic measurement of sister chromatid exchange frequency," J. Histochem. Cytochem., vol. 25, no. 7, p. 741–753, 1977. [120] C. Koch, G. Jog and I. Brilakis, "Towards Automated Pothole Distress Assessment Using Asphalt Pavement Video Data," Journal of Computing in Civil Engineering, 2012. [121] S. Cafiso, A. Di Graziano and S. Battiato, "Evaluation Of Pavement Surface Distress Using Digital Image Collection And Analysis," pp. 1-10, 2006. [122] AASHTO publication, "Manual for Bridge Evaluation, 2nd Edition," 2010. [123] H. Cheng, X. Shi and C. Glazier, "Real-time image thresholding based on sample space reduction and interpolation approach," Journal of Computing in Civil Engineering, vol. 17, no. 4, p. 264–272, 2003. [124] K. L. Sanford, P. Herabat and S. McNeil, "Bridge Management and Inspection Data: Leveraging the Data and Identifying the Gaps," Transportation Research Board Circular 498, 2000.
35
Tables
Table 1: Defects related to general bridge elements (Grey: Required; White: Not Required)[4] Element Name
Del/Spall
Exp Rebar
Eff/Rust
Crack
Abr/Wr
Distor
Settle
Scour
Damage
Deck Top Flange Slab Bridge Railing Closed Web/Box girder Girder Beam Stringer Arch Floor Beam Column Pier wall Abutment Pile cap/Footing Pile Pier cap Culvert Approach Slab
*Del/Spall- Delamination/Spall/Patched area; Exp Rebar- Exposed Rebar; Eff/Rust- Efflorescence/Rust Staining; Crack- Cracking; Abr/Wr- Abrasion/Wear; Distor- Distortion; Settle- Settlement; Scour- Scouring
*
Corresponding author: Phone: +49-234-32-26174; E-mail:
[email protected]
Table 2: Examples of defects and guidelines for assessment of condition states [1] Defects
1 Good
Delamination/Spall/Patched Area None
2 Fair
Condition States 3 Poor
Spall: < 1 inch depth or < 6 inch diameter
4 Severe Situation worse than for Spall: >1 inch & Condition State 3 and if > 6 inch diameter; the inspector deems unsound patched that it might affect the area or if signs of strength or distress serviceability of the element
Surface white without build-up or Heavy build up leaching without with rust staining rust staining
Situation worse than for Condition State 3 and if the inspector deems that it might affect the strength or serviceability of the element
Efflorescence/Rust Staining
None
Cracking
Situation worse than for Condition State 3 and if Width < 0.012 Width 0.012-0.05 the inspector deems Width > 0.05 inch inch or spacing inch or spacing 1that it might affect the or spacing < 1 ft > 3 ft 3 ft strength or serviceability of the element
Abrasion/Wear
No abrasion/wear
Abrasion or wearing has exposed coarse aggregate but the aggregate remains secure in the concrete
2
Coarse aggregate is loose or has popped out of the concrete matrix due to abrasion or wear
Situation worse than for Condition State 3 and if the inspector deems that it might affect the strength or serviceability of the element
Table 3: Common civil/ structural defects of concrete tunnels and respective severity scales according to [9] Defect type / Severity Scaling
Minor < 6 mm deep
Cracking
< 0.80 mm
Moderate 6 – 25 mm deep
Spalling / Joint Spall
0.80 – 3.20 mm, or < 0.10 mm (prestressed member) < 12 mm deep or 75 – 12 – 25 mm deep or 150 mm in diameter ~150 mm in diameter
Pop-Outs (holes)
< 10 mm in diameter
Leakage
Wet surface, no drops
10 – 50 diameter
Severe > 25 mm deep > 3.20 mm, or > 0.10 mm (prestressed member) > 25 mm deep or > 150 mm in diameter
in 50 – 75 mm in diameter (> 75 mm are spalls) Active flow at volume Active flow at volume < 30 drips per minute > 30 drips per minute
3
mm
Table 4: Examples of pavement defect assessment measurements and condition indices Ohio [39] British Washington South Germany [43] Columbia [41] Africa [42] [40] Measurement Severity, Severity, Severity, Degree, Extent extent density extent extent Index Pavement Pavement Pavement Visual Substance value condition distress condition condition (surface) rating index rating index .
4
Table 5. Level of automation in computer vision based defect detection and condition assessment: (+) achieved, (~) partially achieved, () not achieved yet Infrastructure element
Reinforced concrete bridges
Precast concrete tunnels Underground concrete pipes
Asphalt pavements
Defect detection Defect type
Defect assessment
Presence
Location
Cracks
+
+
+/~
~
Spalling
+
+
+/~
~
Other: Loss of connectivity, substructure settlements, member deflection
~
~
+
+
~
~
Joint spalling
+
+
~
~
Cracks
+
+
~
~
+
+
~
Joint damage
+
+
~
Cracks
+
+
+
~
+
+
~
+
+
~
Cracks +
Holes
Potholes
+
+
Condition assessment
~ ~
Patches
*
Data collection
Defect properties retrieval (type, width, length, etc.)
Corresponding author: Phone: +49-234-32-26174; E-mail:
[email protected]
*
Corresponding author: Phone: +49-234-32-26174; E-mail:
[email protected]
Figures
Intermediate-level processing
Low-level processing Image acquisition
Preprocessing
Segmentation
Feature extraction
General computer vision methods
restoration, contrast enhancement, noise reduction
thresholding, edge detection, region growing, clustering
features related to color, texture, shape, motion
Specific methods used for defect detection, classification, and assessment of civil infrastrucure
High-level processing Object recognition
Structural analysis
classification of materials, objects, shapes, locations
Preprocessing
Feature-based methods
Model-based methods
Median filtering
Haarwavelets
Percolation-based models
Morphologic operations
Hough transform
Graph-based search
spatiotemporal scene understanding,
Pattern-based methods Nearest neighbor Principle Component Analysis
3D Reconstruction Stereo reconstr. Optical flow
Histogram equalization
Histogram of Oriented Gradients (HoG)
Generalized Hough transform
Multi-view reconstruction
Image stitching
Laplacian of Gaussian (LoG)
Line-tracing algorithms
Neural networks
Shadow removal
Garbor filtering
Multi-temporal methods
Background substraction
Canny Wavelet transform
Support vector machines
Image stitching Image registration
Figure 1: Categorizing general computer vision methods (top) and specific methods to defect detection, classification and assessment of civil infrastructure.
Figure 2: The checker shadow illusion [88]: The squares marked A and B share the same grey intensity (©1995, Edward H. Adelson).