José Luis Rojo-Álvarez, Member, IEEE, Manel Martínez-Ramón, Member, IEEE,. Mario de Prado-Cumplido, Student Member, IEEE, Antonio Artés-Rodríguez, ...
IEEE TRANSACTIONS ON SIGNAL PROCESSING, VOL. 52, NO. 1, JANUARY 2004
155
Support Vector Method for Robust ARMA System Identification José Luis Rojo-Álvarez, Member, IEEE, Manel Martínez-Ramón, Member, IEEE, Mario de Prado-Cumplido, Student Member, IEEE, Antonio Artés-Rodríguez, Senior Member, IEEE, and Aníbal R. Figueiras-Vidal, Senior Member, IEEE
Abstract—This paper presents a new approach to auto-regressive and moving average (ARMA) modeling based on the support vector method (SVM) for identification applications. A statistical analysis of the characteristics of the proposed method is carried out. An analytical relationship between residuals and SVM-ARMA coefficients allows the linking of the fundamentals of SVM with several classical system identification methods. Additionally, the effect of outliers can be cancelled. Application examples show the performance of SVM-ARMA algorithm when it is compared with other system identification methods. Index Terms—ARMA modeling, cross-correlation, support vector method, system identification, time series.
I. INTRODUCTION
A
FREQUENT approach to digital signal processing is to propose a model composed by two discrete-time processes (DTP), which are the input and the output to a linear, time-invariant system (LTIS). An LTIS is usually approximated by means of a rational transfer function that can be an all-zero or moving average (MA), an all-pole or auto-regressive (AR), or a general zero-pole (ARMA) system. ARMA modeling is useful in problems such as system identification, time-series analysis, spectral analysis, and deconvolution. A number of applications for ARMA modeling can be enumerated. For example, in digital communications, channel identification provides a way of reducing intersymbol interference; in addition, channels of multiuser detection schemes can be viewed as multiple-input multiple-output systems, and the MA structure is used to compensate the effect of multipath signal propagation [1]. In radar signal processing, adaptiveness is better achieved by means of ARMA implementations, getting advantage with respect to the Fourier transform in the robust determination of Doppler spectrum [2], [3]. Biomedical signals can be analyzed to build models for diagnosis purposes; spectral analysis of the heart-rate variability and its relationship to blood pressure variability are useful in arrhythmia risk stratification of patients with previous myocardial infarction [4]; cardiovascular models of the aortic vein state can be estimated from blood pressure and flow measurements [5]; and spectral analyses of electroencephalographic potentials enable a deeper knowledge of the brain [6]. Manuscript received December 10, 2002; revised April 10, 2003. This work was supported in part by CICYT under Grants TIC 1999-0216 and TIC 20000380-C03-03. The associate editor coordinating the review of this paper and approving it for publication was Prof. Ioan Tabus. The authors are with the Department of Signal Theory and Communications, University Carlos III de Madrid, 28911 Leganés, Madrid, Spain. Digital Object Identifier 10.1109/TSP.2003.820084
Classical ARMA estimation methods present some limitations. • Analysis of DTP with atypical samples (outliers) is neither easy nor immediate, and it is usually achieved by heuristic or even visual inspection methods [12]. So, the use of robust cost functions to avoid the effect of outliers often arises numerical optimization disadvantages. • In general terms, ARMA methods require a previous determination of model complexity or number of parameters in the model, and they are quite sensitive to wrong order choice [9]. • Finally, error surfaces are not convex in many cases. Even worse, sample-based approximations to convex theoretical surfaces can exhibit local minima. In this paper, we introduce a new approach to ARMA modeling that is based on the support vector method (SVM). The SVM was first proposed to obtain maximum margin separating hyperplanes in classification problems [13], but this technique has become a general learning theory [14], [15]. A comprehensive description of this method for classification and regression problems can be found in [16] and [17], respectively. Although some previous work has been done with SVM regression and time series analysis [7], [8], the algorithm that we present is formulated for system identification: a framework where robustness is specially needed. Robustness is just a main feature that SVM controls, as it will be shown in this paper. Besides, we develop a statistical analysis of the characteristics of our method. In addition, we pay special attention to the cost function used in this SVM approach, which is a scarcely discussed aspect in SVM regression literature, although it has a key relevance in signal processing environments. The approach to ARMA system identification drawn from SVM minimizes a regularized cost functional of the residuals. Potential advantages of SVM are the following. • It provides a unique solution. • It is a strongly regularized method, which is appropriate for ill-posed problems. • It extracts the maximum information from the available samples, although the statistical distribution is unknown. Consequently, SVM can diminish some of the limitations of classical ARMA system identification methods, as we will see below in more detail. The structure of the paper is as follows. In Section II, we introduce SVM-ARMA system identification equations, and we propose a robust cost function that leads to the corresponding
1053-587X/04$20.00 © 2004 IEEE
156
IEEE TRANSACTIONS ON SIGNAL PROCESSING, VOL. 52, NO. 1, JANUARY 2004
SVM-ARMA algorithm. Then, the relationship between residuals and SVM-ARMA coefficients is analyzed in Section III, yielding a useful statistical interpretation of SVM-ARMA terms. This allows the establishment of a comparison with classical system identification methods. Simulation and application examples are included in Section IV. Finally, in Section V, conclusions are drawn.
An equivalent formulation of the above process [13] is to minimize
(4)
II. SVM-ARMA FORMULATION and , which are the Let us consider two DTPs input and the output, respectively, of a rational LTIS. The corresponding difference equation is
where
, and
are slack variables or losses constrained to (5)
(1) (6) where and are the AR and MA coefficients of is a DTP standing for the the system, respectively, and effect of measurement errors. Let us also consider a set of consecutive samples of and a set of consecutive samples of observed at the same time instants. The difference equation can be used to set a relationship among observations, estimated parameters, and er, or residuals, comprehend rors. In this case, error terms both measurement and model approximation errors. In order to consider initial conditions, (1) is required only for time-lags , where . Assuming that and (also known as model order) can be properly chosen coefficients are usually estimated beforehand, ARMA from minimizing a cost functional, depending on the residuals. In general, SVM algorithms for linear classification and regression problems minimize a cost function for the residuals (CFR) that is called Vapnik’s (or -insensitive) loss function, which is given by if if
(7) for , where denotes both and . The primal-dual or Lagrange functional for this problem is obtained by introducing a nonnegative coefficient (Lagrange multiplier) for each constraint [19], yielding
(2)
norm of the model paand this CFR is regularized with the , SVM allows to obtain rameters [13], [18]. Whereas sparse solutions where the estimated classification or regression function depends only on a reduced number of the set of observed samples; these samples are called support vectors. The extension of SVM to nonlinear classifiers and regressors can be easily achieved by using Mercer’s kernels. An additional free parameter must be previously fixed to control the tradeoff between the cost of the residuals and the regularization term. This tradeoff is chosen according to some a priori knowledge of the problem or by using cross-validation techniques. The resulting functional is usually optimized via quadratic programming (QP) [19]. regularization, We propose to use Vapnik’s CFR plus an including both the AR and the MA model coefficients, to create what we call SVM-ARMA modeling. This corresponds to the unconstrained minimization of
(8)
and where the multipliers are constrained to , and (7) also stands. Equation (8) has to be minimized with respect to primal variables , , and and maximized with respect to Lagrange multipliers (also called dual variables) and . From (9) several consequences are drawn. First, dual variables are shown to be constrained between an upper and a lower bound
(3) (10)
ROJO-ÁLVAREZ et al.: SUPPORT VECTOR METHOD FOR ROBUST ARMA SYSTEM IDENTIFICATION
for
157
. Second, we can observe that (11)
(12) show the analytical relationship among the model coefficients, the dual coefficients, and the observations. Third, these conditions can be introduced into Lagrange functional (8) to remove the primal variables. After that, another term grouping can be by writing down done in
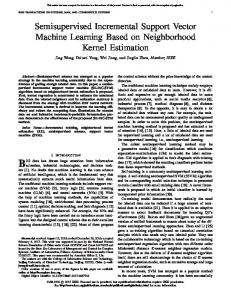
Fig. 1. Robust CFR for the SVM-ARMA algorithm. There are three different (possible) regions, allowing us to deal with different kinds of noise.
the Lagrange coefficients. This means that the QP problem we are really solving is the maximization of
(13)
(14) (19) These equations denote the time-local th- and th-order sample estimators of the values of the autocorrelation functions and , reof the input and the output DTP spectively. By introducing (13) and (14) into (8), the problem can be expressed in terms of the residual constraints and the data, and it is stated in vector-matrix form as the maximization of
(15) under constrains (10), and where
and
. This is a QP problem, and if we write (16) (17) (18) then the aim is to maximize with respect to under some linear constraints. It is clear that matrix is not invertible and the solution is unfeasible. Like in SVM regression [17], this problem can be ad hoc regularized by adding a small value diagonal matrix, i.e., by replacing the square matrix by . Matrix can be easily shown to be definite positive, and the resulting constrained QP problem has a single minimum, thus avoiding the local minima problems in the LS solution of the normal ARMA system identification equations [9]. Note that the above-mentioned numerical regularization is -norm regularization of the apparently different from the primal functional in (4); in fact, this numerical regularization is not always reported in SVM regression literature, and it is frequently treated as a simple numerical trick. However, the numerical regularization in the dual problem can be seen as an norm of additional term in the dual functional, given by the
constrained to (10). Several robust cost functions have been used in SVM regression, such as Vapnik’s loss function [13], Huber’s robust cost [7], or the ridge regression approach [20]. Here, we propose a more general cost function that has the above-mentioned ones as particular cases. Proposed robust CFR is depicted in Fig. 1, and it can be expressed as the following piecewise-defined function: (20) where . The three different intervals of serve is to deal with different kinds of noise. Insensitive zone adequate for low-frequency variations such as wander or baseline deviations. The quadratic cost zone takes into account the norm in this zone being appropriate observation noise, the for Gaussian processes. The linear cost zone limits the effect of either outliers or jitter noise on the model parameter estimation. Thus, the proposed robust SVM-ARMA algorithm is stated as the minimization of this robust CFR plus the regularization term:
(21) constrained to (5)–(7), where is the set of samples for which , and is the set of samples for which . Appendix A shows that the dual problem corresponding to (21) is equivalent to (19) in the sense that both reach their optimum for the same values of Lagrange coefficients. This fact permits a twofold interpretation. • When considering Vapnik’s loss function as the cost on the residuals, the regularized cost function for SVM-ARMA we are really working with is not (4), but rather (21), due to the effect of the numerical regularization.
158
IEEE TRANSACTIONS ON SIGNAL PROCESSING, VOL. 52, NO. 1, JANUARY 2004
• Far from being a disadvantage, considering the quadratic cost zone will allow to work with a more general cost function than Vapnik’s cost and for some kinds of DTP, it can be useful to set an appropriate value for free parameter . and ) are to be tuned. Note that three free parameters ( These parameters can be a priori fixed according to the statisleads to Huber’s robust tical model of DTPs. Selecting cost function [21]. In addition, represents Vapnik’s funcin tion, showing that it becomes nondifferentiable at the absence of numerical regularization. In a number of applications, some knowledge of the statistical properties of DTPs can be available. So, it will be desirable relating (20) to other cost criteria by establishing a general class of robust cost functions. When noise is Gaussian, the quadratic cost will be the most appropriate; however, in this case, insensitivity should be removed , and sparsity will not be achieved. For sub-Gaussian noise, a better performance could be obtained with a cubic or higher degree cost zone. If super-Gaussian (for instance, impulsive or heavy-tails) noise is present, it will be convenient to set but with so that we will not a low value for product have an ill-posed problem. III. STATISTICAL INTERPRETATION The consideration of the cost function in (20) allows us to trace an analytical relationship between residuals and Lagrange be multipliers in the SVM-ARMA algorithm (21). Let the Lagrange coefficients in the solution. Then, residuals and coefficients are related in the form
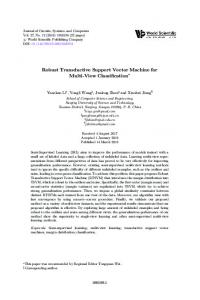
produces Fig. 2. Geometrical interpretation of error bias. LS solution v an unbiased averaged error d that is orthogonal to the space spanned by the can be seen as a regularized but biased data, whereas the SVM solution v solution with increased approximation averaged error e.
the bias-variance dilemma in SVM-ARMA versus LS system identification, a geometrical interpretation based on the orthogonality principle will be carried out. For the sake of simplicity, onto the sublet us consider the projection of a vector , as depicted in Fig. 2. According space generated by data , to LS criterion, the projection is denoted as whereas SVM projection is . SVM projection is obtained as the result of minimizing (23) constrained to
. From (24)
(22)
the following relationships can be established for the coefficients of both solutions:
. This analytical relationship is proved in Appendix B from Karush-Khun-Tucker (KKT) conditions when the solution of the QP problem is reached. Analytical relationship (22) between Lagrange multipliers and residuals in SVM-ARMA algorithm (21) allows us to compare the latter with classical algorithms. Although a really vast number of methods for system identification have been suggested, Ljung points out in [9] that there are two main general procedures. On the one hand, prediction-error methods (PEMs) are based on the minimization of a function of the residual power for a given model. PEMs contain well-known procedures such as the least-squares (LS) method, and they are closely related to Bayesian maximum a posteriori estimation [10]. On the other hand, correlation methods (CMs) seek for the minimization of the cross-correlation between a function of the residuals and a transformation of the data, possibly depending on the parameter vector; this approach includes the instrumental-variable 4 method (from now, Iv4), as well as several procedures for rational transfer function modeling [11]. Here, we present a brief comparison of SVM-ARMA with both kinds of methods. , , then Lagrange Comparison with PEM: If multipliers are just proportional to the residuals. To highlight
(25) from which (26) (27) Accordingly, SVM-ARMA coefficients given by (11) and (12) can be seen as the minimum norm projection of the solution onto the subspace that is generated by the input signal, the output signal, and their delayed versions. The model coefficients are calculated as the dot product between the nonlinearized error and the subspace base vectors. If the observation noise is Gaussian, and the observed data have actually been generated by an ARMA model, i.e., , then is an unbiased estimator of the model , we have coefficients [9], and for the th coefficient (28) where However,
denotes statistical expectation of a random variable. is a biased estimator since (29)
ROJO-ÁLVAREZ et al.: SUPPORT VECTOR METHOD FOR ROBUST ARMA SYSTEM IDENTIFICATION
and the bias is due to the regularization term. Additionally, the variance of the LS estimator is (30) whereas the variance of the SVM estimator is (31) In this case, biased SVM-ARMA will provide better estimators only if its variance is below LS variance, i.e., (32) As a consequence, in the presence of Gaussian noise and for an underlying ARMA model, the LS parameter estimator is the optimum solution in the sense of unbiased error. Here, SVM-ARMA algorithm will be able to provide a biased (yet reduced variance) estimator whenever LS estimator variance is greater than the true ARMA coefficient; this can be the case in situations having a low number of observation samples, true coefficients of low amplitude, or low signal-to-noise ratio (SNR). Comparison with CM: As previously mentioned, CM are based on the assumption that a good model produces residuals, regardless of past data. They also seek the minimization of the cross-correlation between a function of the residuals and a transformation of the data. The open issue in this setting is how to find both the residual function and the data transformation. In order to relate SVM-ARMA algorithm with CM, we start from the case , , and (quadratic loss only), which again leads to Lagrange multipliers that are equal and to the residuals. In this case, prediction coefficients are sample estimates (except for a scaling factor) of the cross-correlation between the residuals and the data. Using (22) in (11) and (12), and since (33) (34) with
, the coefficients can be seen as (35) (36)
This emphasizes the fact that the SVM-ARMA solution leads to low correlation (in the given lags) between the residuals and the data. or (or both), then is a nonlinear If transformation of the residuals given by (22). In this case, the model coefficients are estimated from the cross-correlation of the transformed residuals and the data (37) (38) As long as we impose the minimum norm of the coefficients, the sample correlation between this nonlinear function of the residuals and the data is reduced. Taking into account (11) and
159
(12), one can see the relationship to the general CM equation [9]. Note that there is no data transformation, but instead, the residual nonlinear function is based on the statistical knowledge of the errors, which is incorporated into the free parameters of CFR. Finally, the comparison with CM suggests the possibility of a new algorithm by forcing the residuals to be uncorrelated with the data for more lags than and . This could be easily to be small or even zero achieved by forcing coefficients , . for IV. APPLICATION EXAMPLES In the applications that we will present here for the system identification SVM-ARMA algorithm, attention will be paid to some of its main features. First, a simulation example allows us to appreciate the performance when outliers are present. Second, a classical example (Feedback’s Process Trainer [9]) is used to compare SVM-ARMA with several system identification methods. Finally, a real-world example is reported (the relationship between simultaneous heart rate and diastolic blood pressure), where erroneous measurement values often appear. Two performance measurements are used: the error of the approximation to the true impulse response of the LTIS when it is known (example A) and the prediction error on a validation set when real data are analyzed (examples B and C). A. Insensitivity to Outliers The test system to be identified is
(39) This system is chosen because its impulse response has samples with amplitudes of different orders of magnitude. Input DTP is a white, Gaussian noise sequence of unit variance, . The corresponding which will be denoted output DTP is corrupted by an additive, small variance random , modeling the measurement errors. process . The This leads to an observed process benumber of observed samples is chosen to be low, cause SVM algorithms are expected to work well in low-sized data sets, mainly due to their strong regularization. Impulsive noise is generated as a sparse sequence, for which 30% of the samples, randomly placed, are of high-amplitude, [where denotes the uniform having the form distribution in the given interval]. The remaining are zero sam. The observations ples. This noise sequence is denoted by and the observed output plus impulconsist of DTP input . Values of go from 18 to sive noise, i.e., 0 dB. As insensitivity to outliers is expected to be reduced by the is used, and true orlinear zone of the empirical cost, ders for both numerator and denominator are introduced into the model. An extremely low value of leads to a higher emphasis on minimizing the losses so that overfitting can occur. . The appropriate Then, we select a moderately high choice of can be addressed by considering that according to (35) and (36), the solution is a function of Lagrange multipliers
160
IEEE TRANSACTIONS ON SIGNAL PROCESSING, VOL. 52, NO. 1, JANUARY 2004
Fig. 3. (a) Insensitivity of SVM-ARMA to outliers. Histogram of the residuals and control of the outlier impact on the solution by means of C . (b) MSD between true and estimated impulse response for SVM (continuous line) and ARX (dashed line) for different powers of impulsive noise (averaged for 100 realizations).
and data. Besides, (22) reveals that a high amplitude residual, corresponding to an outlier, will produce a high amplitude multiplier, which will distort the solution, but if the maximum value that the multiplier can take is properly limited by , the impact of the outlier on the solution is weakened. Fig. 3(a) shows that should be low enough to exclude residual amplitudes that are greater than a base level. In our case, we fix single value for all the simulations to be able to deal with high-amplitude and low-amplitude outliers. The merit figure chosen for comparison purposes is the mean squared deviation (MSD) between the ten first samples of the true and the estimated impulse response
MSD
(40)
Fig. 4. (a) Comparison between SVM (solid), ARX (dashed), and true (dotted) 0 dB. (b) Averaged squared deviation between the impulse responses for � true impulse response and SVM (solid) ARX (dashed) estimates for the example in (a).
=
where and are the true and the estimated impulse responses, respectively. Results are compared with the conventional LS algorithm (ARX model). Fig. 3(b) shows MSD for the true and the estimated impulse response for both SVM and ARX algorithms, averaged over 100 realizations. For ARX approach, MSD is very high for high values of impulsive noise power, whereas MSD of SVM remains around 22 dB. Fig. 4(a) shows a realization for 0 dB, between and Fig. 4(b) shows the squared deviation true and estimated impulse responses along the ten first samples for both ARX and SVM, averaged over 1000 realizations. B. Feedback’s Process Trainer Feedback’s Process Trainer, a classical example, is a variable heating-controller device governed by a binary voltage. The objective proposed in [9] is the identification of an LTIS relating the input (binary voltage) and the output (outlet air temperature).
ROJO-ÁLVAREZ et al.: SUPPORT VECTOR METHOD FOR ROBUST ARMA SYSTEM IDENTIFICATION
A delay of three samples is introduced in input DTP. As far as a previous study in [9]shows, this represents the best delay samples of both input and for modeling LTIS. First, output DTPs are used as training series in order to work with a low number of data, and the next 800 samples are used as the validation set. SVM-ARMA free parameters were fixed by the following procedure. Initially, 40 samples are used to build a model with a given set of free parameters, and 40 samples are used as a test set to evaluate the prediction error. Explored ranks are (logarithmic scale), , and , using 20 points for each parameter exploration. Once appropriate free parameters have been selected for a model, the whole 80-sample set is used to obtain the model coefficients. Comparison with several methods is reported: ARX, output error (OE), and Iv4. A variety of model with fixed , orders was explored, which are and with fixed . Fig. 5 shows the prediction error in the validation set of samples. Both OE and Iv4 provide poor models in terms of prediction error, whereas ARX and SVM-ARMA exhibit better performances. Besides, there is no significant difference between both methods, and in fact, the free parameters of SVM-ARMA , and ) lead to a cost that are found ( function that is very close to the ARX one. However, note that, , SVM-ARMA does not provide the best model. This for is due to a failure in the free parameter selection strategy. Fig. 6 shows the prediction error in the validation set in terms of the free parameters when 40 or 80 length sequences are used to train the model. We can see that the heuristic choice (usually ) is not the best one, due to the fact that very few samples are available, and in this case, it would lead to a loss of 5 dB in the prediction capabilities. As there are no outliers, is appropriate. In addition, is the best value for both training data sets, and a different value could lead to severe losses. Therefore, we may conclude that SVM-ARMA provides as good results in this example as the best method (ARX). However, special care must be taken with the free parameter selection strategy, and more sophisticated approaches than those used here should be developed. Finally, we should note that QP optimization presents some numerical problems in this case because the low value of is comparable with the order of magnitude of algorithmic tolerances. Its careful control increases the required time for convergence. This effect could be avoided by using weighted LS to train SVMs, as proposed in [22]. C. Heart Rate and Systolic Blood Pressure The control of the cardiovascular system by the autonomous nervous system can be studied from its effect on the cardiac rhythm [which causes the so-called heart rate variability (HRV)] and from its effect on the diastolic blood pressure (DBP). In this setting, system identification techniques have been used to model the relationship between HRV and DBP [4]. However, a very common problem of the HRV signal is the presence of anomalous data, which can be due to missing sinusal (normal)
161
Fig. 5. Results for Feedback’s Process Trainer example. (a) Validation prediction error for Q 6 and P 2 (1; 10). (b) Validation prediction error for P = 5 and Q 2 (1; 10).
=
beats, ectopic (nonsinusal originated) cardiac beats, or noncardiac artifacts. The manual detection of these beats is a time-consuming task, and a robust analysis method is very desirable. SVM-ARMA system identification properties make this algorithm a useful approach for this application. Fig. 7 shows two simultaneous HRV and DBP signals. The aim consists of obtaining an ARMA model where DBP and HRV are considered its input and output, respectively. The training, test, and validation samples are indicated in this figure. In brief, the training samples of HRV contain a significant number (over 15%) of anomalous measurements, with either too-high or too-low amplitudes, due to electrocardiographic acquisition failure during some time intervals. A comparison like that in the preceding example is shown in Fig. 8, where different model orders and system identification procedures are shown as a function of the prediction error in the validation set. SVM-ARMA clearly outperforms ARX and Iv4, and it provides almost the same performance for all the presented model orders.
162
IEEE TRANSACTIONS ON SIGNAL PROCESSING, VOL. 52, NO. 1, JANUARY 2004
Fig. 6. Free parameter selection for Feedback’s Process Trainer. Prediction error in the validation set by using 40 (left) and 80 (right) training samples.
V. CONCLUSION
Fig. 7. Signals of blood pressure (up) and heart rate (down) used as training, test, and validation sets for the example in C.
However, we must point out that the OE method reaches a better model than all the other methods, though only occasionally. The reason is that this method gives an output estimate that is better than the extremely noisy observations. This suggests the possibility of an algorithm that can exhibit the advantages of both SVM-ARMA and OE models by using auxiliary variables representing LTIS output and including additional constrains relating the output model and the observations.
A new approach to estimate ARMA models based on SVM has been introduced. The corresponding algorithm has been formulated, and a statistical interpretation of this SVM-ARMA has been presented. Theoretically, the SVM-ARMA algorithm allows the reduction of residual and data cross-correlation. Simulation and application examples have been used to test the method and to compare it with classical algorithms for ARMA identification, showing that insensitivity to outliers can be achieved by an appropriate choice of the free parameters of SVM-ARMA algorithm. The application of more efficient and adaptive SVM training schemes [22], [23], as well as the extension of this approach to other signal processing problems, are obvious research lines. Using nonlinear kernels, which allows us to obtain a transformation of the input and the output state, is also an interesting possibility that will lead to robust, nonlinear system identification procedures. APPENDIX A REGULARIZED COST FUNCTION Our objective is to find the dual problem of the minimization of (21) under constrains (5)–(7). The primal-dual functional is
ROJO-ÁLVAREZ et al.: SUPPORT VECTOR METHOD FOR ROBUST ARMA SYSTEM IDENTIFICATION
163
with respect to the primal By zeroing the derivative of variables, we obtain the expression for the prediction coefficients as a function of Lagrange multipliers. However, a difference appears when calculating the derivatives with respect to with , for which (43)
and, necessarily,
It is clear that
, so that (44)
and denoting by
the constant value (45)
it is easy to see that (46) is given by (19). This reveals that both functions where reach the minimum at the same values of Lagrange multipliers. APPENDIX B RESIDUALS AND LAGRANGE COEFFICIENTS
Fig. 8. Results for the heart rate and blood pressure example. (a) Validation prediction error for Q 5 and P 2 (1; 20). (b) Validation prediction error for P = 5 and Q 2 (1; 10).
=
The analytical relationship presented in (22) must be separately shown for three different cases, according to the different KKT conditions for each one. Case 1) For , we find that and . In the solution, the values reached by the primal and the dual functional are equal. Therefore, taking into account (11) and (12), the following equation holds:
(47) Derivatives of the constraints corresponding to vanish at the solution. Thus, using the chain rule, we obtain, by zeroing the derivative of (47) (48) and hence (49)
(41) constrained to (42)
The derivation is similar for just considering that, in this case, .
, , and
164
IEEE TRANSACTIONS ON SIGNAL PROCESSING, VOL. 52, NO. 1, JANUARY 2004
Case 2) When , it is straightforward to see that vanish. corresponding , the Lagrange multiplier direction Case 3) When cannot be greater than , and hence, . Sim. ilar considerations can be made for
REFERENCES [1] N. D. Sidiropoulos and G. Z. Dimic, “Blind multiuser detection in W-CDMA systems with large delay spread,” in IEEE Signal Processing Lett., vol. 8, Mar. 2001, pp. 87–89. [2] S. Haykin and A. Steinhart, Adaptive Radar Detection and Estimation. New York: Wiley, 1992. [3] S. de Waele and P. M. T. Broersen, “Modeling radar data with time series models,” in Proc. EUSIPCO, Tampere, Finland, Sept. 2000, Ref. 116. [4] Task force of the European Society of Cardiology and the North American Society of Pacing and Electrophysiology, “Heart rate variability. Standards of measurement, physiological interpretation and clinical use,” Eur. Heart J., vol. 17, pp. 354–381, Mar. 1996. [5] C. Vlachopoulos and M. O’Rourke, “Genesis of normal and abnormal arterial pulse,” Current Prob. Cardiol., vol. 25, pp. 297–368, 2000. [6] J. D. Bronzino, The Biomedical Engineering Hadbook. Boca Raton, FL: CRC/IEEE, 1995. [7] K. R. Müller et al., “Predicting time series with support vector machines,” in Advances in Kernel Methods—Support Vector Learning, B. Scholkopf et al., Eds. Cambridge, MA: MIT Press, 1999, pp. 243–254. [8] S. Mukherjee, E. Osuna, and F. Girosi, “Nonlinear prediction of chaotic time series using support vector machines,” in Proc. IEEE NNSP, Amelia Island, FL, Sept. 1997, pp. 511–519. [9] L. Ljung, System Identification. Theory for the User, 2nd ed. Englewood Cliffs, NJ: Prentice-Hall, 1999. [10] T. C. Hsia, Identification: Least Squares Methods. Lexington, MA: Lexington Books, 1977. [11] T. Söderström and P. Stoica, System Identification. Englewood Cliffs, NJ: Prentice-Hall, 1987. [12] J. Li, K. Miyashita, T. Kato, and S. Miyazaki, “GPS time series modeling by autoregressive moving average method: Application to the crustal deformation in central Japan,” Earth Planets Space, vol. 52, pp. 155–162, Feb. 2000. [13] V. Vapnik, The Nature of Statistical Learning Theory. New York: Springer-Verlag, 1995. [14] B. Schölkopf and K. Sung, “Comparing support vector machines with Gaussian kernels to radial basis function classifiers,” IEEE Trans. Signal Processing, vol. 45, pp. 2758–2765, Nov. 1997. [15] M. Pontil and A. Verri, “Support vector machines for 3D object recognition,” IEEE Trans. Pattern Anal. Machine Intell., vol. 20, pp. 637–646, June 1998. [16] C. J. C. Burges, “A tutorial on support vector machines for pattern recognition,” Data Mining Knowl. Discovery, vol. 2, pp. 1–32, Jan. 1998. [17] A. J. Smola and B. Schölkopf, “A tutorial on support vector regression,” ESPRIT, Neural and Computational Learning Theory NeuroCOLT2 NC2-TR-1998-030, 1998. [18] A. N. Tikhonov and V. Y. Arsenin, Solution to Ill-Posed Problems. Washington, DC: V.H. Winston, 1977. [19] D. G. Luenberger, Linear and Nonlinear Programming. Reading, MA: Addison-Wesley, 1984. [20] N. Cristianini and J. S. Taylor, An Introduction to Support Vector Machines and Other Kernel-Based Learning Methods. Cambridge, U.K.: Cambridge Univ. Press, 2000. [21] P. J. Huber, “Robust statistics: A review,” Ann. Stat., vol. 43, pp. 1041–67, 1972. [22] A. Navia-Vázquez, F. Pérez-Cruz, A. Artés-Rodríguez, and A. R. Figueiras-Vidal, “Weighted least squares training of support vector classifiers leading to compact and adaptive schemes,” IEEE Trans. Neural Networks, vol. 12, pp. 1047–1059, Sept. 2001. [23] F. Pérez-Cruz, A. Navia-Vázquez, P. L. Alarcón-Diana, and A. ArtésRodríguez, “An IRWLS procedure for SVR,” in Proc. EUSIPCO, Tampere, Finland, Sept. 2000, Ref. 156.
José Luis Rojo-Álvarez (M’01) received the telecom engineer degree from University of Vigo, Vigo, Spain, in 1996 and the Ph.D. degree in telecommunication from the Polytechnical University of Madrid, Madrid, Spain, in 2000. He is an Assistant Professor with the Department of Signal Theory and Communications, University Carlos III, Madrid. His main research interests include statistical learning theory, digital signal processing, and complex system modeling, with applications both to digital communications and to cardiac signal processing. He has published work on cardiac arrhythmia and arrhythmia-genesis mechanisms, robust analysis, and echocardiographic image and hemodynamic function evaluation.
Manel Martínez-Ramón (M’00) received the telecom engineer degree from Politechnical University of Catalunya, Barcelona, Spain, in 1994 and the Ph.D. degree in telecommunication from the University Carlos III, Madrid, Spain, in 1999. He is a Visitant Professor with the Department of Signal Theory and Communications, University Carlos III. His main research interests include statistical learning theory, digital signal processing, and communications, with applications to digital communications, areas of research on he has published several works.
Mario de Prado-Cumplido (S’02) was born in Madrid, Spain, on December 1977. He received the M.Sc. degree in telecommunication engineering from the Universidad Politécnica de Madrid in 2000. He is currently pursuing the Ph.D. degree at Universidad Carlos III, Madrid, where he is doing research on machine learning algorithms, feature selection, and probability density estimation techniques and their application to biomedical problems, with particular attention to cardiovascular pathologies.
Antonio Artés-Rodríguez (M’89–SM’01) was born in Alhama de Almería, Spain, in 1963. He received the Ingeniero de Telecomunicación and Doctor Ingeniero de Telecomunicación degrees, both from the Universidad Politécnica de Madrid, Spain, in 1988 and 1992, respectively. He is now a Professor with the Departamento de Teoría de la Señal y Comunicaciones, Universidad Carlos III, Madrid. His research interests include detection, estimation, and statistical learning methods and their application to signal processing and communication.
Aníbal R. Figueiras-Vidal (S’74–M’76–SM’84) received the Telecom. Engineer degree from Universidad Politécnica de Madrid, Madrid, Spain, in 1973 (ranked number 1; National Award to graduation) and the Doctor degree (Honors) from Universidad Politécnica de Barcelona, Barcelona, Spain, in 1976. He is a Professor of signal theory and communications with Universidad Carlos III, Madrid. His research interests are digital signal processing, digital communications, neural networks, and learning theory. He has (co)authored more than 300 journal and conference papers in these areas. Dr. Figueiras received an “Honoris Causa” Doctorate degree in 1999 from Universidad de Vigo, Vigo, Spain. He is currently General Secretary of the Academy of Engineering of Spain.