A sensor based approach to understand spatial variability in orchards Jana Beerbaum, Jörn Selbeck, Robin Gebbers, Yousef Rezaei, and Manuela Zude Department for Horticultural Engineering Leibniz Institute for Agricultural Engineering Potsdam-Bornim (ATB) Max-Eyth-Allee 100 14469 Potsdam
[email protected]
Abstract: Input requirements in an orchard vary in space and time due to the variability of climate, soil and plant growth. Measurements were carried out in Prunus domestica (plum) orchard in the Werder fruit production area in Brandenburg, Germany. Soil zones in the orchard were identified by means of electrical conductivity. Plant data were captured on the tree and organ level: laser-scanner hits show highest values for trees with enhanced canopy size and, consequently, a high leaf area ratio (LAR). Aiming at fruit characterization, indices of the chlorophyll content (normalized difference vegetation index, NDVI) and the visual appearance were considered. The sensor data provide a better insight in the spatially-resolved capacity of tree growth based on the LAR ratio as well as fruit NDVI and quality. Advanced sensors and automated data mining will be further developed and evaluated in the framework of the project 3D-Mosaic (ICTAGRI ERA-Net, European program FP7).
1. Introduction Spatial patterns of soil and plant properties can be regarded as a 3D-Mosaic. Zaman and Schumann [ZS06], Nadler [Na04], Gebbers and Zude [GZ08], and Bramley and Hamilton [BH04] observed high variability in soils and orchard trees. They stated that soil properties can be related to plant growth and fruit quality. Nadler [Na04] used a portable electrical conductivity meter to assess variation of water in the soil and the tree stems. Bramley and Hamilton [BH04] identified yield zones in vineyards. Zude and co-workers [ZK09], [ZPKA08] analysed spatial pattern of the fruit quality in citrus. Gebbers and Zude [GZ08] analysed spatio-temporal variations of fruit quality in apples as related to soil quality. Due to the high spatial variability in orchards, monitoring of the plants requires cost efficient, in-situ sensors. Standard laboratory methods are usually too expensive or time consuming to provide information with reasonable space-time resolution. Depending on the parameter under consideration and the financial efforts, sensors need to be stationary or mobile. This work reports first result of high-resolution sensing approach applied for
monitoring of plum trees. The objective is to point out the potential of site-specific crop management considering sensors that became recently available or are in the process of commercialisation. Research has been carried out in the framework of the 3D-Mosaic Project (FP7, ICT-AGRI, 2810ERA095), targeting automated acquisition of the spatiotemporal variation of soil and plant parameters.
2. Data 2.1 Material and methods The plum (Prunus domestica) orchard under investigation is located in the Werder fruit production area in Brandenburg, Germany [QJZ08], [Zu09]. It covers 25 meters by 120 meters and is located on a hillslope. The plantation was established in 2009 and consists of six rows summing up to 180 plum trees. Of these, 156 belong to the cultivar 'Tophit plus' used as productive trees and 24 trees belong to the cultivar 'Jojo' used as pollinators. In 2011 trees were four and five years old. Only the cultivar 'Tophit plus' was regarded for data analysis. Plant sensors used in the experiment include: a handheld spectrophotometer equipped with photodiode array capturing the range 400-1100 nm (Pigment Analyzer PA1101, CP, Germany), a portable colorimeter (Minolta CM-2600d/2500d, Konica Minolta, Japan) providing L*a*b* values [CP09], [KMS02], and a tractor-mounted laser-scanner (ALASCA XT, IBEO Automobile Sensor GmbH, Germany) measuring at 905 nm with 12.5 Hz frequency [DSE11]. Reflectance (hits) of the laser was recorded from a lateral position when passing the trees. Hits were attributed to individual trees during post processing. Additional plant data, collected manually, included trunk diameter, number of leaves and fruits, fresh mass of fruits. The growth rate from 2009 to 2011 of the tree circumferences was calculated from the measured tree circumferences 15 cm above the ground. Soil spatial variability was characterized by geoelectrical mapping of the apparent electrical resistivity of the ground using a 4-point light instrument (LGM, Germany). The electrode spacing was set to 0.5 m in a Wenner array so that about 50 % of the signal comes from a depth of 25 cm. Resistivity readings were converted to conductivity given as mS/m [GL06]. 2.2 Results and discussion Soil and plant properties showed high variability. Soil electrical conductivity varied from 2.0 to 13.1 mS/m. These readings were used to divide the orchard in three soil zones: 2.0 to 6.2 mS/m, 6.2 to 9.5 mS/m, and 9.5 to 13.1 mS/m. Based on the zones, the plant data of 'Tophit plus' were analysed (data not shown). Plant related data from sensors and from manual measurements were grouped in 10 classes to obtain histograms (figure 1).
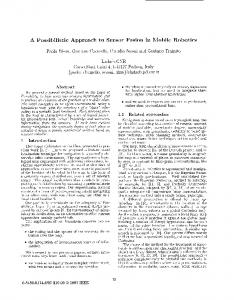
Data from the laser-scanner hits (figure 1a) required post-processing to remove hits from ground, other trees and the irrigation-system (50 cm above the ground). Frequency distribution of laser hits show similar pattern compared to manually recorded data on the tree growth (figures 1b, c). The laser-scanner can be used to determine the growth capacity of the trees by means of the LAR. The NDVI, obtained from fruit reading, is related to the fruit chlorophyll content (figure 1d). By means of the chlorophyll degradation the fruit development and harvest maturity may be derived, while the b* value in the L*a*b* colour space represents a quality index considering the visual appearance of plum (figure 1e). The frequency distribution of the NDVI data shows a high variability in plum maturity. Such results indicate the need for selective harvesting over time and, possibly, the need for site-specific harvesting considering different zones within the orchard [ZPKA08]. Similarly, the fruit quality data (figure 1f) showed an enhanced range of variation pointing to the need of in depth spatially resolved analyses to understand and manage the variability within and between canopies.
Figure1: Histograms of a) number of laser-scanner-hits per tree, b) number of leaves, c) growth of stem circumference within two years, d) NDVI-Index of fruits, e) b* values of fruits, and e) fruit fresh mass.
3. Conclusion and outlook The use of sensors to assess plant growth, spectral-optical fruit data, and geophysical soil parameters results in information on spatial variability without destructive intervention. The results underline the necessity of a more adapted orchard management in order to economize irrigation and to produce higher fruit quality. To achieve these goals, advanced sensors, automated data mining, and application of adapted models will be further investigated in the framework of the project 3D-Mosaic (ICTAGRI ERA-Net, European program FP7).
References [BH04] Bramley R.G.V.; Hamilton R.P.: Understanding variability in winegrape production systems 1. Within vineyard variation in yield over several vintages, Australian Journal of Grape and Wine Research 10, 2004, 32–45. [CP09] Control in applied Physiology: Pigment Analyzer Manual, Control in applied Physiology (CP), Falkensee, Germany, 2009. [DSE11] Dworak V.; Selbeck J.; Ehlert D.: Ranging sensors for vehicle-based measurement of crop stand and orchard parameters: a review. Transactions of the ASABE 54 (4), 2011, 1497-1510 [GL06] Gebbers R.; Lück E.: Geoelektrische Methoden zur Bodenkartierung in der Landwirtschaft. In: Hufnagel J., Herbst R., Jarfe A., Werner A. (Hrsg.) Precision Farming. Analyse, Planung, Umsetzung in die Praxis. KTBL-Schrift 419. Kuratorium für Technik und Bauwesen in der Landwirtschaft e.V. (KTBL): Darmstadt, 2006 [GZ08] Gebbers R.; Zude M.: Spatial distribution of drought stress and quality related apple fruit monitoring on tree, Proceedings CIGR - International Conference of Agricultural Engineering XXXVII Congresso Brasileiro de Engenharia Agrícola, 2008 [KMS02] Minolta: User’s manual, Spectrophotometer CM-2600d/2500d. Konica Minolta Sensing (KMS), INC., AFMAGA (1), Japan, 2002 [Na04] Nadler A.: Relations between Soil and Tree Stem Water Content and Bulk Electrical Conductivity under Salinizing Irrigation, Soil Sci. Soc. Am. J. 68, 2006, 779–783 [QJZ08] Qing Z. S.; Ji B. P.; Zude M.: Non-destructive analyses of apple quality parameters by means of laser-induced light backscattering imaging. Postharvest Biology and Technology 48, 2008, 215–222 [ZK09] Zude M.; Kläring P.: Two case studies of precision horticulture approaches in the citrus production. Tree and Forestry Science and Biotechnology 3, 2009, 139-151 [ZPKA08]Zude M.; Pflanz M.; Kaprielian C.; Aivazian B.L.: NIRS as a tool for precision horticulture in the citrus industry. Journal Biosystems Engineering 99 (3), 2008, 455-459 [ZS06] Zaman Q.U.; Schumann A.W.: Nutrient management zones for citrus based on variation in soil properties and tree performance. Precision Agric 7, 2006, 45–63 [Zu09] Zude M. (ed): Optical Monitoring of Fresh and Processed Agricultural Crops. CRC Press, 450 pp., 2009