[14] V. Chudacek, L. Zach, J. Kuzilek, J. Spilka, and L. LhotskA, âSim- ple scoring ... 1, 2009. [16] S. J. Redmond, N. H. Lovell, J. Basilakis, and B. G. Celler, âECG.
2015 2nd International Conference on Signal Processing and Integrated Networks (SPIN)
A Simple Method for Detection and Classification of ECG Noises for Wearable ECG Monitoring Devices Udit Satija, Barathram.Ramkumar and M. Sabarimalai Manikandan
$PS� $PS�
� � � í�
�D
� � � � í� � �
�
�
�
�
�
�
�
�
�
��
�E �
�
�
�
�
�
�
�
�
�
��
�F
í� �
�
�
�
�
�
�
�
�
�
��
$PS�
� �
�G
í� �
�
�
�
�
�
�
�
�
�
��
� $PS�
Abstract—An assessment of electrocardiogram (ECG) signal quality has become an unavoidable first step in most holter and ambulatory ECG signal analysis applications. In this paper, we present a simple method for automatically detection and classification of ECG noises. The proposed method consists of four major steps: moving average filter, blocking, feature extraction, and multistage decision-tree algorithm. In the proposed method, the dynamic amplitude range and autocorrelation maximum peak features are extracted for each block. In the first decision stage, a amplitude-dependent decision rule is used for detecting the presence of low-frequency (LF) noise (including, baseline wander (BW) and abrupt change (ABC) artifacts) and the high-frequency (HF) noise (including, power line interference (PLI) and muscle artifacts). In the second decision stage, the proposed method further classifies the LF noise into a BW noise or a ABC noise using the local dynamic amplitude range feature. The HF noise is classified into a PLI noise or a muscle noise using the local autocorrelation maximum peak feature. The proposed detection and classification method is tested and validated using a wide variety of clean and noisy ECG signals. Results show that the method can achieve an average sensitivity (Se) of 97.88%, positive productivity (+P) of 91.18% and accuracy of 89.06%.
$PS�
School of Electrical Sciences, Indian Institute of Technology Bhubaneswar Bhubaneswar, Odisha-751013, India. Email:{us11,barathram,msm}@iitbbs.ac.in
�H
� í� �
�
�
�
�
�
�
�
�
�
��
I NTRODUCTION
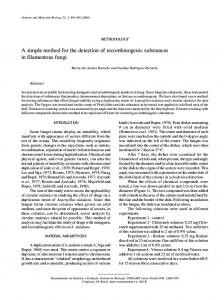
Recently, wearable cardiac health care monitoring devices enable continuous recording of ECG signals, and early detection and treatment of cardiovascular diseases [1], [2]. Generally, the amplitudes of a normal ECG range from 10 μV to 5 mV and the frequency lies in the range of 0.05-150 Hz [3]. The ECG recordings are generally corrupted by noises, namely, baseline wander (BW), power line interference (PLI), muscle artifact (MA) and instrumentation noise. Furthermore, the motion artifacts is ubiquitous in ECG monitoring using wireless body area networks (WBANs). From the corrupted ECG signals as shown in Fig. 1, it can be noted that the presence of BW, PLI and muscle noises causes inaccurate determination of ECG characteristic points, feature determination, heartbeat segmentation, etc. Thus, assessment of ECG signal quality has become an unavoidable first step in most holter and ambulatory ECG signal analysis applications including cardiac arrhythmias recognition, heart rate variability (HRV) analysis, ECG-based biometric, continuous beat-to-beat blood pressure measurement, sleep apnea detection, and so on. Furthermore, signal quality assessment not only plays an important role in improving diagnostic accuracy of cardiovascular diseases diagnostic systems but also plays in selecting suitable ECG signal enhancement techniques. In addition, wearable ECG monitoring devices hold the promise of continuous recording and early detection of cardiac disease events, but wearable 978-1-4799-5991-4/15/$31.00 ©2015 IEEE
164
�I
� í� �
�
�
�
�
�
�
�
�
�
��
� $PS�
I.
$PS�
�
�J
� í�
�
�
�
�
�
�
�
�
�
�
��
7LPH��V Fig. 1. Illustrates ECG signals corrupted by different types of artifacts and noise: (a) and (b) ECG corrupted with baseline wanders, (c) and (d) ECG corrupted with abrupt changing artifacts, (e) and (f) ECG corrupted with muscle artifacts, and (g) ECG corrupted with PLI noise.
devices have limited power and battery life, limited computational power and main memory. Thus, wearable devices demand energy-efficient reliable ECG noise detection and classification for choosing suitable noise removal technique and guaranteeing clinical acceptability of ECG recordings. A. Review of ECG Signal Quality Assessment Methods Many signal quality assessment (SQA) methods have been reported based on statistical features such as mean, standard deviation, kurtosis and heuristic rules. In [4], Orphanidou, et al. presented signal quality indices for ECG and PPG
2015 2nd International Conference on Signal Processing and Integrated Networks (SPIN)
signals using heuristic rules on the extracted features from the QRS or pulse portions and RR intervals, the ratio of maximum to minimum RR interval, and template matching. In [5], SQA method using an artificially reconstructed target lead is presented based on the removal of LF and HF noise, energy-concavity index (ECI) analysis, and a correlationbased examination subroutine calculated between ECG leads estimated by a suitably trained neural network. In [6], L. Johannesen and L. Galeotti presented automatic ECG quality scoring methodology. The method identifies ECG signals with macroscopic errors and subsequently quantifies BW, PLI or muscular noise based on the missing leads, QRS detection, segmentation and erroneous QRS detection. In [7], D. Hayn et al. presented QRS detection based ECG quality assessment based on the empty lead criterion, spike detection criterion, lead crossing point criterion and robustness of QRS detection. In [8], signal quality indices (SQIs) and data fusion methods were presented for determining clinical acceptability of ECGs. The method consists of spectral energy distribution, higher order moments and inter-channel and inter-algorithm agreement, multi-layer perceptron (MLP) artificial neural network and support vector machine (SVM). In [9], automatic motion and noise artifact detection was presented using empirical mode decomposition (EMD) and statistical approaches. In [10], Hayn et al. presented ECG quality assessment for patient empowerment in m-Health applications. The method is based on basic signal properties (amplitude, spikes, constant signal portions), number of crossing points in between different leads, and QRS amplitude vs. noise-amplitude ratio. In [11], B. E. Moody presented rule-based methods for ECG quality control. In [12], assessment of ECG quality on an android platform was performed based on the lead-fail in all leads, global high frequency noise, leads with noise causing QRS detection problems, global low frequency noise and low and high frequency noise in the beats of sinus origin. Liu et al. presented real-time signal quality assessment for ECGs collected using mobile phones [13]. The method is based on the four flags: misplaced electrode, huge impulse, strong Gaussian noise, error of R-wave peaks by the template matching. Based on the values of four flags, single signal quality index (SSQI) and integrative signal quality index (ISQI) were computed for single lead ECG and twelve-lead ECGs, respectively. In [14], simple scoring system for ECG quality assessment on android platform. In [15], a new ABP signal quality index (SQI) was presented for measuring morphological normality and degradation due to noise. Most existing SQA methods were validated using datasets available in Physionet/Computing in Cardiology Challenge 2011 (PICC2011) [18]. B. Limitations of Existing SQA Methods Many QRS detection based SQA methods were proposed by analyzing the detected R-R intervals from the input ECG signal. The detection of exact R-R interval (or heart rate) is severely affected in the cases of clean ECG signal with (i) wide QRS complexes, (ii) low-amplitude QRS complexes, (iii) negative QRS polarities, (iv) sudden changes in RR intervals, (v) sudden changes in QRS amplitudes, (vi) sudden changes in QRS morphologies, and (vii) sharp P- and Twaves [22],[23]. Under this scenarios, the existing heart rate ECG signal quality assessment methods demand accurate detection of time-instants of R-peaks present in the ECG signal. 165
Most methods use traditional R-peak detection (or waveform delineation) algorithm, which had poor detection rates in case of ECG signals. Furthermore, most detection methods include sets of amplitude-dependent, duration-dependent and interval-dependent thresholds for to detect R-peaks, and to reject or include noise and missed R-peaks. The searchback algorithm with two rules with adaptive amplitude-dependent and time-dependent thresholds were widely adopted to reject or include identified R-peaks located at tm and tn : i) if tn − tm < 0.2 s (refractory period) and ii) search back if tn − tm > 1.5RRavg . These rules may improve detections for regular rhythms but some rules may be in conflict with others. Furthermore, searchback mechanism cannot be halted in case of irregular rhythms with varying QRS complexes. Moreover, there are often lots of thresholds defined in heuristic rules [22]. In most approaches, the detection thresholds were adapted based on past detected R-peaks. In such a case, detection performance highly depends on the accurate estimation of initial thresholds at the learning phase. In EMD based methods, local waves of ECG signal and noises are distributed over a number of intrinsic mode functions (IMFs). Under this scenario, it is difficult to determine the noisy IMFs from the signal IMFs. Although the frequency range of each wavelet subband is known, the wavelet coefficients of BW, PLI, and MA noises and ECG signal are spread over detail and approximation subbands. Thus, noise subband characterization can be difficult under time-varying PQRST morphologies and noise characteristics. However, we cannot fix the wavelet filter, number of decomposition level and characteristic subbands. Thus, developing low-complexity automated ECG signal quality assessment method is still a challenging research problem. C. Contribution of this Paper In this paper, we present a simple straightforward ECG noise detection and classification method. The proposed method consists of four major stages: moving average filtering, blocking, feature extraction, and multi-stage decision classification. In the proposed method, the features such as global and local dynamic amplitudes and autocorrelation maximum peak are extracted in this work. Based on these features, the multi-stage decision stage is constructed automatic detection and classification of ECG noises. Experimental results show that the method achieves an acceptable classification accuracy on different types of clean and noisy ECG signals. The rest of this paper is organized as follows. The proposed ECG noise detection and classification method is described in Section II. In Section III, the performance of the proposed method is tested and validated using a wide variety of clean and noisy ECG signals. Finally, conclusions are drawn in Section IV. II.
P ROPOSED ECG N OISE D ETECTION AND C LASSIFICATION M ETHOD
In this Section, we present a simple straightforward method for automatically detection and classification of ECG noises. The proposed method consists of four major stages: signal suppression and noise enhancement, feature extraction, amplitude-dependent detection and decision-tree based noise classification.
2015 2nd International Conference on Signal Processing and Integrated Networks (SPIN)
1 � x[n − k] u[n] = L+1 L
(1)
� �
$PS�
�
1 � x[n − k] v1 [n] = L+1
�
�
�
�
� 7LPH��V
�
�
�
�
��
� �E
� í� �
�
�
�
�
� 7LPH��V
�
�
�
��
γ
�
�
��
��
�� �� �� %ORFN�1XPEHU
��
��
���
$PS�
�
���� ��� ���� ��� ����
k=0
where L denotes the moving average filter length. In this work, the filter length is chosen such that it can adequately capture the BW noise below 0.5 Hz. The high-frequency (HF) noise including the PLI, muscle artifacts and recording instrument noise from the input ECG signal is extracted using the difference equation as
�D
í�
$PS�
In this work, the proposed method implements a moving average filter for obtaining the low-frequency (LF) component part including the BW noises and the high-frequency (HF) component part including the PLI, muscle artifacts and recording instrument noise. In this work, the filtering step process the 10 s ECG signal x[n]. For extracting the baseline wander noise (or low-frequency (LF) artifacts) from the input ECG signal, the moving average filter is implemented as
$PS�
A. ECG Signal Suppression and Noise Enhancement
��
�F
��
δ �G
� �� �
�
�
�
�
� 7LPH��V
�
�
�
�
��
L
(2)
k=0
v[n] = x[n] − v1 [n],
n = 0, 1, 2......, N − 1.
(3)
The filter length for the moving average filter II is chosen such that it can adequately capture the ECG signal below 40 Hz. In order to avoid phase lags, the filtering operation is implemented using zero-phase filtering process with filter coefficients bk = 1, k = 0, 1, 2, 3, .....L − 1. Then, the noise signal features are extracted from both LF component and HF component parts for detecting the presence of BW, PLI, muscle artifacts and recording instrument noises. The output waveforms as shown in Fig. 2 (b) and (d) show the LF component and HF component parts obtained for the ECG signal corrupted with BW noise. B. Feature Extraction Stage
n = 1, 2, · · · P
(4)
�N P�
where k = 0, 1 · · · M − 1, M = and P denotes the size of the window. For each processing window, the maximum and minimum values are computed for discriminating the background noise level which can mask the low-amplitude local waves of the PQRST morphologies. In this work, the maximum and minimum amplitude values of each window are computed as amax [k] = max{uk [n]} k = 0, 1 · · · M − 1 amin [k] = min{uk [n]} k = 0, 1 · · · M − 1
(5)
For detecting the presence of BW noises, the dynamic amplitude range of each window is compared with the predefined amplitude threshold. The dynamic amplitude range is computed as adr [k] = amax [k] − amin [k]
The output waveforms of each step of the feature extraction stage are shown in Fig. 2. The LF component part in Fig. 2(b) contains the BW noise with larger amplitude variation. In order to discriminate the BW noise from the abrupt change artifacts, the local dynamic amplitude range is estimated for each window. The output of the dynamic amplitude range estimator for the LF component part is shown in Fig. 2 (c). By implementing the amplitude thresholding rule with a predefined threshold γ1 , adr [k] > γ1 , the BW noise event is distinguished from the abrupt change artifacts by determining low-magnitude frame ratio. TABLE I.
The feature extraction stage is implemented based on the following steps: non-overlapping blocking and feature computation. In the blocking process, the filtered signal is divided into non-overlapping blocks with block duration of 200 ms. In this work, the kth block uk (n) of u(n) is obtained as uk [n] = u[Pk + n]
Fig. 2. Illustrates the feature signals obtained for the ECG signal with BW noise. (a) Corrupted ECG signal, (b) Extracted LF component part including BW noise, (c) dynamic amplitude range estimates, and (d) high-frequency (HF) component part.
k = 0, 1, 2 · · · M − 1
(6) 166
ECG
ECG Waves P wave QRS complex T wave U wave
LOCAL WAVES AND THEIR CHARACTERISTIC PARAMETERS [19], [20]
Amplitude Range 0.1-0.2 mV 0.5 − 1.0 mV ≈ 0.5 mV 1 − 2 mm or 25 % of T wave height
Duration 100 ms 80 − 100 ms 150 − 200 ms -
For detecting the presence of HF noise components such as PLI and muscle noises, the HF component part v(n) is obtained using equation (3). The order of the filter is chosen such that the 50/60 Hz PLI and muscle noises are captured in the HF component part. For a test ECG signal corrupted with BW noise, the extracted HF component part is shown in Fig. 2(d). It is observed that the HF component not only contains low-amplitude high-frequency background noise but also includes components of QRS complexes. In this work, the influence of the high-frequency noises is first detected by comparing the estimated maximum value of the absolute of HF component with a predefined amplitude threshold δ, which is found based on the amplitudes of local waves of the ECG signal as shown in Table I. Based upon the amplitudes of local waves, the amplitude threshold δ is chosen. The low-amplitude PLI and muscle noises may be removed by
2015 2nd International Conference on Signal Processing and Integrated Networks (SPIN)
�
$PS�
$PS�
� �D
� í� �
�
�
�
�
� 7LPH��V
�
�
�
�
��
�
�
�
�
� 7LPH��V
�
�
�
�
��
�
�
�
�
� 7LPH��V
�
�
�
�
��
�
$PS�
��� �E
$PS�
�D
� í� �
�
�
�E
í� � �
�
�
�
� 7LPH��V
�
����
����
�
�
�
��
$PS�
�� �
��� ���� ��� ����
γ ��
��
N
5Y
�
$PS�
5
Y
N
� �
��� ��
�� /DJ
��
�F
���
��
�� /DJ
��
� N
using a simple smoothing filter. The method assumes that the high-amplitude PLI and muscle noises can mask the fiducial points (onsets, offsets, peaks) of the medium amplitude local waves (including, P, q, T, and U). In this work, the acceptable background noise level is chosen such that the fiducial points can be preserved after applying noise removal techniques. The amplitude threshold δ of 0.02 mV is chosen. For detecting the presence of HF noise part, we estimate the total number of samples (NHF ) that are above the δ=0.02 mV. If the estimated NHF > 2 × Fs then the method labels the presence of HF noise part. Once the presence of the HF noise part is identified then the HF noise is further processed to classify the HF noise part into a PLI noise or a muscle noise. In the HF noise classification process, the HF component part is segmented into overlapping blocks with duration of 200 ms with block shift (Q) of 100 ms. The overlapping blocking process is implemented as vk [n] = v[
Pk + n] 2
n = 1, 2, · · · P
(7)
N �. In this work, where k = 0, 1 · · · M1 − 1 and M1 = � Q the autocorrelation features are used for discriminating the structured PLI noise from the muscle noise. In our previous work, the effectiveness of the autocorrelation function in determining the periodicity of the signal [24]. For each block vk [n], the autocorrelation sequence is computed as
Rk (τ ) =
P 1 � vk [n]vk [n + τ ] P n=0
(8)
where Rk (τ ) denotes the autocorrelation function (ACF) for vk [n] and τ denotes the autocorrelation lag. With reference to the first negative zerocrossing point, the global maximum of the autocorrelation function is estimated for each block. The results of the autocorrelation function are shown in Fig. 3 for visual inspection. The autocorrelation plots show that 167
1RUP��5Y
Fig. 3. Illustrates the existence of periodicity of the signal block obtained from the HF component part including the PLI noise. (a) ECG signal corrupted with PLI noise, (b) Extracted HF component including the PLI noise and high-frequency component of the QRS complexes in the ECG signal, (c) AC sequence obtained for block of samples taken from between first R-peak and second R-peak, and (d) AC sequence obtained for the eighth and ninth Rpeaks.
�� �� �� %ORFN�1XPEHU
��
��
��
�G �
�
�
�
�
� 7LPH��V
�
�
�
�
��
α
��� � �
��
δ
��� � ��
�G
�F
�
�H ��
�� �� %ORFN�1XPEHU
��
���
Fig. 4. Illustrates the feature signals obtained for the ECG signal with muscle artifacts. (a) Corrupted ECG signal, (b) Extracted LF component part including BW noise, (c) dynamic amplitude range estimates, (d) high-frequency (HF) component part and (e) ACF feature signal obtained using maximum peak value of the ACF function.
the existence of the structured PLI noise. The effectiveness of the ACF function is further evaluated using the ECG signals corrupted with muscle artifacts and PLI noise. The output waveforms of the autocorrelation feature extraction stage are shown in Figs. 4 and 5. For these two noisy ECG signals, the LF component parts show low-amplitude BW noise component which is less than the BW noise amplitude threshold γ1 . The HF component parts for the ECG signals corrupted with muscle artifacts and PLI noise are shown in Figs. 4(d) and 5(d), respectively. The ACF feature signals are shown in Figs. 4(e) and 5(e). From the ACF signal as shown in Fig. 4(e), it is noted that the most signal blocks have maximum peak value below 0.2. From this experiment, we notice that most blocks from the muscle artifact part have poor intra-block correlation. Meanwhile, the ACF result in Fig. 5(e) shows that most blocks have maximum peak value above 0.4. By selecting the suitable autocorrelation peak threshold, the HF component part is classified into a PLI noise and a muscle noise. A simplified multi-stage decision based noise detection and classification method is shown in Fig. 6. III.
R ESULTS AND D ISCUSSION
In this Section, we evaluate the performance of the proposed detection and classification method using a wide variety of ECG signals including different kinds of PQRST morphologies and various kinds of artifacts and noise including baseline wander (BW), abrupt change (ABC) artifacts, power line interference (PLI) and muscle artifacts. In this work, the first decision stage first detects the presence of the lowfrequency (LF) noise (including, baseline wander (BW) and abrupt change (ABC) artifacts) and the high-frequency (HF) noise (including, power line interference (PLI) and muscle artifacts). In the second decision stage, the LF component and HF component parts are further classified into any of the BW,
2015 2nd International Conference on Signal Processing and Integrated Networks (SPIN) TABLE II. Record
C OMPARISON BETWEEN GROUND TRUTH AND THE PROPOSED CLASSIFICATION METHOD FOR DIFFERENT ECG
Ground Truth Annotation Classification Results Clean BW ABC MN PL BW+PL BW+MN ABC+PL ABC+MN Clean BW ABC MN PL BW+PL BW+MN ABC+PL ABC+MN 9 66 21 5 23 1 25 0 0 8 62 25 6 20 4 24 1 0 2 74 9 0 4 14 43 2 2 3 85 15 0 2 10 34 0 1 4 68 23 0 26 0 29 0 0 8 70 25 3 20 5 15 1 3 6 74 16 15 23 1 15 0 0 4 71 20 21 21 5 8 0 0 3 41 7 5 5 10 73 0 6 2 34 5 8 3 8 81 0 9 6 66 18 0 24 2 34 0 0 9 61 15 1 28 3 32 0 1 19 55 13 15 18 6 21 0 3 17 51 15 15 20 8 23 0 1 18 111 8 0 5 8 0 0 0 20 108 11 4 4 3 0 0 0 4 23 18 1 4 11 86 0 3 1 15 14 9 3 10 91 1 6 11 72 19 16 17 1 14 0 0 14 75 17 14 14 1 15 0 0 4 77 7 6 7 15 33 0 1 2 82 10 8 3 11 34 0 0 86 727 159 63 156 69 373 2 15 88 714 172 89 138 68 357 3 21
100 101 102 103 104 105 106 107 108 109 111 Total
$PS�
�
/RDG�(&*�VLJQDO
� �
�
�
�
� 7LPH��V
�
�
�
�
�� 0RYLQJ�$YHUDJH�)LOWHU RI�RUGHU�0
�
$PS�
0RYLQJ�$YHUDJH�)LOWHU RI�RUGHU�1
�D
í� �
+)�1RLVH
�E
� í� �
�
�
�
�
� 7LPH��V
�
�
�
�
��
/)�1RLVH $PSOLWXGH 7KUHVKROGLQJ
���
$PS�
NOISE CASES .
����
�F
γ�
� �
��
��
�� �� �� %ORFN�1XPEHU
��
��
��
1R
��
$PSO����WKU�
$PS�
$PSO����WKU�
δ�
���
/RFDO�PHDQ �(VWLPDWLRQ
�G
�