Key words:Multi-product EPQ Multi deliveries Imperfect quality Service level constraint Lingo software Simulated annealing. INTRODUCTION production cycle of ...
World Applied Sciences Journal 16 (8): 1142-1157, 2012 ISSN 1818-4952 © IDOSI Publications, 2012
A Simulated Annealing Approach to Optimize Multi-Products EPQ Model with Discrete Delivery Orders, Imperfect Production Processes and Service Level Constraint 1
Hassan Farsijani, 2Mohsen Shafiei Nikabadi and 3Ashkan Ayough
Department of Industrial Management, Faculty of management & Accounting, Shahid Beheshti University, Tehran, Iran Department of Industrial Management, Faculty of Economic and Management, Semnan University, Semnan, Iran 3 Faculty of management & Accounting, Shahid Beheshti University, Tehran, Iran 1
Abstract: This study develops a supplier based Economic Production Quantity model as a multi-products EPQ model with discrete delivery orders and constrained space, with assuming imperfect quality of supplier production process and permitted shortage and Reworks employed to repair defective products during the depletion of inventories through available machines in the factory. All parameters are deterministic too. To show the applicability of the model, some numerical examples presented and solved by LINGO optimization package. Since the problem modeled in the non-linear integer one, it is known as Combinatorial Optimization Problem (COP), so the simulated annealing algorithm developed to overcome the complexity of that and its computation time efficiency in comparison to LINGO is shown. Key words:Multi-product EPQ Multi deliveries software Simulated annealing
Imperfect quality
INTRODUCTION In production-inventory environments, the EPQ model is developed to determine the economic lot size of product to be produced. The fundamental assumption differs from what assumed in EOQ model is that, during a portion of each cycle the product is produced and utilized at different fixed rates simultaneously, so that the inventories accumulate continuously until the amount ordered is delivered to stock. Recently, more realistic EPQ models have been developed by researchers through considering the reallife situations. As Pasandideh and Niaki [1] deals with, one of the most important problems in the case of working with suppliers to provide raw materials, components and finished products are to determine the order quantity and the points to place orders. They integrated the replenishment assumption of EPQ and EOQ models so that a portion of each cycle time is considered as the
Service level constraint
Lingo
production cycle of purchased product that enters successively and replenished instantaneously with pre-determined batch sizes in a permitted intervals. One of the facts to extend the classic models is generation of defective products and process failures or deteriorations. The article presented by Salameh and Jaber [2] is known for incorporating imperfect quality items in EOQ and EPQ models. They assumed that a random percent of each batch received is defective and is extracted from system (no rework or repair is done). The possibility of repairing the defectives by employing reworks in many industries and also considering reworks as attempts to improve the level of quality as Chiu et al. [3] reported in their article, have caused researchers to enhance the EPQ model through addressing the employment of reworks. Hayek and Salameh [4] assumed that all of the defective items are repairable and derived an optimal operating policy for EPQ model under the effect of reworks done on imperfect quality items. According to
Corresponding Author: Hassan Farsijani, Department of Industrial Management, Faculty of Management & Accounting, Shahid Beheshti University, Tehran, Iran.
1142
World Appl. Sci. J., 16 (8): 1142-1157, 2012
Barron [5], Chiu et al. [3] presented an EPQ model with random defective rate, scrap, the reworking of repairable defective items and without backlogging. Jamal et al. [6] presented an EPQ model, in which rework is done by addressing two different operational policies. The first policy deals with rework of defective products being completed within the same cycle. The second policy deals with the rework of defective products being done after N cycles. Barron [5] also studied Jamal et al. [6]'s mentioned model and found the optimal solutions for both policies using algebraic derivations. Production process deterioration and machine breakdowns are considered by researchers as aspects of imperfect processes and constraints of productioninventory models. Chung [7] showed that the long-run average cost function per unit time for the case of exponential failure is uni-modal and it is neither convex nor concave. In his paper, he derived the better lower and upper bounds of the optimal lot sizes for EPQ model with stochastic machine breakdowns. Chiu et al. [3] presented a mix effect dealing with reworking and stochastic breakdowns as imperfection aspects in the EPQ model and concluded that the optimal run time falls within the range of bounds and it can be pinpointed by the use of the bisection method based on the intermediate value theorem. Liao et al. [8] presented an integrated maintenance and production programs in the EPQ model. They considered the impact of reworks and preventive maintenance policies to be taken regarding process deterioration and derived the optimal production run time. In their model, the failures are restored through imperfect maintenances so that the system returns to "incontrol" state and continues working. However, system failures are postponed to be fixed and repaired until performing perfect Koh et al. [9] presented the EPQ model assuming that a proportion of the used products are collected from customers to be recovered for reuse later. In this model, the constant rate demand is satisfied though ordering new products and recovering used ones regarded as perfect as new products. Konstantaras et al. [10]. Revised this model and presented the other analysis to find the optimal set up times for ordering and recovery processes. The innovation aspect of the paper is extending the model presented by Pasandideh and Niaki [1] through considering imperfect quality of supplier production processes and reworks employed in factory during the depletion portion of each cycle so that repaired parts are
as good as conforming ones. We assume that in a portion of each cycle due to finite service level of the system, backlogging is allowed. Also, we add other changes to the inventory graph of EPQ model based on what assumed for defining our problem, as well. All rates and parameters of model are deterministic. To show the applicability of the model, some numerical examples presented and solved by LINGO optimization package. Since the problem modeled in the non-linear integer one, it is known as combinatorial optimization problem (COP). Another innovation aspect is developing the simulated annealing (SA) algorithm to overcome the complexity of the model and compare quality of solutions and computation times obtained from LINGO with those of simulated annealing. Problem Definition: To define the problem, consider a production company that works with a supplier. The situation by which the company and the supplier interact with each other is defined as follows:
1143
The supplier produces all of the demanded products with known and constant rates. Although the products are delivered discretely, however the demand of each product in the company is known with a constant rate. The supplier sends the orders to the company by pallets. The company pays the transportation cost of each pallet. The company determines the capacity of each pallet and the number of shipments. The number of shipments of each order must be in a permissible interval determined by the company. The setup and holding costs are known. Shortages and delays are permitted based on finite service level determined for each of products and the specific one for the system. Defective products will be found by inspection at the fixed rate initiating instantly while the pallets receive. Defective parts will be maintained during the production cycle and all together will be repaired as soon as the last pallet being inspected. The holding cost rate for defective and conforming products is the same. Specific percent of defective products will be repaired and the remaining is supposed to be scraps and disposed with no cost.
World Appl. Sci. J., 16 (8): 1142-1157, 2012
Inspection of repaired products is done on-line. The replenishment of the system with repaired products is instantaneous; however, the rate of repair is constant for each product. The problem is to determine the order quantity, the pallet capacity, the shortage quantity in each cycle and the number of shipments for each product, so that the total cost of inventory is minimized while the constraints are satisfied. Problem Modeling: This paper is to extend the model presented by Pasandideh and Niaki [1] through considering imperfect quality of supplier production processes and reworks employed in factory during the depletion portion of each cycle so that repaired parts are as good as conforming ones. We assume that in a portion of each cycle due to finite service level of the system, backlogging is allowed. All rates and parameters of model are deterministic. Parameters and Notations: As the model includes multiple products, we define the following parameters for the product I: n The number of products Qi Order quantity for product i mi Number of shipments in each cycle for product i ki Capacity of each pallet for product i bi Shortage quantity in each cycle for product i Ti Cycle time for product i Tpi Production time in each cycle for product i Tdi Depletion time in each cycle for product i Tri Rework time in each cycle for product i ti Time between two successive shipments of each pallet for product i Di Demand rate for product i in units per unit time Pi Supplier's production rate for product i in units per unit time P'i In-factory rework rate for defectives of product i in units per unit time Xi Inspection rate for product i in units per unit time yi Rate of defectives per each pallet for product i ui Maximum number of shipments in each cycle of product i li Minimum number of shipments in each cycle of product i Permitted service level in each cycle for product i i Rate of disposal after doing reworks on defective i products
Permitted service level in each cycle for all products Setup cost for each cycle for each product i Rate of holding cost in unit price per unit time Holding cost per unit of product i Holding cost per unit of repaired product i Providence cost per unit of product i Rework cost per unit of product i (including the cost of on-line inspection) fi Transportation cost per each shipment for product i Ii Inspection cost per unit of product i Shortage cost per unit of product i (time i independent) THCi Total holding cost for product i per each year TSCi Total shortage cost (time independent) for product i per each year TPCi Total providence cost for product i per each year TTCi Total transportation cost for product i per each year TOCi Total ordering (setup) cost for product i per each year TRCi Total reworking cost for product i per each year TICi Total inspection cost for product i per each year TC Total annual cost for the model Ai v hi h'i ci c'i
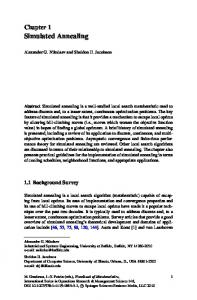
Inventory Graph: The main difference occurred in the case of discrete deliveries to the system in comparison with the classic EPQ model, as Pasandideh and Niaki [1] have shown on the inventory graph of their model, is several jumps in the level of net inventory during the production cycle. We add other changes to the inventory graph of EPQ model based on what assumed for defining our problem, as well. First, because the system is allowed to have finite shortages for each of products, thus at the beginning of each inventory cycle, an instance before and after receiving the first pallet in the system, the level of net inventory will be -bi and ki-bi for product i respectively. Second, after doing inspection during ti1 on each of pallets just entered in the system, 100×yi percent of the delivered product i will be known as defectives so that the level of net inventory instantly reduced to yiki units less than before. Third, the system is replenished instantaneously by a batch of repaired products sized mikiyi(1 - i) during the depletion cycle after spending Tri unit of times from the last delivery to the system by the supplier. Figure 1 shows the inventory graph of our problem considering the mentioned changes against the classic one. 1144
World Appl. Sci. J., 16 (8): 1142-1157, 2012
Fig. 1: Inventory graph of the problem Cost Calculations: The total cost of all products per year, TC, is the sum of total inventory costs for all products including providence, ordering, transportation, inspection, shortage, reworking and finally holding costs whose its notations mentioned in the problem parameters and notations section. So total annual cost for the model is summarized as bellow: TC =
n
n
n
n
n
n
n
∑TPCi + ∑TOCi + ∑TTCi + ∑ TICi + ∑TSCi + ∑TRCi + ∑THCi
=i 1 =i 1 =i 1 =i 1=i 1=i 1 =i 1
(1)
Each total cost item is calculated for one product per each cycle and then multiplied by the number of cycles per year calculated as follows: = Ni
Di i 1, 2,..., n = mi ki (1 − yi i )
(2)
So that miki derives the quantity to be ordered for any product and the factor 100(yi i) presents the percent of ordered products disposed of the system after doing reworks on them. Using Ni, quantity to be ordered and the cost of product providence and inspection as well, we calculate the total providence and inspection cost for product i respectively by TPCi c= = i mi ki N i
ci mi ki Di ci Di i 1,2,..., n = = mi ki (1 − yi i ) (1 − yi i )
(3)
TICi I= = i mi ki Ni
ci mi ki Di I i Di i 1, 2,..., n = = mi ki (1 − yi i ) (1 − yi i )
(4)
Total time independent shortage cost for any product calculated through multiplying Ni by bi and related cost, as presented below: TSCi =
= i bi N i
i bi Di
i 1, 2,..., n = mi ki (1 − yi i )
Similarly, the following calculation for deriving total setup cost is done: 1145
i
(5)
World Appl. Sci. J., 16 (8): 1142-1157, 2012
TOC A= = i i Ni
Ai Di i 1,2,..., n = mi ki (1 − yi i )
(6)
For calculating total transportation cost referring to problem assumptions, the frequency of shipments per each cycle, mi, is multiplied by the cost of shipping each batch(pallet) and Ni : TTCi f= f i mi = i mi N i
Di f i Di i 1,2,..., n = = mi ki (1 − yi i ) ki (1 − yi i )
(7)
The total amount of defective products accumulated during shipment of pallets by supplier is given by mikiyi, thus the cost related to do reworks on these items per each cycle is derived from ci'mikiyi. which multiplied by Ni to get the total reworking cost per year as follows: TRCi c= = i′mi ki yi N i
ci′mi ki y i Di ci′ yi Di i 1, 2,..., n = = mi ki (1 − yi i ) (1 − yi i )
(9)
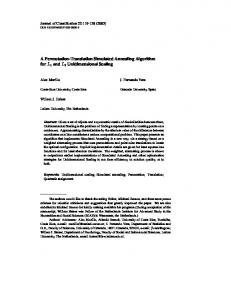
To calculate total holding cost per year for product i regarding related assumptions of the model, as presented in Fig. 2, we divide the inventory graph into four separated sections so that each of them includes the following situations respectively from left to right on the graph. Holding of conforming products shipped through production cycle (built up by 2mi trapezoids); STpi Holding of defective products shipped through production cycle (built up by (mi - 1) oblongs); Syi Holding of conforming products after spending ti units of time from when the mith shipment enters (one trapezoid) till the system is replenished of repaired products; Sri. Holding of repaired and conforming products consumed through depletion cycle (one triangle); STdi All calculations for mentioned sections are done through multiplying the area of each section by the unit holding cost per year and Ni except the last one, which has a minor difference comparing the first three ones. Calculating the area of STpi : If Sj represents the total area of the jth compound trapezoid during the production cycle, the area of STpi is derived by bellow equation: = STpi
mi
∀i ∑ S j=
1, 2,..., n
j =1
(10)
Where each area of compound trapezoids includes two trapezoids with the areas of Sj1 and Sj2 so that Sj = Sj1 + Sj2
J = 1,2,...,mi
Finally, we obtain general equation combining Eq. and for mi
ST pi
(11)
as follows:
mi
∑ ∑
= ST = Sj ∀i 1, 2,..., n (S j1 + S j 2 ) = pi =j 1 =j 1
(12)
General equations for Sj1 and Sj2 are presented below: = S ji (
2 I j − Diti1 2
)t= ∀i 1,2,...,= n ∀j 1, 2,..., mi i1
1146
(13)
World Appl. Sci. J., 16 (8): 1142-1157, 2012
Fig. 2: Holding conforming products during the time between shipments
Fig. 3: Holding defective products during production cycle = S j2 (
2 I j − 2 yi ki − Diti1 − Diti 2
)t= n ∀j 1, 2,..., mi i 2 ∀i 1, 2,...,=
(14)
Where, Ij represents the level of inventory, just a moment after replenishment of system through jth pallet shipped by supplier. General equation to obtain Ij is:
Ij = jki - (j - 1)(Diti + yiki) - bi
The bases of each trapezoid are presented by
k ti1 = i xi
and
j = =1,2,...,mi
ti= 2
ki ki − Pi xi
, which derived from problem definition and
assumptions relating to production and inspection rates. Applying Eq.(12), (13), (14),(15) and the equivalent of bases of trapezoids, the final equation for
STpi =
(15)
ST pi
is as follows:
ki 2 mi ( mi + 1) mi ( mi + 1) D D Py Di 1 yi − mi i − i2 ki 2 mi 2 − mibi ki + ( i i + = )mi ki ∀i 1, 2,..., n − Pi 2 2 2 xi 2 Pi Pi xi 2 xi
(16)
Calculating the Area of Syi: As shown in Fig.3 each defective product i found in the jth period of shipments, will be held in the system during mi - j complete ti cycles. Thus we have (mi - 1) oblongs with length and width of (mi - 1)ti, yiki respectively. 1147
World Appl. Sci. J., 16 (8): 1142-1157, 2012
Therefore, we conclude that = S yi
j= mi −1
∑
= S ′j
j= mi −1
∑
yi ki (mi − j )= ti ∀i 1,2,...,= n ∀j 1, 2,..., mi − 1
=j 1 =j 1
(17)
That is simplified to obtain the final equation bellow: = S yi mi ( mi − 1) ki 2
yi = ∀i 1,2,..., n 2 Pi
(18)
Calculating the area of Sri: When the production cycle for each product is finished, the depletion of inventories continues until when repaired products replenish the system instantaneously. To calculate the area of trapezoid located between production and depletion cycles as shown on inventory graph of the model, Fig.1, the level of net inventory at the beginning and end of this portion of each cycle for product i, Iri and Qri respectively, is derived from following equations: I ri= mi ki (1 −
= Ori mi ki (1 −
Di − yi ) − bi Pi
∀= i 1, 2,..., n
(19)
Di − yi ) − bi − Di (Tri − ti 2 ) = ∀i 1, 2,..., n Pi
(20)
Tri represents the portion of each cycle for product i in which 100(1- i) percent of defective products repaired at the fixed rate of P'i, thus we conclude that the base of trapezoid is as bellow: = Tri
mi ki yi (1 − Pi′
i) ,
= ti 2 ki (
1 1 mi ki yi (1 − − ) ⇒ Tri −= ti 2 Pi xi Pi′
i)
1 1 − )= ∀i 1,2,..., n Pi xi
(21)
1 1 + ) ki = ∀i 1, 2,..., n Pi xi
(22)
− ki (
Finally, the area of above-mentioned trapezoid, Sri, is derived from bellow equation: Di D k m y (1 − − yi ) − bi − i i ( i i S= ri mi ki (1 − Pi 2 Pi′
i)
−
1 1 mi yi (1 − + ) ( Pi xi Pi′
i)
−
Calculating the Area of STdi : Similar to what is done to calculate the area of previously mentioned sections; here we derive the area of left triangle located above the Time axis, combining following equations: 1 2 DiT= ∀i 1,2,..., n di 2
= STdi
1 − yi = Tdi mi ki Di = STdi
i
−
1 yi (1 − − Pi Pi′
1 1 − yi Di mi ki ( 2 Di
i
−
(23)
i)
1 1 b − i ∀i 1,2,..., n + ki ( − )= Pi xi Di
1 yi (1 − − Pi Pi′
i)
(24)
2
) + ki (
1 1 b −= ∀i 1, 2,..., n )− i Pi xi Di
(25)
We calculate total holding cost for product i through multiplying the area of each section by the unit holding cost per year and Ni except the depletion cycle, which its unit holding cost differs from the first three ones due to applying cost of reworks done on defective products as well as their providence cost. Thus, total holding cost for the sections with no reworks is as follows: 1148
World Appl. Sci. J., 16 (8): 1142-1157, 2012
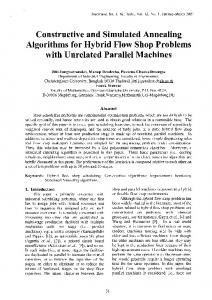
Fig. 4: calculating holding cost during depletion period THCi (during TPi , Tri= − ti 2 )
(vci )( STP + Sri + S yi ) = Ni ∀i 1, 2,..., n i
(26)
Moreover, for section Tdi we have: THC = i ( during Tdi )
(vci )( STd ) Ni i
+ THC = ∀i 1,2,..., n i ,c'
(27)
i
In fact, we assume that two different sets construct the area of STdi , so that one contains conforming (the big triangle labeled as ''conforming products" on Fig.4) and the other one contains repaired products (consisting of one oblong and one little triangle labeled as ''repaired products" on Fig.4) Either of factors (vci) and (Ni) will be applied in calculating holding cost during the period Tdi , regardless of products being conforming or repaired, thus similar to the first three sections described before, the factor (vci )( STdi ) Ni derives holding costs related to the providence cost ci. However, the effect of holding the repaired products during Tdi on the calculations has not been incorporated yet. In order to cover this issue we address the unit rework cost c'i and the set built up by keeping repaired products during Or i Di
units of time unused till to be utilized during
Td − i
Or i Di
units of time at fixed rate of Di.
THCi,c′ i
represents this additional
holding cost for each product which shown as bellow: = THCi,c' (vci′ )(= ST′ d ) Ni ∀i 1, 2,..., n i
i
Where
ST′ di
(28)
represents the area of the set labeled as ''repaired products" consisting of one oblong and one little triangle.
It is easy to calculate
THCi,c′ i
as:
THCi ,c ' (vci′ ) mi ki yi (1 − = i
The simplest form that can be concluded for = THCi,c ' i
i)
THCi, c′ i
Ori Di
1 + mi ki yi (1 − 2
i )(Td i
Ori − = ) Ni ∀i 1, 2,..., n Di
(29)
applying equations (20), (21) and (24) is as bellow:
Di (vci′ ) yi (1 − i ) bi 1 1 + ki ( − ) mi ki F4i − 1 − yi i D P i i xi
1149
(30)
World Appl. Sci. J., 16 (8): 1142-1157, 2012
Where F4i is a constant functions of given parameters of the model for product i. = F4i
2 − yi (1 + 2 Di
i)
−
1 yi (1 − i ) − = ∀i 1, 2,..., n Pi P 'i
(31)
Considering the equations (26) and (27), we define total holding cost for product i as functions of ci and ci′ separately represented by THCi ,c and THCi ,c′ respectively. i i (32)
THC = ∀i 1, 2,..., n i THCi , ci + THCi ,ci′ =
(33)
N ∀i 1,2,..., n = THCi ,ci (vci ) ( STP + S ri + S yi ) + ( STd )= i i i
The simplest form that can be concluded for THCi ,c by applying four areas calculated through equations (16), (18), i (22) and (25) in equation (33), is as bellow: THCi ,ci =
Di hi 1 − yi
i
[ F1i ki + F2i ki mi + F3i ] +
hi b2 ( i = ) − hibi ∀i 1, 2,..., n 2(1 − yi i ) mi ki
(34)
Where F1i, F2i and F3i are constant functions of given parameters of the model for product i. F1i =
D 1 1 (1 − i ) − yi ( + 2 Pi xi xi
= F2i
i(
1 1 − )) = ∀i 1, 2,..., n Pi xi
(35)
2 yi i − 1 (1 − yi i )2 yi 2 (1 − i ) 2 + − = ∀i 1, 2,..., n 2 Pi 2 Di P 'i
(36)
yi Pi + Di = ∀i 1, 2,..., n xi
(37)
= F3i
Finally, total holding cost for product i per year is as follows: = THCi
Di 1 − yi
i
' (vci ) yi (1 −
(vc′ ) y (1 − − (vci ) + i i 1 − yi i
i )(
1 1 − ) + F1i (vci ) ki + (vci' ) yi (1 − Pi xi
bi 2 vci i ) b + i 2(1 − yi i ) mi ki
(
i ) F4i
+ F2i (vci ) mi ki + F3i (vci )
)
(38)
∀i =1, 2,..., n
Problem Formulation: As we assumed that all parameters of model are deterministic, thus the amount to be sold deriving from Di for each product i is fixed too. However, assuming one of mentioned parameters as random variables, total 1 − yi i income per year for each product i as well as that of the model will be a random variable itself and total profit per unit of time must be formulated as the objective function of problem consequently. We formulate the objective function of the model in the form of minimizing the costs assumed to be incurred in the model and calculated in section 3.2. The constraints of problem to be satisfied along with minimizing the total cost are classified to three categories: Shortage Constraints: There is a given service level for each product, a1 and totally for the system, a,as well. The service level for product i is defined in such a way that (1 − i ) specifies the maximum portion of product i cycle in which shortage is allowed. Mathematically speaking, it is true to apply bellow non-equation :
1150
World Appl. Sci. J., 16 (8): 1142-1157, 2012
Tsi
≤1−
Ti
∀i =1, 2,..., n
i
(39)
Replacing Ts and Ti with its equivalents, we conclude that i bi ≤ (1 − i )(1 − yi i ) ∀i =1,2,..., n mi ki
(40)
Similarly, the constraint of system service level is defined as follows: n
∑
n
b
∑ Dii
Tsi
=i 1 = i 1 ≤ ⇒ n n mi ki (1 − yi i ) Ti Di =i 1 =i 1
∑
∑
(41)
≤
On the other hand, as shown in the inventory graph of the model we must confine ki (1 − Di − yi ) − bi for product Pi i being equal or greater than zero, preventing the second shortage in the system. Finally we have: bi D ≤ (1 − i − yi ) ki Pi
(42)
∀i =1, 2,..., n
Shipments Constraints: Supplied products are to be shipped within the pre-determined intervals, easily shown below : (43) li ≤ mi ≤ ui ∀i =1, 2,..., n The model variables ki,mi, bi are to be integer. Hence, we summarize the problem as following non-linear, integer model subjected to non-linear constraints: min = TC
n
i
+
n
∑
(
n
bi 2 vci 2(1 − yi i ) mi ki
Di (vci' ) yi (1 − − (1 ) y i i 1
=i
+
n ' Ai f b Di + i + I i + i i + ci′ yi + ci + (vci ) yi (1 − − ) (1 ) m k k m k y i i i i i i i i i 1 1= D
∑ (1 − yii
∑ i =1
∑
n n Di F3i (vci ) − i ) F4i + F2i (vci ) mi ki + (1 − yi i ) =i 1 = i 1
)
∑
∑
i )(
1 1 − ) + F1i (vci ) ki Pi xi
(vci′ ) yi (1 − (vci ) + 1 − yi i
i)
bi
s.t: bi ≤ (1 − mi ki n
i )(1 − yi i )
b
∑ Dii n
∑ i =1
i =1
mi ki (1 − yi i ) Di
bi D ≤ (1 − i − yi ) ki Pi li ≤ mi ≤ ui ki , mi , bi
∀i =1,2,..., n
≤
∀i =1, 2,..., n
∀i =1, 2,..., n Integer ∀i =1, 2,..., n
1151
(44)
World Appl. Sci. J., 16 (8): 1142-1157, 2012 Table 1: Given data for test problems
1152
World Appl. Sci. J., 16 (8): 1142-1157, 2012 Table 1: Given data for test problems
1153
World Appl. Sci. J., 16 (8): 1142-1157, 2012 Table 1: Given data for test problems
For product i, the known parameters including P ' , D , y and i must be adjusted in such a way that
Table 2: Lingo11.0 solution to test problems
i
i
i
D (1 − i ) yi , if not the time required to repair the Pi > i (1 − yi ) '
defective products will be longer than the time to utilize all conforming products.
Numerical Examples and Model Applicability: To experience the application of the model presented in this article, we use a given set of numbers for all of the parameters assumed to be known in the model. We find it better to be done by some works on feasible space of the model and concluding simple guidelines to build a numerical example, which two of those summarized as follows: For product i, the known parameters must be adjusted so that the coefficient of the factor, mi,ki, in the goal function becomes greater than zero. If not there is no feasible solution for the model.
Table (1) shows the data assumed for 8 test problems which produced randomly and used as inputs to Lingo 11.0 solver [12] which is a commercial software addressed by Winston [11] to solve non linear problems and applied as a solver for non linear-integer programs by other authors, for instance in the work of Kokangul et al. [13] as well. Lingo11.0 solution for the model with 4 products and above given data is shown in the table (2). The optimal quantities to be ordered for each product i, Qi and the length of each cycle for product i, Ti, can be derived from mi,ki, and Ti = mi ki (1 − yi i ) respectively. Di Simulated Annealing Algorithm Design and Implementation: Simulated annealing was initially introduced by Kirkpatrick et al. [14] as a heuristic search procedure to search and find solutions for problems with algorithmic complexity where the number of possible alternative solutions is vast. The key capability of this algorithm is to accept solutions with worse quality while the parameter controlled as temperature decreases, to avoid to be locked in the local optimum solution.
1154
World Appl. Sci. J., 16 (8): 1142-1157, 2012
The efficiency of simulated annealing in solving combinatorial optimization problems is very well known. We design our simulated annealing algorithm based on the following strategies. Despite of the traditional SA, we develop a SA algorithm that progresses with two solutions. The structure of presenting the solution is as follows: m1 m2 ... mn m1′ m2′ ... mn′ k1 k2 ... kn k1′ k2′ ... kn′ b1 b2 ... bn b1′ b2′ ... bn′
Fig. 5: Structure of solution Table(3)- Selection process The algorithm starts with two initial solutions. The first initial solution generated by setting mi equals to Ui, ki equals to arbitrary reasonable number and bi equals to 0. The second initial solution generated by setting mi equals to Li, ki equals to arbitrary reasonable number and bi calculated through the equation (44). = bi min li (1 −
i )(1 − yi i )
, 1−
Di − yi Pi
(45)
For generating the feasible solutions a repair strategy employed. We use hyperbolic function for conducting the process of temperature reduction.
Ti=
1 10i (T0 − T f )(1 − tgh( − 5)) + T f , i= 1,2,..., N 2 N
(46)
Because of using bi-solution SA algorithm, the new selection process is needed. Let assume S1 and S2 be the solutions so that S1=S2 and N1 and N2 be the neighbors so that N1=N2. Table (3) shows the states that are likely to be occurred. The SA algorithm will be stopped at the final temperature which be set before and is given as an input to algorithm. We ran our developed simulated annealing algorithm to solve the test problems. To study the performance of the mentioned algorithm, time of any computation and the final energy that acts as the cost of the model for each test problem recorded in the table(4). For doing comparison, cost value of LINGO solutions presented in table (2) brought in this table. One convergence curve as sample of experiments performed on test problems, shown in fig.6. Looking at the above table, it can be concluded that solutions derived from simulated annealing algorithm have almost the same quality comparing with those derived from LINGO on these 9 test problems so that the mean of absolute deviations is closed to 3.2×10 4. So the quality of our simulated annealing outputs is properly close to local optimums which obtained through branch and bound approach done by LINGO.
Table 3: Selection process State
Energy Level Order
Move Strategy
State 1
N1=N2=S1=S2
Moving Toward New Neighbors with probability 1.
State 2
N1=S1=N2=S2
Moving Toward N1 with Prob=1.Moving from S1 toward N2 by metropolis criteria.
State 3
N1=S1=S2=N2
Moving Toward N1 with Prob=1.Moving from S1 toward S2 or N2 by metropolis criteria.
State 4
S1=S2=N1=N2
Moving from S1 toward S2 or N1 or N2 by metropolis criteria.Moving from S2 toward N1 or N2 by metropolis criteria.
State 5
S1=N1=N2=S2
Moving from S1 toward N2 or S2 by metropolis criteria.Moving Toward N1 with Prob=1.
State 6
S1=N1=S2=N2
Moving from S1 toward S2 or N2 by metropolis criteria.Moving Toward N1 with Prob=1.
Table 4: Results of experiments for test problems Test Problem
Lingo Performance
SA Performance
---------------------------------------------
------------------------------------------------------
-----------------------------------------------
No.
Characteristics
Total Cost
Time
Total Cost
Time
1
4 Products
157500.96
00:00:02
157500.96
00:00:12
2
4 Products
153214.99
00:00:12
153215.58
00:00:12
3
6 Products
279127.45
00:05:16
279130.75
00:00:13
4
6 Products
279413.55
00:00:49
279414.04
00:00:12
5
8 Products
366657.69
00:18:55
366678.49
00:00:13
6
8 Products
367017.70
00:05:06
367054.47
00:00:13
7
10 Products
497153.12
00:32:11
497818.82
00:00:14
8
10 Products
1979342.64
00:00:32
1980356.04
00:00:14
9
20 Products
5799737.22
00:13:07
5805049.33
00:00:15
1155
World Appl. Sci. J., 16 (8): 1142-1157, 2012
Fig. 6: The curve of convergence to the optimal solution by SA It also can be obviously concluded that the efficiency of simulated annealing algorithm which is measured through time of computations, is much better than that of LINGO. We did all computation by 2.2GHz CPU, 2GIGABYTE RAM. Conclusion and Recommendations for Future Researches: In production-inventory environments, the EPQ model is developed to determine the economic lot size of product to be produced. The fundamental assumption differs from what assumed in EOQ model is that, during a portion of each cycle the product is produced and utilized at different fixed rates simultaneously, so that the inventories accumulate continuously until the amount ordered is delivered to stock. This study develops a supplier based Economic Production Quantity model as a multi-products EPQ model with discrete delivery orders and constrained space, with assuming imperfect quality of supplier production process and permitted shortage and Reworks employed to repair defective products during the depletion of inventories through available machines in the factory. We assume that in a portion of each cycle due to finite service level of the system, backlogging is allowed. All rates and parameters of model are deterministic. Eventually some numerical examples to illustrate the applicability of the model and computation experiences using LINGO 11.0 software and simulated annealing (SA) presented. Almost the same quality and more efficient computation times for simulated annealing in comparison to those of LINGO are shown.
So, the innovation aspects of the paper were developing a supplier based Economic Production Quantity model as a multi-products EPQ model and developing the simulated annealing (SA) algorithm to overcome the complexity of the model and compare quality of solutions and computation times obtained from LINGO with those of simulated annealing. We concluded that solutions derived from simulated annealing algorithm have almost the same quality comparing with those derived from LINGO on these 9 test problems so that the mean of absolute deviations is closed to 3.2×10 4. So the quality of our simulated annealing outputs is properly close to local optimums which obtained through branch and bound approach done by LINGO. It also can be obviously concluded that the efficiency of simulated annealing algorithm which is measured through time of computations, is much better than that of LINGO. We did all computation by 2.2GHz CPU, 2GIGABYTE RAM. As the cases of extension to this model, we propose bellow items for further researches: Some parameters of the problem such as defective rate and rework rate are most candidates to be considered as random variables. In many researches, defective rate assumed to be a random variable between zero and one and with specified probability density function. However no work is done to formulate the EPQ model with in-factory reworks performed on defective products supplied like that of formulated in this article, with random rates. 1156
World Appl. Sci. J., 16 (8): 1142-1157, 2012
It makes the model to be formulated more realistic with considering the capacity limitation of doing reworks in the factory on supplied products. This constraint can be set on total time taken to do reworks on defective products. As an approach to solve the model, other heuristic search algorithms such as genetic algorithm and ant colony may be employed and comparing their solution quality to each other and comparing them to which reported from LINGO 11.0 and simulated annealing in this article are useful. REFERENCES 1.
2.
3.
4.
5.
Pasandideh, S.H.R and S.T. Akhavan Niaki, 2008. A genetic algorithm approach to optimize a multi-products EPQ model with discrete delivery orders and constrained space, Applied Mathematics and Computation, 195: 506-514. Salameh, M.K. and M.Y. Jaber, 2000. Economic production quantity model for items with imperfect quality. International J. Production Economics, 64: 59-64. Chiu, S.W., S.L. Wang and Y.S.P. Chiu, 2007. Determining the optimal run time for EPQ model with scrap, rework and stochastic breakdowns. European J. Operational Res., 180: 664-676. Hayek, P.A. and M.K. Salameh, 2001. Production lot sizing with the reworking of imperfect quality items produced. Production Planning and Control, 12: 584-590. Barron, L.E.C., 2008. Optimal manufacturing batch size with rework in a single-stage production system - A simple derivation. Computers and Industrial Engineering, 55(4): 758-765.
6.
7. 8.
9. 10.
11. 12. 13.
14.
1157
Jamal, A.A.M., B.R. Sarker and S. Mondal, 2004, Optimal manufacturing batch size with rework process at single-stage production system. Computers & Industrial Engineering, 47(1): 77-89. Chung, K.J., 2003. Approximations to production lot sizing with machine breakdowns. Computers & Operations Res., 30: 1499-1507. Liao, G.L., Y.H. Chen and S.H. Sheu, 2008. Optimal economic production quantity policy for imperfect process with imperfect repair and maintenance. European J. Operational Res., 195(2): 348-357. Koh, S.G., H. Hwang, K.I. Sohn and C.S. Ko, 2002. An optimal ordering and recovery policy for reusable items. Computers & Industrial Engineering, 43: 59-73. Konstantaras, I. and S. Papachristos, 2008. Note on: An optimal ordering and recovery policy for reusable items. Computers & Industrial Engineering, 55(3): 729-734. Winston, W.L., 1994, Introduction to mathematical programming: Application and algorithms, 3 rd Ed. International Thomson Publishing. Lingo User’s Guide, LINDO Systems Inc. Chicago, 2008. Kokangul, A. and Z. Susuz, 2009. Integrated analytical hierarch process and mathematical programming to supplier selection problem with quantity discount. Applied Mathematical Modeling, 33: 1417-1429. Kirkpatrick, S., C.D. Gelatt Jr and M.P. Vecchi, 1983, Optimization by simulated annealing, Sci., 220: 671-680.