Leonardo Journal of Sciences
Issue 25, July-December 2014
ISSN 1583-0233
p. 43-56
Simulated annealing optimization for multi-objective economic dispatch solution Ismail ZIANE*, Farid BENHAMIDA, Amel GRAA Irecom Laboratory, Department of Electrotechnics UDL University of Sidi Bel Abbes Sidi Bel Abbes, Algeria. E-mails:
[email protected] ;
[email protected];
[email protected] *
Corresponding author, Phone: +213555835940
Abstract This paper presents a multi-objective Simulated Annealing Optimization to solve a Dynamic Generation Dispatch problem. In this work, the problem is formulated as a multi-objective one with two competing functions, namely economic cost and emission functions, subject to different constraints. The inequality constraints considered are the generating unit capacity limits while the equality constraint is generation-demand balance. To show the advantages of the proposed algorithm, it has been applied for solving multi-objective EELD problems in a 3-generator system with NOx and SO2 emission. Results obtained with Simulated Annealing have been compared with other existing relevant approaches available in literatures. Experimental results show a proficiency of Simulated Annealing over other existing techniques in terms of robustness. Keywords Economic dispatch; Multi-objective optimization; Simulated annealing.
Introduction
The traditional economic dispatch is an optimization problem to find the most 43 http://ljs.academicdirect.org/
Simulated annealing optimization for multi-objective economic dispatch solution Ismail ZIANE, Farid BENHAMIDA, Amel GRAA
economical schedule of the generating units while satisfying load demands and load constraints. The conventional economic dispatch (ED) cannot satisfy the environmental protection requirements, since it only considers minimizing the total fuel cost. The gaseous pollutants emitted by the power stations cause harmful effects with the human beings and the environment like the sulphur dioxide (SO2), nitrogen oxide (NOx), and the carbon dioxide (CO2), etc. [1]. The optimization of production cost should not be the only objective but the reduction of emission must also be taken into account. The ED problem can be handled as a multi-objective optimization problem that the objective functions are the total cost of electrical energy and the total emission function [2]. In general, multi-objective optimization problems are solved by reducing them to a scalar equivalent [3]. This is achieved by aggregating the objective functions into a single function [3]. Recently, multi-objective algorithms have also been used to solve the Dynamic Generation Dispatch problem. IBPVT approach [4], particle swarm optimization (PSO) [5], genetic algorithm (GA) [6], and linear programming [7]. New multi-objective stochastic search [8] has also been proposed to solve EED multi-objective problem by generating the Pareto optimal solution. The objective of economic dispatch is to find the optimal combination of power generations that minimizes the total generation cost while satisfying an equality constraint and inequality constraints. On the other hand emission dispatch reduces the total emission from the system by an increase in the system operating cost.
Material and method
Economic dispatch and emission dispatch The present formulation treats the EELD problem as a multi-objective mathematical programming problem which is concerned with the attempt to minimize each objective simultaneously. The equality and inequality constraints of the system must meanwhile, be satisfied. The following objectives and constraints are taken into account in the formulation of the EELD problem.
44
Leonardo Journal of Sciences
Issue 25, July-December 2014
ISSN 1583-0233
p. 43-56
The economic dispatch problem can be modelled by: n
min FT ( P) = ∑ Fi ( Pi )
(1)
i =1
where FT is the total fuel cost; FT(Pi) is the fuel cost of generating unit i; n is the no. of generator. Fuel Cost Function: The fuel cost function of a generating unit is usually described by a quadratic function of power output Pi as:
Fi ( Pi ) = ai Pi 2 + bi Pi + ci
(2)
where ai ,bi and ci are the cost co-efficient of unit i. Emission Equation: The Emission equation kg/hr of a generating unit is usually described by a quadratic function of power output Pi as:
ESO 2i (Pi ) = dSO 2i Pi 2 + eSO 2i Pi + f SO 2i
(3)
where dSO2i, eSO2i and fSO2i are the SO2 emission co-efficient of unit i. Similarly, the emission dispatch problem for NOx can be defined as the following optimization problem
ENOxi (Pi ) = dNOxi Pi 2 +eNOxi Pi + f NOxi
(4)
where dNOxi, eNOxi and fNOxi are the NOx emission co-efficient of unit i. The emission dispatch problem for CO2 can be defined as the following optimization problem
ECO 2i (Pi ) = dCO 2i Pi 2 +eCO 2i Pi + f CO 2i
(5)
where dCO2i , eCO2i and fCO2i are the CO2 emission co-efficient of unit i. Transmission losses: The transmission losses PL can be found using B-coefficients n
n
PL = ∑ ∑ Bij Pi Pi
(6)
i =1 j =1
where Bij is the transmission line coefficients. Power Balance Constraints: The total supply must be equal to power demand
45
Simulated annealing optimization for multi-objective economic dispatch solution Ismail ZIANE, Farid BENHAMIDA, Amel GRAA
∑P = P i
D
(7)
+ PL
where PD is the load demand. Generator limit Constraints: The power generation of unit i should be between its minimum and maximum limits. (8)
Pi min ≤ Pi ≤ Pi max
where Pi min is the minimum generation limit of unit i and Pi max is the maximum generation limit of unit i. Multi-objective dispatch model The general structure of multi-objective generation and emission dispatch problem is expressed as- find: P = [ P1 , P2 ,L, PN ]
T
(9)
min F = [ FFC , FSX , FNX , FCX ]
Subject to: h( Pi ) = 0
(10)
g ( Pi ) ≤ 0
The above mentioned multi- objective optimization problem can be converted to a single objective optimization problem by introducing price penalty factors as follows:
FTi (Pi ) = F(Pi ) + hSO2i ESO 2i (Pi ) + hNOXi ENOxi (Pi ) + hCO2i ECO2i (Pi )
(11)
where hSO2, hNOx and hCO2 are price penalty factors for SO2, NOx, and CO2, respectively, blending the emission costs with the normal fuel costs.
A simulated annealing algorithm for multi-objective dispatch model The concept of simulated annealing was first introduced in the field of optimization in the early 1980’s by Kirkpatrick and independently by Cerny [9]. Simulated annealing is a robust, general-purpose combinatorial optimization algorithm based on probabilistic methods which has been applied successfully too many areas such as VLSI circuit design, neural-
46
Leonardo Journal of Sciences
Issue 25, July-December 2014
ISSN 1583-0233
p. 43-56
networks, image processing, code design, capacitor placement in power systems, and economic load dispatch. This method is based on slow cooling of a material at state fusion, which leads it to a solid state with low energy. The same basic principle can be used in an optimization algorithm. The objective function to be minimized can be considered as the system energy, while different combinations of the optimization are the configurations of the system given its degrees of freedom. Analogy to physical annealing The name simulated annealing comes from an analogy between combinatorial optimization and the physical process of annealing. In physical annealing a solid is cooled very slowly, starting from a high temperature, in order to achieve a state of minimum internal energy. It is cooled slowly so that thermal equilibrium is achieved at each temperature. Thermal equilibrium can be characterized by the Boltzmann distribution. −
PT { X = x} = (e
EX
kBT
−
) / (∑e
Ei
kBT
)
(12)
i
where X is a random variable indicating the current state, Ex is the energy of state x, kB is Boltzmann’s constant, and T is temperature. The evolution of the state of a solid in a heat bath toward thermal equilibrium can be efficiently simulated by a simple algorithm based on Monte Carlo techniques which was proposed by Metropolis [10] in 1953. The Metropolis algorithm takes the current state x, and generates a new state y by applying some small perturbation. The transition from state x to state y is then accepted with probability. ⎧⎪1, Paccept {x , y } = ⎨ − ( E x − E y )/ k BT , ⎪⎩ e
if E X − EY ≤ 0
(13)
if E − E > 0
If accepted, y becomes the current state and the procedure is repeated. This acceptance rule is known as the Metropolis criterion. Given a particular combinatorial optimization problem let the solution x correspond to the current state of the solid, the cost function correspond to the energy of the current state, and the control parameter T correspond to the temperature of the solid. The simulated annealing algorithm consists simply of iterating the Metropolis algorithm for decreasing values of the artificial temperature parameter T.
47
Simulated annealing optimization for multi-objective economic dispatch solution Ismail ZIANE, Farid BENHAMIDA, Amel GRAA
Table 1. Simulated vs. physical annealing. Optimization problem Physical system solution x current state of the solid cost or objective value f(x) energy of current state control parameter T temperature optimal solution xopt ground state simulated annealing gradual cooling Some of the analogies between the thermal process of physical annealing and the artificial process of simulated annealing in a combinatorial optimization problem are summarized in Table 1. Control parameters of AS algorithm The algorithm of simulated annealing consists of operating parameters [11], [12], which should be well set in order to achieve its best performance. These are briefly mentioned in the following. Initial temperature At beginning, initial temperature must be set at a higher value, in order to get more probability of acceptance for non-optimized solutions during the first stages of the algorithm. Too much higher selection of initial temperature makes an algorithm slow and computationally inefficient. On the other hand, very low initial temperature may not be capable of searching a minimum especially for multi model function. There is no particular way to find out proper initial temperature which is suitable for whole range of problems. Final temperature While working with SA algorithm generally the final temperature fall is set to zero degree Celsius. SA algorithm can take much longer time to execute the operation, if the decrement in the temperature is exponential in nature. Finally, the stopping criterion is selected, which can be either an appropriate low temperature or the value where the system get freeze at that temperature.
Temperature decrement As initial and final temperatures have predefined values, it is essential to find the approach of transition from starting to its final temperature as the success of algorithm depends on it. The decrement of temperature at time “t” is
48
Leonardo Journal of Sciences
Issue 25, July-December 2014
ISSN 1583-0233
p. 43-56
T (t ) =
d log(t )
(14)
where d is a positive constant. The temperature decrement can also be implemented using T (t + 1) = αT
(15)
where α, is a constant close to 1. Iterations at each Temperature To enhance efficiency of the algorithm, selection of proper number of iterations is another important factor. The realization of only iteration for each temperature and the fall in temperature should take place at a really slow rate which can be expressed as: T (t ) =
t (1 + β t )
(15)
Generally, β have very small value. Simulated annealing algorithm The SA algorithm for dispatch problem is stepped as follows: Step 1: Initialization of the values temperature T, parameter α and iterations number criterion. Find randomly, an initial feasible solution, which is assigned as the current solution Si and perform ELD in order to calculate the total cost, Fcost, with the preconditions (7) and (8) fulfilled. Step 2: Set the iteration counter to μ = 1. Step 3: Find a neighboring solution Sj through a random perturbation of the counter one and calculate the new total cost Fcost Step 4: If the new solution is better, we accept it, if it is worse, we calculate the deviation of cost ΔS=Sj-Si and generate a random number uniformly distributed over Ω ∈ ( 0,1) . If e
−
ΔS t
≥ Ω ∈ ( 0,1)
Accept the new solution Sj to replace Si . Step 5: If the stopping criterion is not satisfied, reduce temperature using parameter α: T(t) = αT and go to Step 2. The proposed SA algorithm has been tested on a 3-generator system with NOx and SO2 emission. The software was implemented by the MATLAB language. For conducting the
49
Simulated annealing optimization for multi-objective economic dispatch solution Ismail ZIANE, Farid BENHAMIDA, Amel GRAA
test, the initial temperature is fixed at 0.4°C, alpha is fixed at 0.5 and max tries is 10000. The final temperature is 1e-10°C.
Results and discussion
The generator cost coefficients, emission coefficients, generation limits, and loss coefficients of 3 units system are taken from [14]. The multi-objective EELD solution for the 3- unit system is solved using SA when system demand is 850 [MW]. Table 2. Best fuel cost. Tabu Search[13] NSGA-II[14] OBBO[15] BBO[15] BB_BC[16] SA 435.69 436.366 435.1981 435.1966 434.5152 435.1972 P1 298.828 298.187 299.9697 299.9723 300.7308 299.9632 P2 131.28 131.228 130.6604 130.6600 130.6044 130.6684 P3 15.798 15.781 15.8282 15.8289 15.8505 15.8288 Losses(MW) 8344.598 8344.606 8344.5875 8344.5927 8344.5952 8344. 5927 Fuel cost ($/h) 9.02146 9.02083 9.021948 9.02195 9.02261 9.0220 SO2 Emission (ton/h) 0.09863 0.09860 0.098686 0.098686 0.09871 0.0987 NO2 Emission (ton/h)
Table 2 shows the distribution of load among generators as system demand for minimum cost of generation and the obtained results by SA are compared with Tabu Search, NSGA-II, OBBO, BBO, and BB_BC. Table 3. Best SO2 emission. Tabu Search[13] NSGA-II[14] OBBO[15] BBO[15] BB_BC[16] SA 549.247 541.308 552.1113 552.1111 552.7414 552.1083 P1 234.582 223.249 219.4441 219.4441 219.0790 219.4484 P2 81.893 99.919 92.9597 92.96053 92.6958 92.9592 P3 15.722 14.476 14.5151 14.5158 14.5164 14.5159 Losses(MW) 8403.485 8387.518 8396.4616 8396.4665 8397.023 8396.4800 Fuel cost ($/h) SO2 Emission (ton/h) 8.974 8.96655 8.965931 8.965937 8.965936 8.9659 0.09740 0.09637 0.096817 0.096817 0.09684 0.0968 NO2 Emission (ton/h)
Table 4. Best NOx emission. Tabu Search[13] NSGA-II[14] OBBO[15] BBO[15] BB_BC[16] SA 502.914 505.81 508.5800 508.5813 508.291 508.5594 P1 254.294 252.951 250.4423 250.4433 250.600 250.4430 P2 108.592 106.023 105.7228 105.7212 105.854 105.7433 P3 15.8 14.784 14.7451 14.7459 14.747 14.7457 Losses(MW) 8371.143 8363.627 8365.1088 8365.1146 8364.953 8365.1022 Fuel cost ($/h) 8.874 8.96655 8.973662 8.973667 8.965936 8.9737 SO2 Emission (ton/h) NOX Emission (ton/h) 0.0958 0.09593 0.095923 0.095923 0.09592 0.0959
50
Leonardo Journal of Sciences
Issue 25, July-December 2014
ISSN 1583-0233
p. 43-56
Table 5. Best compromise solution emission. NSGA-II[14] OBBO[15] OBBO [15] BB_BC[16] SA 496.328 507.11971 507.11954 442.893 442.1752 P1 260.426 251.64200 251.64262 305.503 305.8545 P2 108.144 106.00030 106.00042 117.546 117.9238 P3 14.898 14.76251 14.76258 15.94 15.9535 Losses(MW) 8358.896 8364.30627 8364.31126 8345.813 8345.7469 Fuel cost ($/h) 8.97870 8.974195 8.974201 9.01602 9.0166 SO2 Emission (ton/h) 0.0959248 0.0959248 0.09776 0.0978 NOX Emission (ton/h) 0.09599 Total cost ($/h) 31234.99029 31226.40958 31226.41898 25035.140 25035.1214
The obtained results for minimum emission of SO2 are presented in Table 3, and the obtained results for minimum emission of NOx are presented in Table 4. The best compromise solution for the precedent methods are presented in Table 5. The best fuel cost is obtained by SA (8344. 5927 $/h). The best SO2 emission output is 8.9659 ton/h. The best NOx emission output is 0.0959 ton/h. The best compromise solution is 25035.1214 $/h. The same test system was taken to solve the dynamic generation dispatch problem using the proposed SA method. The power demands for the 5 time intervals are given in Table 6. Table 6. Best compromise solution. Load 550 600 700 800 850 307.1310 329.3138 374.0705 419.3406 442.1703 P1 160.3247 184.6185 233.1539 281.6376 305.8578 P2 88.6302 93.4363 103.1426 112.9674 117.9255 P3 6.0859 7.3686 10.3669 13.9456 15.9536 Losses(MW) 5581.4799 6028.7064 6939.2480 7871.4463 8345.7467 Fuel cost ($/h) 6.4941 7.4855 8.5004 9.0166 SO2 Emission (kg/h) 6.0071 0.0882 0.0902 0.0947 0.0978 NOX Emission (kg/h) 0.0880 Total cost ($/h) 18760.5958 19660.5278 21633.8869 23841.8787 25035.1214
Table 7. Comparison of best compromise solution and best fuel cost. Time PD interval 1 2 3 4 5
Best compromise solution
Fuel SO2 emission cost 550 5581.4799 6.0071 600 6028.7064 6.4941 700 6939.248 7.4855 800 7871.4463 8.5004 850 8345.7467 9.0166
NOx emission 0.0880 0.0882 0.0902 0.0947 0.0978
Best fuel cost Fuel SO2 cost emission 5575.7533 6.0283 6024.9087 6.514 6937.9036 7.5012 7870.6929 8.5097 8344.5927 9.0219
NOx emission 0.0889 0.0889 0.0909 0.0954 0.0987
Percent change (%) Fuel cost 0.1026 0.0630 0.0194 0.0096 0.0138
SO2 emission -0.3529 -0.3064 -0.2097 -0.1094 -0.0588
NOx emission -1.0227 -0.7937 -0.7761 -0.7392 -0.9202
51
Simulated annealing optimization for multi-objective economic dispatch solution Ismail ZIANE, Farid BENHAMIDA, Amel GRAA
Table 8. Comparison of best compromise solution and best SO2 emission. Time PD interval
Best compromise solution
Best SO2 emission
Percent change (%)
NOx Fuel SO2 NOx Fuel SO2 NOx Fuel SO2 emission emission cost emission emission cost emission emission cost 0.0880 5621.4302 5.9771 0.0925 -0.7158 0.4994 -5.1136 550 5581.4799 6.0071 0.0882 6073.1566 6.4619 0.0922 -0.7373 0.4958 -4.5351 600 6028.7064 6.4941 0.0902 6987.6191 7.4476 0.0922 -0.6971 0.5063 -2.2173 700 6939.248 7.4855 0.0947 7921.8504 8.4545 0.0947 -0.6403 0.5400 0.0000 800 7871.4463 8.5004 0.0978 8396.4286 8.9659 0.0968 -0.6073 0.5623 1.0225 850 8345.7467 9.0166
1 2 3 4 5
Table 9. Comparison of best compromise solution and best NOx emission. Time PD Interval
Best compromise solution Fuel cost
1 2 3 4 5
550 600 700 800 850
5581.4799 6028.7064 6939.248 7871.4463 8345.7467
SO2 emission 6.0071 6.4941 7.4855 8.5004 9.0166
Best NOx emission
NOx emission 0.0880 0.0882 0.0902 0.0947 0.0978
Fuel cost 5583.1452 6033.0901 6949.3417 7887.6146 8365.1352
SO2 emission 6.0061 6.4862 7.4638 8.4645 8.9737
NOx emission 0.0880 0.0881 0.0897 0.0933 0.0959
Percent change (%) Fuel cost -0.0298 -0.0727 -0.1455 -0.2054 -0.2323 10
10000
SO2 NOx emission emission 0.0166 0.0000 0.1216 0.1134 0.2899 0.5543 0.4223 1.4784 0.4758 1.9427 0,10
Fuel cost ($/h) S O 2 E m ission (kg/h) N O x Em ission (kg/h)
9000
8
8000
7000
6
6000
5000
0,08 0
2
4
6
T im e interval (h)
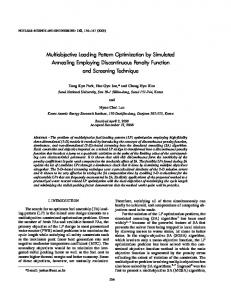
Figure 1. Best compromise solution for fuel cost, SO2 and NOx emission for the 5 time intervals. In Figure 1, the black axis presents the fuel cost, the blue axis presents the NOx emission and the red axis presents the SO2 emission for the 5 time intervals. The Table 7 presents a percent change between the best compromise solution and the best fuel cost for the 5 time intervals. We note that the results from the best compromise solution give the best NOx and SO2 emission. The Tables 8 and 9 present a percent change between the best compromise solution and the best SO2 emission, the best compromise solution and the best NOx emission, for the 5 time interval. In Figure 1, the load demand augmentation makes increasing in the fuel cost and the gas emission outputs (SO2 and NOx). In Figure 2, the best compromise solution can give a
52
Leonardo Journal of Sciences
Issue 25, July-December 2014
ISSN 1583-0233
p. 43-56
better minimum NOx emission output than the best fuel cost and the best SO2 emission solutions.
0 ,1 0 0
B est B est B est B est
NO2emission (tan/h)
0 ,0 9 8
0 ,0 9 6
N O 2 e m is s io n c o m p ro m is e s o lu tio n S O 2 e m is s io n fe u l c o s t
0 ,0 9 4
0 ,0 9 2
0 ,0 9 0
0 ,0 8 8 1
2
3
4
5
T im e in te rv a l(h )
Figure 2. NOx emission for the 4 solution cases (best fuel cost, best SO2 emission, best NOx emission and best compromise solution). In contrast, from an environmental perspective, minimizing the harmful impacts of the gaseous emission is an imperative objective. These two conflicting objectives in particular are considered in both the single and multi-objective optimization of power system operation treated in this work. In general, optimization methods are classified into two main categories; deterministic and heuristic. In this thesis, one of the recently introduced heuristic optimization methods, SA, has been discussed, developed and employed to treat the considered economic and environmental optimization problems of power system operation. Various types of optimization functions were considered including single and multi-objective. The dynamic generation dispatch problem has been solved considering the transmission power losses. By these simulated results, SA method provides superior result than previously reported methods.
Conclusions
In this paper, Simulated Annealing Optimization (SA) has been proposed. In order to
53
Simulated annealing optimization for multi-objective economic dispatch solution Ismail ZIANE, Farid BENHAMIDA, Amel GRAA
prove the effectiveness of the algorithm it is applied to EELD problem with three generating units. The results obtained by proposed method were compared with Tabu Search, NSGA-II, OBBO, BBO, and BB_BC. The best fuel cost is obtained by SA (8344. 5927 $/h). The best SO2 emission output is 8.9659 ton/h. The best NOx emission output is 0.0959 ton/h. The best compromise solution can create compatibility between production costs and the environment. The comparison shows that the Simulated Annealing performs better than above mentioned methods. SA has superior features, including quality of solution, stable convergence characteristics and better computational efficiency. Therefore, this result shows that SA optimization is a promising technique for solving complicated problems in power system.
References
1. Younes M., Khodja F., Kherfene R. L., Economic and emission dispatch problems using a new hybrid algorithm, International Conference on Environment, Energy, Ecosystems and Development, 2013, p. 119-126. 2. Mojarrad H. D., Niknam T., Meymand H. Z. and Hassan Rastegar, A novel multi-objective modified honey bee mating optimization algorithm for economic/emission dispatch, Electrical engineering (ICEE), 2011 19th Iranian Conference On, 2011. 3. Jubril A. M., Komolafe O. A., Alawode K. O., Solving multi -objective economic dispatch problem via semidefinite programming, IEEE Transactions on Power Systems, 2013, 28(3), p. 2056-2064. 4. Chen P. H., Chen H. C., Wu F. J., Chen L. M., Liu A., Environmental protection power dispatch for modern power system, International Journal of Environmental Science and Development, 2013, 4(5), p.501-508. 5. AlRashidi M. R., El-Hawary M. E., Economic dispatch with environmental considerations using particle swarm optimization, Power Engineering, Large Engineering Systems Conference, 2006.
54
Leonardo Journal of Sciences
Issue 25, July-December 2014
ISSN 1583-0233
p. 43-56
6. Abido M. A., Multiobjective evolutionary algorithms for electric power dispatch problem, Evolutionary Computation, IEEE Transactions, 2006, 10(3), p. 315-329. 7. Farag A., Al-Baiyat S., Cheng T. C., Economic load dispatch multiobjective optimization procedures using linear programming techniques, IEEE Transactions on Power Systems, 1995, 10(2), p. 731-738. 8. Das D. B., Patvardhan C., New multi-objective stochastic search technique for economic load dispatch, IEE Proc.-Gener. Trmsm. Distrib., 1998, 145(6), p. 747-752. 9. Kirkpatrick S., Gelatt Jr C. D., Vecchi M. P., Optimization by simulated annealing, Science, 1983, 220, p. 671-680. 10. Metropolis N., Rosenbluth A., Rosenbluth M., Teller A., and Teller E., Equation of state calculations by fast computing machines, Journal of chemical physics, 1953, 21, p. 10871092. 11. Kolahan F., Abachizadeh M., Optimizing turning parameters for cylindrical parts using simulated annealing method, World academy of science, Engineering and technology, 2008, 22, p.436-439. 12. Vishwakarma K. K., Dubey H M., Simulated annealing based optimization for solving large scale economic load dispatch problems, International journal of engineering research & technology (IJERT), 2012, 1(3). 13. Roa-Sepulveda C. A., Salazar-Nova E. R., Gracia-Caroca E., Knight U. G., Coonick A., Environmental economic dispatch via hopfield neural network and tabu search, UPEC’, 1996, p. 1001-1004. 14. Ah King R. T. F., Rughooputh H. C. S., Elitist multiobjective evolutionary algorithm for environmental/economic dispatch, Congress on evolutionary computation, 2003, 2, p. 1108-14. 15. Pranab A B., Chattopadhyay K., Oppositional Biogeography-Based Optimization for Multi-objective Economic Emission Load Dispatch, Annual IEEE India Conference (INDICON), 2010.
55
Simulated annealing optimization for multi-objective economic dispatch solution Ismail ZIANE, Farid BENHAMIDA, Amel GRAA
16. Labbi Y., Ben Attous D., Combined Economic and Emission Dispatch Using Big Bang– Big Crunch Optimization Algorithm, ICEN’2010 – International Conference on Electrical Networks, 2010.
56