2014 IEEE International Conference on Automation Science and Engineering (CASE) Taipei, Taiwan, August 18-22, 2014
A Simulation Based GA for Multi-objective Optimization in Patient Flow Distribution * Yunzhe Qiu, Jie Song, Member, IEEE, Zekun Liu Centers (CHC) and the GH together, where patients are movable between CHCs and the GH according to the Two-Way Referral Policy (TWRP), a policy enacted by Chinese government to encourage referral. Since the healthcare service model is too complicated to be modeled by mathematical tools, we use DES to model our connected two-level healthcare system. To avoid the subjectivity of the higher-level information based on decision makers’ preference, we use the ideal multi-objective optimization procedure (Deb, 2014) to find a set of trade-off solutions called Pareto optimal solution set. We use GA as the optimization algorithm, and the initiation is that our procedure uses the non-dominated probability as the fitness function to rank candidate solutions instead of only comparing the mean value of each objective variable. We finally carry out a case study on the background of the PUTH and fifteen CHCs in Haidian District, Beijing, China, to implement our approach. Based on the results, we raise some general recommendations to improve the patient flow distribution in the current urban healthcare system.
Abstract — The imbalanced development among different levels of healthcare facilities has become a major social issue in China’s urban healthcare system. In this research, we propose a methodology to find the optimal macro-level patient flow distribution in terms of multi-dimension inputs and outputs for the hierarchical healthcare system. This research integrates Discrete-Event Simulation (DES), multi-objective programming and simulation optimization. The problem is solved by the ideal multi-objective optimization procedure. We develop an algorithm integrating DES and Genetic Algorithm (GA), where the DES model is functioned as the “fitness function” to find the Pareto optimal solution set. A case study of a two-level healthcare system, which consists of the Peking University Third Hospital (PUTH) and fifteen healthcare centers in Haidian District, Beijing, China, is carried out to implement the multi-objective simulation optimization model. The result of case study confirms the imbalance of the patient flow distribution and provides a Pareto optimal set for decision makers. Keyword — Macro-level patient flow distribution; simulation optimization; genetic algorithm; discrete-event simulation I.
This paper consists of the following sections. Section II reviews the former research on improving patient flow distribution and simulation optimization as well as multi-objective optimization in healthcare. In section III, a methodology combing GA and DES to solve multi-objective optimization is introduced. Section IV includes the case study of the PUTH, in which our approach is implemented. Section V is the conclusion part, the conclusion to our approach is included, and we raised some policy recommendations to the government. Besides, the limitation of our approach and the future study directions are also pointed out.
INTRODUCTION
The imbalanced development of public healthcare system and patients’ demand has grown into a worldwide problem. Patients desire fast and high-quality healthcare service with less expense, but not all of the hospitals can provide effective and timely access for them. In China, patients prefer General Hospitals (GH) for the higher-quality healthcare service, which makes GH facing the dilemma that the demand exceeds service capacity. To solve the GH congestion problem at the beginning, we propose a research aimed at optimizing the multi-objective performances of hierarchical urban healthcare system by adjusting the patient flow distribution.
II. LITERATURE REVIEW Existing literatures on patient flow improvement or optimization can be classified by how to construct the objective function. Most of the researches only choose one objective to optimize. Some are concerned about the service time represented by LOS (Horwitz 2010, Zeng 2012, Wang 2013, Konrad 2013), and some aim to reduce LWBS/LWOT (Leave WithOut Treatment) or to improve the throughputs (Kennedy 2008, Cochran 2009, Cochran 2010), but only a few focus on the utilization of severs (Behr 2010).
In this research, we develop a methodology by integrating Discrete Event Simulation (DES), multi-objective optimization, and simulation optimization. The problem is formulated as a multi-objective optimization to find the trade-off among a series of system performances, including patients’ Length Of Stay (LOS), the Leave Without Being Seen (LWBS) rate, as well as system throughputs and the resources’ utilization. We first build a connected two-level healthcare system by combining Community Healthcare
However, focusing on one single objective sometimes cannot improve the system overall. Decision makers need to optimize a couple of system performances, in other words, multiple objectives are considered at the same time. In this case, multi-objective programming techniques, including objective dimensionality reduction, preference-based multi-objective optimization and ideal multi-objective optimization procedure (Deb 2014), are required.
* This paper was partially supported by National Science Foundation of China (NSFC) under the grants 71301003 and Specialized Research Fund for the Doctoral Program of Higher Education (SRFDPH) 20130001120007. Yunzhe Qiu and Jie Song are with the Department of Industrial Engineering and Management at Peking University, Beijing, 100871, China (corresponding author e-mail:
[email protected]; e-mail:
[email protected]). Zekun Liu is with the School of Mathematics Sciences at Peking University, Beijing, 100871,China (e-mail:
[email protected]). 978-1-4799-5283-0/14/$31.00 ©2014 IEEE
A common method of objective dimensionality reduction is to set benchmarks to secondary objectives, and only 1
optimize one primary objective instead. By this way, secondary objectives are transformed into constraints, and the primary objective retains as the objective function. Ahmed and Alkhamis (2009) transform the average wait time and costs to an ED unit at a governmental hospital in Kuwait into constraints of the programming model, so that only the system throughputs is defined as the only objective function needed to optimize. Santibáñez et al (2009) use simulation to redesign the scheduling strategy of ACU process under several scenarios at an ambulatory care in Canada. In this research, a waiting time benchmark is defined, and the utilization of ACU is aimed to be maximized. Popovich et al (2012) reduce the patients’ LWBS rate in hospital emergency services by making the total LOS meet national benchmarks. Zhang et al (2012) carry out a research to long-term care capacity planning in Canada. They aim to find the minimal capacity planning satisfying the standard service level for patients’ waiting time expressed as the probability that a patient exceeds the given wait time target.
according to the real-world system, and then candidate solutions generated by the GA procedure are fed into the simulation model for the performance estimation. After that values of objective variables can be calculated by simulation outputs, and the GA procedure ranks candidate solutions by the non-dominated probability. Some of the best-performed solutions are selected as the “parents”, and through the crossover and mutation processes, a new generation of candidate solutions are reproduced. The GA procedure stops if the terminate criteria are satisfied, and the candidate solution set is regarded as the Pareto optimal set, otherwise, another iteration is required. At this moment, the unique optimal solution is chosen from the Pareto optimal set based on decision makers’ preference, and different solutions may be appropriate for different system backgrounds.
However, situations that the criteria or limits of wait time, budget, LOS and LWBS cannot be determined exist for sure. Another way to transform a multi-objective problem into single objective is the preference-based multi-objective optimization procedure (Deb 2014). Based on the higher-level information, a preference vector representing the weight of each objective is determined, and then a composite single objective function is constructed based on preference vector and objective vector. At this moment, single objective optimization algorithms are available for the newly defined composite objective function to find a single trade-off optimal solution. Abo-Hamad and Arisha (2012) also use AHP to aggregate conflicting objectives of providing wide accessibility and delivering high quality services together as single objective, after their simulation model based on the emergency department exports outputs.
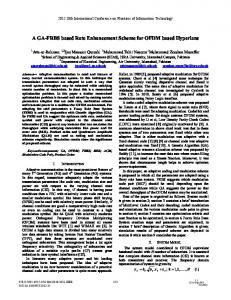
Figure 1. Diagram of methodology structure
A. Model Formulation The aim of our research is to optimize the multi-objective system performances by guiding the patient flow distribution. We choose three variables with significant influences on the patient flow drawing much attention from the government as decision variables:
The limit of preference-based multi-objective procedure is that the trade-off optimal solution is largely sensitive to the preference vectors used in forming the composite function. Another multi-objective optimization procedure (Deb 2014), regarded as the ideal one is: 1) find the set of trade-off (non-dominated Pareto) optimal solutions by considering all objectives; 2) use higher-level qualitative considerations to make a choice in the optimal solution set. The common way to find Pareto optimal solution set is by using GA. The usage of GA in health care problems dates back to the end of last century. Sepulveda (2001) develops a methodology integrating simulation and GA for a cancer treatment center to optimize the performance of four objectives. Unfortunately, he does not find the Pareto optimal set by the domination theory. He uses an integrated objective function value as the fitness function, and essentially, solving a single objective problem. Li (2010) solves a two-objective operating room scheduling problem by the combination of simulation and Random Key GA.
𝑝0,𝐶𝐻𝐶 denotes the Community First Attendance Ratio (CFAR),
𝑝𝐶𝐻𝐶,𝐺𝐻 denotes the ratio of upward referrals in the GH patients, and
𝑝𝐺𝐻,𝐶𝐻𝐶 denotes the ratio of downward referrals after finishing basic treatment in GH.
Different from former researches which only consider a single system performance measure, we formulate multi-objective functions containing the LOS, the throughputs, the service quality represented by the LWBS rate, and the resources’ utilizations. We define
𝑇𝐶𝐻𝐶 and 𝑇𝐺𝐻 as the average LOS in CHC and GH,
𝑇𝑈𝑝𝑤𝑎𝑟𝑑 as the average LOS of upward referrals in the system,
𝐻 as the number of cured patients in a day,
III. METHODOLOGY: COMBINATION OF MULTI-OBJECTIVE OPTIMIZATION AND SIMULATION OPTIMIZATION
𝐿𝐶𝐻𝐶 and 𝐿𝐺𝐻 as the service LWBS rate in CHC and GH, and
The methodology structure of this research combining DES and GA is shown in Figure 1. The main part of our methodology is the GA procedure, and the simulation model for the healthcare system is functioned as the fitness functions of the GA procedure. We first construct a simulation model
𝑈𝐶𝐻𝐶 and 𝑈𝐺𝐻 as the servers’ average utilization in CHC and GH.
The multi-objective functions are expressed as 2
Minimize 𝑇𝐶𝐻𝐶 = 𝑇1 (𝑝0,𝐶𝐻𝐶 , 𝑝𝐶𝐻𝐶,𝐺𝐻 , 𝑝𝐺𝐻,𝐶𝐻𝐶 )
Minimize 𝑇𝐺𝐻 = 𝑇2 (𝑝0,𝐶𝐻𝐶 , 𝑝𝐶𝐻𝐶,𝐺𝐻 , 𝑝𝐺𝐻,𝐶𝐻𝐶 )
Minimize 𝑇𝑈𝑝𝑤𝑎𝑟𝑑 = 𝑇3 (𝑝0,𝐶𝐻𝐶 , 𝑝𝐶𝐻𝐶,𝐺𝐻 , 𝑝𝐺𝐻,𝐶𝐻𝐶 )
Maximize 𝐻 = 𝐻(𝑝0,𝐶𝐻𝐶 , 𝑝𝐶𝐻𝐶,𝐺𝐻 , 𝑝𝐺𝐻,𝐶𝐻𝐶 )
Minimize 𝐿𝐶𝐻𝐶 = 𝐿1 (𝑝0,𝐶𝐻𝐶 , 𝑝𝐶𝐻𝐶,𝐺𝐻 , 𝑝𝐺𝐻,𝐶𝐻𝐶 )
Minimize 𝐿𝐺𝐻 = 𝐿2 (𝑝0,𝐶𝐻𝐶 , 𝑝𝐶𝐻𝐶,𝐺𝐻 , 𝑝𝐺𝐻,𝐶𝐻𝐶 )
Maximize 𝑈𝐶𝐻𝐶 = 𝑈1 (𝑝0,𝐶𝐻𝐶 , 𝑝𝐶𝐻𝐶,𝐺𝐻 , 𝑝𝐺𝐻,𝐶𝐻𝐶 )
Maximize 𝑈𝐺𝐻 = 𝑈2 (𝑝0,𝐶𝐻𝐶 , 𝑝𝐶𝐻𝐶,𝐺𝐻 , 𝑝𝐺𝐻,𝐶𝐻𝐶 )
to GH for further treatment after finishing all the processes in CHC.
As a macro-level patient flow simulation optimization research, more detailed processes of diagnosis and treatment, such as physical tests, the payment, the prescription and the pharmacy are included in the “CHC Doctor” and “GH Doctor” service module for model simplification.
Upward patients, who finished the treatment in GH are finally included in the throughputs of GH.
C. Ranking and selection Ranking and Selection (R&S) focuses on the comparison 0 ≤ 𝑝0,𝐶𝐻𝐶 ≤ 1 theme rather than the search algorithms, since it is the vital 0 ≤ 𝑝𝐶𝐻𝐶,𝐺𝐻 ≤ 0.1 point of simulation optimization that practice has not fully addressed (Fu et al. 2002). It uses the statistical analysis to 0 ≤ 𝑝𝐺𝐻,𝐶𝐻𝐶 ≤ 0.05 determine the rank of system designs. Completely different from deterministic settings, the output of simulation has where 𝑇1 (), 𝑇2 (), 𝑇3 (), 𝐻(), 𝑆1 (), 𝑆2 (), 𝑈1 (), 𝑈2 () are the uncertainty that always follows normal distribution. We have functions of those objectives expressed by DES model. The to consider not only the mean but also the variance of the upper bounds of 𝑝𝐶𝐻𝐶,𝐺𝐻 and 𝑝𝐺𝐻,𝐶𝐻𝐶 in constraints (10) and outputs. Two parameters, the indifference zone (level of (11) are based on the authoritative data from Chinese Ministry precision) 𝛿 and the confidence level (probability of correct of Health. selection) 𝛼 are used to describe the accuracy of selection. B. Discrete-Event Simulation Model Define two independent inputs ⃗⃗⃗ 𝜃1 , ⃗⃗⃗⃗ 𝜃2 . We claim that they have The healthcare system can be divided into two parts, CHC significant difference, if and only if: and GH, and both of them are accessible to patients. Besides, ⃗⃗⃗1 ) − 𝐽(𝜃 ⃗⃗⃗⃗2 )| < 𝛿] < 𝛼 𝑃𝑟[|𝐽(𝜃 the TWRP is also considered in the system, functioning as the transferring passages between different hospitals. Through the According to the Law of Large Number and Central Limit field study to the diagnosis process, we obtain the patient flow Theorem, the length of confidence intervals converges at the chart of the two-level healthcare system shown below as rate of 𝑂(1/√𝑛) as the number of sample size increases. Figure 2. Meanwhile, the probability that the two inputs have significant difference increases. Bechhofer et al. (1954) raised the Single-stage procedure to determine the lower bound of replications for each system design. As for t-system designs with same variance 𝜎 and k best-performed designs are needed, the lower bound of sample size meeting the indifference zone 𝛿 and confidence level 𝛼 is: Subject to
𝑛 = ⌈(
𝑐𝛼,𝑘,𝑡 𝜎 2 𝛿
) ⌉
where 𝑐𝛼,𝑘,𝑡 comes from the look-up table of single-stage procedure (Bechhofer 1954).
Figure 2.
D. Optimization Algorithm Different from the preference-based procedure, which calls for the higher-level information, GA is recommended to find the non-dominated solution set, when the computation time and resources are precise, but a relatively good solution set is needed. Define the consistent performance measures for design i as:
Patient flow and service processes in the healthcare system
After that, Arena 14.0.0 is used to develop our DES simulation model according to Figure 2. There are some tricks in the DES model for easier observation and calculation:
Patients are categorized into three groups: 1) CHC patients, who enter the CHC for diagnosis and leave the system after finishing all the diagnosis in CHC; 2) GH patients, who enter the GH directly; 3) upward patients, who enter the CHC at first, but move upward
3
𝜇𝑖1 = −𝑇𝐶𝐻𝐶
𝜇𝑖2 = −𝑇𝐺𝐻
𝜇𝑖3 = −𝑇𝑈𝑝𝑤𝑎𝑟𝑑
𝜇𝑖4 = 𝐻
𝜇𝑖5 = −𝐿𝐶𝐻𝐶
𝜇𝑖6 = −𝐿𝐺𝐻
𝜇𝑖7 = 𝑈𝐶𝐻𝐶
𝜇𝑖8 = 𝑈𝐺𝐻
IV. CASE STUDY: HEALTHCARE SYSTEM OF THE PEKING UNIVERSITY THIRD HOSPITAL
The PUTH, located in Haidian district, Beijing, is one of the most famous GHs, providing healthcare service facing all over the country. The PUTH has a leading position in sports medicine and genesiology, which appeals to patients from other regions. In the neighborhood, there are several communities served by the PUTH, and 15 CHCs have Since the values of 𝜇𝑖𝑘 are random, we calculate the long-term partnerships with the PUTH. Due to its fame, a huge probability that design i dominates design j by the following number of outpatients come to PUTH for medical service, but only a few go to the CHC. To solve this problem, we model expression with at least one inequality being strict: this two-level healthcare system by simulation tool, and use the 𝑃(𝜇𝑖 ≺ 𝜇𝑗 ) = ∏3𝑘=1 𝑃(𝜇𝑖𝑘 ≤ 𝜇𝑗𝑘 ) ∏8𝑘=4 𝑃(𝜇𝑖𝑘 ≥ 𝜇𝑗𝑘 ) simulation based GA for multi-objective optimization to find the optimal solution. 2) Rank the Non-dominance of Each Design We use the probability that a design is not dominated by all A. Original Inputs and Settings the other designs to measure the non-dominated rank. We The data sources of this case study include Haidian District define 𝜑𝑖 as the probability that design i is non-dominated by Community Health Reporting System (HDCHRS), Beijing any other designs in the solution set. Registration Reservation Platform (BRRP), and China Health 𝜑𝑖 = ∏𝑛𝑗=1,𝑗≠𝑖[1 − 𝑃(𝜇𝑗 ≺ 𝜇𝑖 )] Statistics Yearbook 2012 (CHSY 2012). The data in HDCHRS and BRRP come from the Beijing Municipal Health Bureau, The bigger 𝜑𝑖 is, the higher priority design i possesses to and the CHSY is published by Ministry of Health of PRC. be selected in the Pareto set. There are two methods to choose Unfortunately, not all data could be obtained directly through the Pareto solution. The first one is ranking the designs in these sources mentioned above. Some microcosmic data, such descending order of 𝜑𝑖 , with 𝜑(1) ≤ 𝜑(2) ≤ ⋯ ≤ 𝜑(𝐾) ≤ ⋯ ≤ as the service time distribution of register windows at CHC, 𝜑(𝑛) , and then choose the best K designs. Another is setting a are collected through field research. choosing criterion 𝜑 ∗ . Parameters here are classified into two types, fixed parameters and decision variables. The values of fixed E. Implementation parameters keep constant throughout the simulation The GA processor is realized in Matlab 2012b, and optimization, while the values of decision variables are waiting connected to the output of DES model. Taking account of the to be readjusted. The current values of all parameters (by April time expense of running simulation model, we set the 4th, 2013) is shown in TABLE I and II. population size as 50, and the best 25 solutions are chosen as “parents”. Each candidate solution has a set of properties (its TABLE I. CURRENT VALUE OF FIXED PARAMETERS chromosomes or genotype) which can be mutated and altered. Variables Value Solutions are represented in binary as strings of 0 and 1. 1) Performance Measures Identification of Two Uncertain Designs We define design i dominates design j by 𝜇𝑖 ≺ 𝜇𝑗 , if the following condition holds with at least one inequality being strict, for ∀𝑘 ∈ {1,2, … ,8}, 𝜇𝑖𝑘 ≤ 𝜇𝑗𝑘 (Chen 2009, Lee 2010).
𝜆
1) Initialization Our aim is to improve the system performances by programming the patient flow which is measured by decision variables 𝑝0,𝐶𝐻𝐶 , 𝑝𝐶𝐻𝐶,𝐺𝐻 and 𝑝𝐺𝐻,𝐶𝐻𝐶 . Initially, 50 candidate solutions are randomly generated to form an initial population, allowing the entire range of possible solutions.
Total customer arrival rate (person/hr.)
𝜇𝑟 Service rate of CHC register window (person/hr.)
2) Ranking and Selection During each successive generation, a proportion of the existing population is selected to breed a new generation through a fitness-based process, where fitted solutions are typically more likely to be selected. We select from the top 25 of the candidate solutions with the smallest probability being dominated by others to produce the next generation. Then we use the fitness proportionate selection, also known as Roulette wheel selection to select potentially useful solutions for reproduction.
4.03
𝜇𝑅 Service rate of GH register window (person/hr.)
58.86
𝜇𝐺 Service rate of GH doctor (person/hr.)
3.53
𝑇𝐵 Average time in hospital (day) P The probability of patients in hospital (%) 𝑛𝑐𝑟 NO. of register windows in CHCs
6.57 4.05 30
𝑛𝑐𝑑 NO. of CHC doctors 𝑛𝑔𝑟 NO. of register windows in GH
88
𝑛𝑔𝑑 NO. of GH doctors
402
m
NO. of beds in GH
1280
K
NO. of registrations released by GH each day
8077
K’ NO. of GH registrations reserved online each day
4038
The time limit of online reserving (day) TABLE II.
20
7
CURRENT VALUE OF DECISION VARIABLES Variables
𝑝0,𝐶𝐻𝐶
4
103.36
𝜇𝐶 Service rate of CHC doctor (person/hr.)
N
3) Reproduction For each new solution to be produced, a pair of “parent” solutions are selected for breeding from the pool. In this algorithm, we produce 25 “children” solutions. The 25 “parents” solutions together with the 25 “children” solutions form a second generation of 50 candidate solutions.
1982.14
The CFAR (%)
Value 4.94
𝑝𝐶𝐻𝐶,𝐺𝐻 The upward referral ratio (%)
1.13
𝑝𝐺𝐻,𝐶𝐻𝐶 The downward referral ratio (%)
0.1
those straight lines and parallel axis exhibit the value of each dimension of objective functions. By combining the GA results and the PC plots shown as Figure 4, we obtain the Pareto set.
B. DES under Current State and Model Validation We input the data in TABLE I and II to our DES model and set the length of each day to be 8 hours (equal to the real work-hour), the length of simulation to be 100 days. The simulation runs for 20 replications, and we finally obtain the simulation results shown in TABLE III. TABLE III.
THE VALUE OBJECTIVE VARIABLES UNDER CURRENT STATE
Obj.
𝑻𝑪𝑯𝑪
𝑻𝑮𝑯
𝑻𝑼𝒑
𝑯
𝑳𝑪𝑯𝑪
𝑳𝑮𝑯
𝑼𝑪𝑯𝑪
𝑼𝑮𝑯
Value
0.278
30.7
6.04
8810
0
0.467
0.241
0.810
a. The unit of 𝑇𝐶𝐻𝐶 , 𝑇𝐺𝐻 , 𝑇𝑈𝑝𝑤𝑎𝑟𝑑 is hour.
To validate the DES model, we compare some system observations with the authoritative data published by the Ministry of Health (MOH). Seen from TABLE IV, the difference between MOH data and DES results is acceptable. TABLE IV.
COMPARISON BETWEEN MOH’S DATA AND DES RESULTS MOH Data
DES Results
Throughput Ratio of GH/CHC
9.901
10.371
4.75%
Utilization of Beds in GH (%)
104.2
99.9
-4.13%
Daily Visits per Doctor in CHC
8.1
8.7
7.41%
Daily Visits per Doctor in GH
20
20.085
0.43%
Throughput of PUTH per Day
7977
8035
0.73%
Figure 4. Pareto Frontier (Green Lines) of Normalized Outputs in PC Plot
Error
In the PC plots above, the green lines show the non-dominated Pareto solutions which have the least probability of being dominated by other points. By using GA, and the visualization of PC plot, we finally find a Pareto optimal set with 25 points shown in TABLE V.
C. Optimization through GA 1) Evolution of Decision Variables After a tentative 11-generation GA, the terminate criteria is satisfied. The scatters of inputs (decision variables) at each generation are shown below.
TABLE V.
PARETO OPTIMAL SOLUTIONS
Decision Variables
Decision Variables
𝒑𝟎,𝑪𝑯𝑪
𝒑𝑪𝑯𝑪,𝑮𝑯
𝒑𝟎,𝑪𝑯𝑪
𝒑𝟎,𝑪𝑯𝑪
𝒑𝑪𝑯𝑪,𝑮𝑯
𝒑𝑮𝑯,𝑪𝑯𝑪
1
0.479
0.0445
0.0013
14
0.692
0.0241
0.0373
2
0.272
0.0538
0.0467
15
0.442
0.0445
0.0013
3
0.497
0.0446
0.0013
16
0.594
0.0629
0.0310
4
0.676
0.0126
0.0279
17
0.661
0.0077
0.0271
5
0.540
0.0157
0.0319
18
0.719
0.0632
0.0310
6
0.645
0.0069
0.0279
19
0.567
0.0241
0.0326
7
0.551
0.0001
0.0474
20
0.572
0.0626
0.0435
8
0.590
0.0003
0.0445
21
0.048
0.0182
0.0117
9
0.455
0.0447
0.0013
22
0.348
0.0001
0.0254
10
0.692
0.0003
0.0445
23
0.596
0.0626
0.0310
Figure 3. Three-Dimensional Scatter of Decision Variables’ Evolution
11
0.803
0.0069
0.0310
24
0.455
0.0447
0.0013
Seen from Figure 3, the inputs at generation 0 are uniformly distributed in the definition domain. A huge improvement occurred after the first iteration, that some poor points are removed. At generation 7, the points are gradually converged to 3 groups. At generation 9, a newly mutated point appears at the right middle side of the domain, and after 2 iterations to generation 11, the points are relatively steady to 4 groups represented by 4 red circles.
12
0.192
0.0644
0.0310
25
0.621
0.0499
0.0345
13
0.428
0.0376
0.0060
In the Pareto optimal solution set, the majority have the values of 𝑝0,𝐶𝐻𝐶 within the range of 0.4 to 0.7 and 𝑝𝐶𝐻𝐶,𝐺𝐻 within the range of 0.035 to 0.065, which indicates the convergence of GA. Differently, the value of 𝑝𝐺𝐻,𝐶𝐻𝐶 distributed uniformly (after a 𝜒 2 test) over the domain of [0, 0.05]. The rest few solutions with 𝑝0,𝐶𝐻𝐶 beyond the range are suitable for extreme preference scenarios, which help to keep the variety of population.
2) Non-dominated Pareto set There are 8 columns of outputs, and the data visualization is hard to realize. Ordinary plots cannot present the properties of points. Therefore, we use Parallel Coordinates (PC) plot proposed by Inselberg (1985) as a tool for the visualization of high-dimension data. As for parallel coordinates, the axis, each presents a dimension of variable, are place in parallel in a two-dimension plot. Data here are not presented as scatters any more, but a series of connected straight lines. Intersections of
V. CONCLUSION AND FUTURE RESEARCH This paper proposes a methodology for the readjustment of patient flow among the urban two-level healthcare system. A Pareto optimal set has been found to achieve the multi-objective system performance. 5
From the methodological perspective, the primary contribution of this research is that we model the macro-level patient flow optimal distribution as a multi-objective optimization problem, and successfully obtain the Pareto optimal solution set. Almost all common performance measures estimating patient flow in a hierarchical health care systems, including the service time (LOS), the service capacity (throughputs), the service quality (LWBS rate), and the resources’ utilization, are considered in the eight-dimensional objective functions. Compared with previous works on the integration of simulation and multi-objective optimization, the improvements can be summarized as follows:
An evolutionary algorithm is used to find the non-dominated Pareto solution sets, instead of using weight-determine strategy to transfer a multi-objective problem into a single objective one.
The DES is used as fitness function in evolutionary algorithm, and the randomness of simulation outputs is also considered. We rank the fitness of candidate solutions by comparing their non-dominated probability by others, instead of just comparing the mean value of each output.
The high-dimensional objective variables are visualized by the Parallel Coordinate (PC) plots. The Pareto frontier is emphasized in the final PC plots.
REFERENCES [1] W. Abo-Hamad and A. Arisha, "Multi-criteria framework for emergency department in Irish hospital," in Simulation Conference (WSC), Proceedings of the 2012 Winter, 2012, pp. 1-12. [2] M. A. Ahmed and T. M. Alkhamis, "Simulation optimization for an emergency department healthcare unit in Kuwait," European Journal of Operational Research, vol. 198, pp. 936-942, 2009. [3] R. E. Bechhofer, "A single-sample multiple decision procedure for ranking means of normal populations with known variances," The Annals of Mathematical Statistics, pp. 16-39, 1954. [4] J. G. Behr and R. Diaz, "A system dynamics approach to modeling the sensitivity of inappropriate emergency department utilization," in Advances in Social Computing, ed: Springer, 2010, pp. 52-61. [5] N. Borgman, "Organizing acute care: logistic optimization of an integrated emergency post using discrete event simulation," 2012. [6] E. J. Chen and L. H. Lee, "A multi-objective selection procedure of determining a Pareto set," Computers & Operations Research, vol. 36, pp. 1872-1879, 2009. [7] J. K. Cochran and J. R. Broyles, "Developing nonlinear queuing regressions to increase emergency department patient safety: Approximating reneging with balking," Computers & Industrial Engineering, vol. 59, pp. 378-386, 2010. [8] J. K. Cochran and K. T. Roche, "A multi-class queuing network analysis methodology for improving hospital emergency department performance," Computers & Operations Research, vol. 36, pp. 1497-1512, 2009. [9] K. Deb, "Multi-objective optimization," in Search methodologies, ed: Springer, 2014, pp. 403-449. [10] M. C. Fu, "Optimization for simulation: Theory vs. practice," INFORMS Journal on Computing, vol. 14, pp. 192-215, 2002. [11] L. I. Horwitz, J. Green, and E. H. Bradley, "US emergency department performance on wait time and length of visit," Annals of emergency medicine, vol. 55, pp. 133-141, 2010. [12] A. Inselberg and B. Dimsdale, "Parallel coordinates," in Human-Machine Interactive Systems, ed: Springer, 1991, pp. 199-233. [13] M. Kennedy, C. E. MacBean, C. Brand, V. Sundararajan, and D. McD Taylor, "Review article: leaving the emergency department without being seen," Emergency Medicine Australasia, vol. 20, pp. 306-313, 2008. [14] A. Konak, D. W. Coit, and A. E. Smith, "Multi-objective optimization using genetic algorithms: A tutorial," Reliability Engineering & System Safety, vol. 91, pp. 992-1007, 2006. [15]R. Konrad, K. DeSotto, A. Grocela, P. McAuley, J. Wang, J. Lyons, et al., "Modeling the impact of changing patient flow processes in an emergency department: Insights from a computer simulation study," Operations Research for Health Care, vol. 2, pp. 66-74, 2013. [16] L. H. Lee, E. P. Chew, S. Teng, and D. Goldsman, "Finding the non-dominated Pareto set for multi-objective simulation models," IIE Transactions, vol. 42, pp. 656-674, 2010. [17] Q. Li, "Multi-objective Operating Room Planning and Scheduling," Arizona State University, 2010. [18] M. A. Popovich, C. Boyd, T. Dachenhaus, and D. Kusler, "Improving stable patient flow through the emergency department by utilizing evidence-based practice: one hospital's journey," Journal of Emergency Nursing, vol. 38, pp. 474-478, 2012. [19] P. Santibáñez, V. S. Chow, J. French, M. L. Puterman, and S. Tyldesley, "Reducing patient wait times and improving resource utilization at British Columbia Cancer Agency’s ambulatory care unit through simulation," Health care management science, vol. 12, pp. 392-407, 2009. [20] J. Sepulveda, "Multi-objective simulation optimization for a cancer treatment center," in Simulation Conference, 2001. Proceedings of the Winter, 2001, pp. 1405-1411. [21] J. Wang, J. Li, and P. K. Howard, "A system model of work flow in the patient room of hospital emergency department," Health care management science, vol. 16, pp. 341-351, 2013. [22] Z. Zeng, X. Ma, Y. Hu, J. Li, and D. Bryant, "A simulation study to improve quality of care in the emergency department of a community hospital," Journal of Emergency Nursing, vol. 38, pp. 322-328, 2012. [23] Y. Zhang, M. L. Puterman, M. Nelson, and D. Atkins, "A simulation optimization approach to long-term care capacity planning," Operations Research, vol. 60, pp. 249-261, 2012..
From a practical perspective, we try to use a rigorous approach to estimate the system performance and to adjust the patient flow that makes the system perform better. The result of our approach improves the system by finding a trade-off between CHC and GH so as to shorten waiting time and improve service capacity and quality. Our government can put forward relevant policies to guide patients flowing according to the results. From our research we share following observations and recommendations.
A general problem to Chinese urban healthcare system is the insufficiency use of CHCs. System managers should encourage more patients go to CHC for their first diagnosis.
The promotion to the downward part of TWRP should be strengthened compared with the upward part. Besides, the bed server in hospital seems to be the bottleneck to the system. So the LOS in hospital should be shortened.
This study also has several further directions concerning the patient flow in multiple level healthcare system. First, in this research we only figure out the optimal patient flow distribution in the system, but not how to achieve it. We will use behavioral operations research methods to discover the influence of price change, service quality, and waiting time on the patients’ choice to hospital. Another shortage of our approach is that it does not classify the patients by gender, age, and other demographics. Requirements of different types of patients to the healthcare service are not the same, leading to their different behaviors in the system. Furthermore, we will use multi-agent based simulation methods in order to regard every patient in the system as separate entity. They can make decisions by themselves according to other entities’ behavior and the current performance of the system. 6