the graphical structure of a Bayesian network and assessing the required ..... Alarm network was built to help anesthetists monitor their patients and is quite com-.
A Skeleton-Based Approach to Learning Bayesian Networks from Data Steven van Dijk, Linda C. van der Gaag, and Dirk Thierens Universiteit Utrecht, Institute of Information and Computing Sciences, Decision Support Systems, PO Box 80.089, 3508 TB Utrecht, The Netherlands ���������� � �� ���������
Abstract. Various different algorithms for learning Bayesian networks from data have been proposed to date. In this paper, we adopt a novel approach that combines the main advantages of these algorithms yet avoids their difficulties. In our approach, first an undirected graph, termed the skeleton, is constructed from the data, using zero- and first-order dependence tests. Then, a search algorithm is employed that builds upon a quality measure to find the best network from the search space that is defined by the skeleton. To corroborate the feasibility of our approach, we present the experimental results that we obtained on various different datasets generated from real-world networks. Within the experimental setting, we further study the reduction of the search space that is achieved by the skeleton.
1 Introduction The framework of Bayesian networks has proven to be a useful tool for capturing and reasoning with uncertainty. A Bayesian network consists of a graphical structure, encoding a domain’s variables and the probabilistic relationships between them, and a numerical part, encoding probabilities over these variables (Cowell et al., 1999). Building the graphical structure of a Bayesian network and assessing the required probabilities by hand is quite labour-intensive. With the advance of information technology, however, more and more datasets are becoming available that can be exploited for constructing a network automatically. Learning a Bayesian network from data then amounts to finding a graphical structure that, supplemented with maximum-likelihood estimates for its probabilities, most accurately describes the observed probability distribution. Most state-of-the-art algorithms for learning Bayesian networks from data take one of two approaches: the use of (in)dependence tests (Rebane and Pearl, 1987; Spirtes and Glymour, 1991; De Campos and Huete, 2000) and the use of a quality measure (Cooper and Herskovits, 1992; Buntine, 1991; Heckerman et al., 1995; Lam and Bacchus, 1993). Although with both approaches encouraging results have been reported, they both suffer from some difficulties. With the first approach, a statistical test such as χ 2 is employed for examining whether or not two variables are dependent given some conditioning set of variables; the order of the test is the size of the conditioning set used. By starting with zero-order tests and selectively growing the conditioning set, in theory all (in)dependence statements can be recovered from the data and the network that generated the data can be reconstructed. In practice, however, the statistical test
employed quickly becomes unreliable for higher orders, because the number of data required increases exponentially with the order. If the test would then return incorrect (in)dependence statements, errors could arise in the graphical structure. With the second approach, a quality measure such as MDL is used for assessing the quality of candidate graphs. The graphical structure yielding the highest score then is taken to be the one that best explains the observed data. This approach suffers from the size of the search space. To efficiently traverse the huge space of graphical structures, often a greedy search algorithm is used. Other algorithms explicitly constrain the space by assuming a topological ordering on the nodes of candidate structures. Both types of algorithm may inadvertently prune high-quality networks from the search space of structures. In this paper, we adopt a novel approach to learning Bayesian networks from data that combines the main advantages of the two approaches outlined above. In our approach, first an undirected graph is constructed from the data using just zero- and firstorder dependence tests. The resulting graph, termed the skeleton of the network under construction, is used to explicitly restrict the search space of graphical structures. In the second phase of our approach, a search algorithm is employed to traverse the restricted space. This algorithm orients or removes each edge from the skeleton to produce a directed graphical structure. To arrive at a fully specified Bayesian network, this structure is supplemented with maximum-likelihood estimates computed from the data. We experimented with two instances of our approach, building upon a simple hill-climber and upon a genetic algorithm, respectively, for the search algorithm. The results that we obtained compare favourably against various state-of-the-art learning algorithms. The paper is organised as follows. In Section 2, we present the details of our approach. In doing so, we focus on the construction of the skeleton; an in-depth discussion of the design of a competent search algorithm for the second phase of our approach is presented elsewhere (Van Dijk et al., 2003). The experimental results obtained with our approach are reported in Section 3. We analyse various properties of the skeleton in Section 4. We end the paper with a discussion of our approach in Section 5.
2 Skeleton-based learning Our approach divides the task of learning a Bayesian network from data into two phases. In the first phase, a skeleton is constructed. This skeleton is taken as a template that describes all graphical structures that can be obtained by orienting or deleting its edges. In the second phase, the search space that is defined by the skeleton is traversed by means of a search algorithm. Focusing on the first phase, we discuss the construction of the skeleton in Section 2.1; in Section 2.2, we briefly review related work. 2.1 Constructing the skeleton We consider learning a Bayesian network from a given dataset. For ease of exposition, we assume that this dataset has been generated by sampling from a network whose graphical structure perfectly captures the dependences and independences of the represented distribution. The undirected graph underlying the structure of this network will be referred to as the true skeleton. In the first phase of our approach, we construct a
Y1
Y2
Z
Y2 Y2 is a neighbor
(a)
Y1
Y1
Y1 Z
X
Z
Y2 Z is blocked
Y2 Y1 is a neighbor
(b)
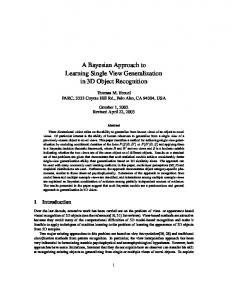
Fig. 1. (a) Two non-neighbouring variables Y1 and Y2 that are dependent yet become independent given X. (b) The separation graph G(X) of X, with L(X) = {Z,Y1 ,Y2 }. The variable Y2 is identified as a neighbour of X since it has no incoming arcs. The arc from Y2 to Z indicates Z to be a nonneighbour. Removal of the arc from Z to Y1 reveals Y1 to be a neighbour of X.
skeleton from the available data to restrict the search space for the second phase. In doing so, we aim to find a skeleton that is already close to the true skeleton. On the one hand, we try to avoid missing edges, because these could prune the best network from the search space. On the other hand, we try to minimise the number of additional edges, since these would unnecessarily increase the size of the space to be traversed. To construct an appropriate skeleton, we analyse the dependences and independences that are embedded in the dataset for the various different variables. To this end, a statistical test is employed. Well-known examples of such tests are the χ 2 statistic and the mutual information criterion. In the sequel, we will write DT(X,Y | Z) if, for a given threshold value, the test indicates that the variables X and Y are dependent given the (possibly empty) conditioning set of variables Z; otherwise, we write ¬DT(X,Y | Z). When constructing the skeleton, we try to identify the true neighbours of each variable X. To this end, we begin by identifying all variables that have a zero-order dependence on X. If for a specific variable Y , the test employed fails to report a result, for example due to a lack of data, we assume that Y is independent of X. We now observe that, while neighbouring variables in the true skeleton are always dependent, the reverse does not hold: two dependent variables may be separated by one or more intervening variables, for example as in Figure 1(a). The list L(X) = {Y | DT(X,Y )} obtained therefore includes neighbours as well as non-neighbours of X from the true skeleton. Since a non-neighbour Y of X is separated from X in the true skeleton by a set of true neighbours of X, we expect that ¬DT(X,Y | Z) for some set Z ⊆ L(X) \ {Y }. We now use first-order tests to remove, from among the list L(X), any non-neighbours of X. The skeleton then in essence is found by adding an edge between X and Y ∈ L(X) if and only if DT (X,Y | {Z}) holds for all Z ∈ L(X) \ {Y }. We note that using just first-order tests as outlined above, does not suffice for identifying all non-neighbours of X from among the list L(X). In fact, a higher-order test may be required to establish a variable Y as a non-neighbour of X; for example, if DT(X,Y | {Z1 }), DT(X,Y | {Z2 }), and ¬DT(X,Y | {Z1 , Z2 }), a second-order test is needed for this purpose. By using higher-order tests, therefore, additional nonneighbours could be identified and a sparser skeleton could result. As we have argued before, however, the test employed quickly becomes unreliable for larger conditioning sets, thereby possibly giving rise to errors in the skeleton. Since the purpose of the
skeleton is to safely reduce the search space, we restrict the tests employed to just zeroand first-order tests, and let the search algorithm remove the spurious edges. We further note that the method described above, when applied straightforwardly, could erroneously remove some true neighbours of a variable X from the list L(X). As an example we consider the neighbours Y 1 and Y2 of X in the true skeleton, where Y2 has Z for a second neighbour. Now, if the true neighbour Y 1 would exhibit a weak dependence on X and the non-neighbour Z would exert a very strong influence on X, then values for Z could hide the dependence of Y 1 on X. The dependence test then returns ¬DT(X,Y1 | {Z}) and Y1 would be identified as a non-neighbour of X. To support identification of the true neighbours of X, therefore, we construct an auxiliary directed graph termed the separation graph G(X) of X. The variables from the list L(X) are the nodes of the graph. There is an arc from a variable Z to a variable Y if ¬DT(X,Y | {Z}) for some Z ∈ L(X) \ {Y }. If the first-order test fails to establish dependence or independence, we assume dependence. In the separation graph G(X), all variables without any incoming arcs are true neighbours of X, since these variables remain dependent on X regardless of the conditioning set used. The thus identified neighbours are used to find non-neighbours of X, by following their outgoing arcs. The outgoing arcs of these non-neighbours are removed, which may cause other variables to reveal themselves as neighbours. Figure 1(b) illustrates the basic idea of the separation graph. The process of identifying neighbours and non-neighbours is repeated until no more neighbours of X can be identified. Variables that are part of a cycle in the remaining separation graph are all marked as neighbours of X: these variables correspond to ambiguous situations, which are thus resolved safely, that is, without discarding possible neighbours. We note that the process of identifying neighbours requires at most |L(X)| iterations. The skeleton is now built by finding the neighbours of every variable and connecting these. 2.2 Related work De Campos and Huete (2000) use a skeleton within a test-only approach. The skeleton is built by connecting variables for which no zero- or first-order test indicates independence. From the thus constructed skeleton, a directed graphical structure is derived without employing a search algorithm. The authors do suggest the use of such an algorithm, however. Cheng et al. (2002) also present a test-only approach that builds upon a skeleton constructed from lower-order dependence tests. Steck and Tresp (1999) deal with the construction of a usable skeleton when unreliable tests offer conflicting dependence statements. The Hybrid Evolutionary Programming (HEP) algorithm by Wong et al. (2002) takes an approach that is closely related to ours. Although the algorithm does not explicitly construct a skeleton, it does use zero- and first-order dependence tests to restrict the search space of graphical structures that is subsequently traversed by an MDL-based search algorithm. The HEP algorithm has shown high-quality performance on datasets generated from the well-known Alarm network.
3 Experiments Our approach to learning Bayesian networks allows for various different instances. For the first phase, different dependence tests can be employed and for the second phase,
different quality measures and different search algorithms can be used. We present two such instances in Section 3.1 and report on their performance in Section 3.2. 3.1 The instances To arrive at an instance of our approach, we have to specify a dependence test to be used in the construction of a skeleton as outlined in the previous section. In our experiments, we build upon the χ 2 test, using independence for its null-hypothesis. The χ 2 test calculates a statistic from the contingency table of the variables X and Y concerned: stat(X, Y) = ∑ i, j
(Oi j − Ei j )2 , Ei j
ˆ i , y j ) · N is the observed frequency of the combination of values (x i , y j ) where Oi j = p(x ˆ i ) · p(y ˆ j ) · N is the expected frequency of (x i , y j ) if X and Y were indepenand Ei j = p(x dent; N denotes the size of the available dataset and p(x ˆ i ) denotes the � proportion of x i . The computed statistic is compared against a critical value s with s∞ χdf2 (x) = ε , for a given threshold ε and the χ df2 distribution with df degrees of freedom. If the statistic is higher than s, the null-hypothesis is rejected, that is, X and Y are established as being dependent. The test for dependence of X and Y given Z is defined analogously, taking independence of X and Y for every possible value of Z for the null-hypothesis. In our experiments, we use the threshold values ε 0 = 0.005 for the zero-order dependence test and ε1 = 0.05 for the second-order dependence test. Choosing the χ 2 test allows for a direct comparison of our approach against the HEP algorithm mentioned above. With the specification of a dependence test and its associated threshold values, the first phase of our approach has been detailed. To arrive at a fully specified instance, we now have to detail the search algorithm to be used for traversing the space of graphical structures and the quality measure it employs for comparing candidate structures. In our experiments, we use the well-known MDL quality measure (Lam and Bacchus, 1993). This measure originates from information theory and computes the description length of a Bayesian network and a given dataset; the description length equals the sum of the size of the network and the size of the dataset after it has been compressed given the network. While a more complex network can better describe the data and hence compress it to a smaller size than a simpler network, it requires a larger encoding to specify its arcs and associated probabilities. The best network for a given dataset now is the network that best balances its complexity and its ability to describe the data. In our experiments, we further use two different search algorithms: a simple hillclimber and a genetic algorithm. The hillclimber sets out with the empty graph. In each step, it considers all pairs of neighbouring nodes from the skeleton and all possible changes to the graph under construction, that is, remove, insert, or reverse the considered arc; it then selects the change that improves the MDL score the most. This process is repeated until the score cannot be further improved. The genetic algorithm builds upon an encoding of graphical structures by strings of genes. Each gene corresponds with an edge in the skeleton and can be set in one of three states, matching absence and either orientation of the edge. A special-purpose recombination operator is used to guarantee good mixing and preservation of building blocks (Van Dijk et al., 2003).
3.2 Experimental results We studied the two instances of our approach outlined above and compared their performance against that of the HEP algorithm. We used datasets that were generated by means of logic sampling from two real-world Bayesian networks. The well-known Alarm network was built to help anesthetists monitor their patients and is quite commonly used for evaluating the performance of algorithms for learning Bayesian networks. The Oesoca network was developed at Utrecht University, in close collaboration with experts from the Netherlands Cancer Institute; it was built to aid gastroenterologists in assessing the stage of oesophageal cancer and in predicting treatment outcome. Table 1 summarises the results obtained for datasets of four different sizes for each network. The results for the genetic algorithm and for the HEP algorithm are averaged over five different datasets and five runs of the algorithm per dataset; the results for the hillclimber are averaged over the five datasets. Depending on the size of the data set, running times ranged from two to 80 minutes for the GA, up to 30 minutes for the hillclimber, and up to seven minutes for the HEP algorithm. Calculation of the skeleton could take up to 50% of the total time of a run with the GA. The bottom part of Table 1 shows that all three algorithms under study perform quite well. The table in fact reveals that the algorithms often yield a network that has a lower score than the original network, whose score is shown in the top part of the table. The fact that the original network may not be the one of highest quality can be Original (score ± sd) GA+true (score ± sd) HC+true (score) Alarm-250 Alarm-500 Alarm-2000 Alarm-10000 Oesoca-250 Oesoca-500 Oesoca-2000 Oesoca-10000
7462.14±197.20 10862.49±196.59 31036.54±236.00 138914.66±764.09 10409.23±88.20 15692.60±154.25 46834.31±244.07 213253.55±387.12 GA (score ± sd)
Alarm-250 Alarm-500 Alarm-2000 Alarm-10000 Oesoca-250 Oesoca-500 Oesoca-2000 Oesoca-10000
5495.05±0.02 9272.49±0 30214.72±0 138774.32±0 7439.62±0 13034.87±0.19 45115.91±2.77 212364.09±1.23 HEP (score ± sd)
5566.71±0.20 5523.50±11.74 9458.03±1.62 9260.87±35.97 30563.03±2.29 30397.20±161.86 138955.54±72.36 139499.51±530.41 7703.43±0.82 9619.25±0.10 13282.38±0.07 15388.89±16.75 45335.16±2.12 46504.41±40.18 212544.21±27.47 212446.04±276.97
5645.56 9519.90 31677.65 145564.45 7535.68 13274.75 45542.13 213204.67 HC (score) 5654.52 9619.94 31727.86 144677.31 7743.33 13474.23 45861.42 214942.04
Table 1. Results of the experiments. The top part shows in the first column the MDL score of the original network, averaged over five datasets. The second column shows the results from the GA with the true skeleton, averaged over five datasets and five runs per dataset. The third column gives the results from the hillclimber on the true skeleton, averaged over five datasets. The bottom part lists the results obtained with the GA, with the HEP algorithm, and with the hillclimber.
attributed to the datasets being finite samples. Since the datasets are subject to sampling error, they may not accurately reflect all the (in)dependences from the original network. The distribution observed in the data may then differ from the distribution captured by the original network. From the bottom part of the table we further observe that the genetic algorithm and the HEP algorithm perform comparably. The small standard deviation revealed by the genetic algorithm indicates that it is likely to always give results of similar quality. Since the HEP algorithm reveals much more variation, the genetic algorithm may be considered the more reliable of the two algorithms. The top part of Table 1 summarises the results obtained with the GA and with the hillclimber when given the true skeleton rather than the skeleton constructed from the data. We note that only a slight improvement in quality results from using the true skeleton. From this observation, we may conclude that, for practical purposes, the constructed skeleton is of high quality. The good performance of the hillclimber, moreover, is an indication of how much the learning task benefits from the use of the skeleton.
4 Analysis of our approach We recall from Section 2 that our approach divides the task of learning a Bayesian network from data into two phases. In the first phase, a skeleton is constructed that is taken as a specification of part of the search space of graphical structures. In the second phase, the specified subspace is traversed by a search algorithm. The feasibility of our approach depends to a large extent on the properties of the computed skeleton. First of all, to avoid pruning optimal solutions from the search space, there should be no edges of the true skeleton missing from the computed skeleton. Secondly, there should be few additional edges: the more densely connected the computed skeleton is, the less feasible it is to traverse the specified subspace of graphical structures. Since it is very hard to prove theoretical results about the computed skeleton, we opt for an experimental investigation of its properties. In the subsequent sections, we compare the computed skeleton against the true skeleton in increasingly realistic situations. 4.1 Use of a perfect oracle To investigate by how much a computed skeleton can deviate from the true skeleton, we performed an experiment in which we precluded the effects of sampling error and of inaccuracy from dependence tests. To this end, we constructed an oracle that reads the (in)dependences tested for from the structure of the original network. For the Alarm and Oesoca networks, we thus computed two skeletons each. For the first skeleton, we used zero-order dependence tests only: we connected each variable X to all variables having an unconditional dependence on X. For the construction of the second skeleton, we used zero- and first-order tests as outlined in Section 2. Table 2 reports the numbers of additional edges found in the computed skeletons compared against the true skeleton; the table further includes the results for a skeleton consisting of the complete graph. Since we used a perfect oracle to establish dependence or independence, the computed skeletons include all edges from the true skeletons: there are no edges missing. Table 2 therefore gives insight in the reduction of the search space for the second phase
Complete skeleton Zero-order skeleton Computed skeleton
Alarm
Oesoca
620 255 58
802 728 116
Table 2. Numbers of additional edges found in the skeletons constructed using an oracle. Results are shown for the complete skeleton, for the skeleton built by using just zero-order tests, and for the skeleton computed by the proposed approach. The true skeleton of the Alarm network includes 46 edges; the true skeleton of the Oesoca network includes 59 edges.
of our approach, that is achieved under the assumption that the strengths of the dependences do not affect the results from the dependence test. The table reveals that, under this assumption, sizable reductions are found. Note that further reductions could have been achieved by using higher-order dependence tests. Such tests, however, would have increased the computational demands for the construction of the skeleton. Moreover, in practice such tests would have quickly become highly unreliable. 4.2 Use of the χ 2 test on a perfect dataset In the experiments described in Section 3, we used the χ 2 test for studying dependence. We recall that, for two variables X and Y , the χ 2 test calculates a statistic stat(X,Y ). This statistic is compared against a critical value s to decide upon acceptance or rejection of the null-hypothesis of independence of X and Y . The critical value depends upon the threshold ε and upon the degrees of freedom df of the χ 2 distribution used. Writing f (ε , df ) for the function that yields the critical value s, we have that the test reports dependence if stat(X,Y ) > f (ε , df ). Hence, N · c > f (ε , df ) , where c is a constant that depends upon the marginal and joint probability distributions over X and Y . The choice of the threshold ε now directly influences the topology of the computed skeleton. If the threshold is set too low with respect to the size of the available dataset, weak dependences will escape identification and the skeleton will have edges missing. On the other hand, if the threshold is too high, coincidental correlations in the data will be mistaken for dependences and the skeleton will include spurious edges. To study the impact of the thresholds used with the χ 2 test, we performed some experiments from which we precluded the effects of sampling error. For this purpose, we constructed virtual datasets that perfectly capture the probability distribution to be recovered: for the proportions p(C) ˆ reflected in these datasets, we thus have that p(C) ˆ = p(C), where p(C) is the true distribution over the variables C. For the Alarm and Oesoca networks, we constructed various skeletons from virtual datasets of different sizes, using different thresholds. In our first experiment, we focused on skeletons that were constructed from zero-order dependence tests only. Figures 2(a) and 2(b) show the numbers of edges from the true skeletons of the Alarm network and of the Oesoca network, respectively, that are missing from these zero-order skeletons. Figure 2(a) reveals that the Alarm network consists of quite strong dependences that are effectively
Number of missing edges
Number of missing edges
8 7 6 5 4 3 2 1
0 0.2 0.4
1000 3000
0 0.2 0.4
1000 3000
0.6 Threshold
5000 Database size
14 13 12 11 10 9 8 7 6 5 4 3 2 1
0.8
7000
0.6 Threshold
5000 Database size
9000
(a)
0.8
7000 9000
(b)
Fig. 2. (a) Results for the Alarm network. (b) Results for the Oesoca network. Shown are the numbers of edges missing from the skeleton built from just zero-order dependences.
Number of missing edges
Number of missing edges
2
1 0 0.2 0.4
1000 3000
0.6 Threshold
5000 Database size
0.8
7000 9000
(a)
10 9 8 7 6 5 4 3 2 1
0 0.2 0.4
1000 3000
0.6 Threshold
5000 Database size
0.8
7000 9000
(b)
Fig. 3. (a) Results for the Alarm network. (b) Results for the Oesoca network. Shown are the numbers of edges missing from the skeleton built using zero- and first-order dependence tests.
found, even with small thresholds and small datasets. Figure 2(b) shows that a similar observation does not apply to the Oesoca network. This network models a very weak dependence that is only found with a threshold equal to zero, even for a dataset of size 10 000. The other relatively weak dependences modelled by the network, are recovered by a tradeoff between the threshold used and the size of the dataset under study. We further constructed skeletons using zero- and first-order tests, as described in Section 2. Once again, we used virtual datasets of different sizes and employed different thresholds for the first-order dependence test. For the zero-order test, we used, for the Alarm network, the highest threshold with which all edges from the true skeleton were recovered; for the Oesoca network, we used the highest threshold with which all dependences except the two weakest ones were found. Figures 3(a) and 3(b) show the numbers of edges from the true skeletons of the Alarm network and of the Oesoca network, respectively, that are missing from the thus computed skeletons. Figure 3(a) shows that the true skeleton of the Alarm network is effectively recovered, with almost all thresholds and dataset sizes. Figure 3(b) shows, once again, that the weaker dependences modelled by the Oesoca network are only found by a tradeoff between the threshold and the size of the dataset used.
Number of extra edges
Number of extra edges
40 35 30 25 20 15 10 5 0 1
100 90 80 70 60 50 40 30 20 1 1000
0.8 3000
0.6 5000
Threshold 0.4 0.2
7000
Database size
9000
(a)
1000
0.8 3000
0.6 5000
Threshold 0.4 0.2
7000
Database size
9000
(b)
Fig. 4. (a) Results for the Alarm network. (b) Results for the Oesoca network. Shown are the numbers of spurious edges in the skeleton built using zero- and first-order dependence tests.
Where Figure 3 shows the numbers of edges missing from the skeletons constructed using zero- and first-order tests, Figure 4 shows the numbers of edges in these skeletons that are absent from the true skeletons. Figures 4(a) and 4(b) thus show the numbers of spurious edges in the skeletons constructed for the Alarm and Oesoca networks, respectively. Figure 4(b) especially illustrates the tradeoff between recovering (almost) all edges of the true skeleton and excluding spurious ones. We further observe that the landscapes of the Figures 3(b) and 4(b) are not monotonically increasing or decreasing: Figure 3(b) reveals a valley and Figure 4(b) shows a ridge. These non-monotonicities are caused by a very weak dependency in the Oesoca network. With higher thresholds, the weakness of the dependency forestalls its identification, thereby hiding a true neighbour. Upon lowering the threshold, however, the neighbour is identified and thereby effectively changes the separation graph, which causes the observed ridge and valley. Since we used virtual datasets, we precluded from our experiments the effects of sampling error. The Figures 3 and 4, therefore, give insight in the ability of our approach to construct a skeleton that is already close to the true skeleton, under the assumption that the dataset used perfectly captures the probability distribution to be recovered. The figures reveal that, under this assumption, most dependences are recovered with small threshold values, giving rise to good skeletons. We found, however, that carefully handcrafted, real-world networks may embed very weak dependences that would require high thresholds for their recovery from data. 4.3 Use of χ 2 with sampled datasets The last, and most realistic situation that we address, involves datasets that were generated by means of logic sampling from a network under study. We recall that we used such datasets in our main experiments described in Section 3. We observe that sampled datasets differ from virtual datasets in two important aspects. Firstly, generated datasets show the effects of sampling errors, that is, the distribution observed in the dataset may differ slightly from the original distribution. Secondly, as generated datasets are finite, the dependence test used can fail to reliably establish dependence or independence. In our experiments, we adopted the common rule of thumb that the result of the χ 2 test can
be considered reliable only if all cells in the contingency tables have expected frequencies larger than five. As before, we compared the skeletons computed from the sampled datasets against the true skeletons of the Alarm and Oesoca networks. The numbers of missing and additional edges are summarised only briefly due to space restrictions. The differences between the true skeletons and the skeletons constructed from the sampled datasets, strongly depended upon the sizes of the dataset used and upon the thresholds employed. For low thresholds, the differences found were relatively modest. For example, with datasets of size 10 000 sampled from the Oesoca network and with thresholds equal to 0.05, the average number of edges missing from the computed skeleton was 3; the average number of additional edges was 81. With virtual datasets of the same size, these numbers were 2 and 59, respectively. With smaller datasets, these differences became larger. For example, with datasets of size 250, using the same thresholds, the average number of edges missing from the computed skeletons was 23.6; the average number of additional edges was 86.2. With virtual datasets of the same size, we found these numbers to be 11 and 22, respectively. The thresholds used were found to have a much stronger impact on the numbers of missing and additional edges. With datasets of size 2000, for example, raising the thresholds from ε 0 = ε1 = 0.05 to ε0 = 0.1, ε1 = 0.4 served to double the size of the resulting skeleton. From the above observations, we conclude that in realistic situations the thresholds used with the dependence test should be set of a relatively low value since using more liberal thresholds would result in an unfavourable tradeoff between the size of the resulting skeleton and its number of missing edges. We further conclude that sampling error can cause substantial deviations of the computed skeleton from the true one.
5 Discussion Most state-of-the-art algorithms for learning Bayesian networks from data build upon either the use of (in)dependence tests or the use of a quality measure and search algorithm. While important progress has been made with both approaches, we have argued that there are some obstacles to their practicability. Within the first approach, for example, the statistical test employed quickly becomes unreliable for larger conditioning sets. The second approach suffers from the huge space of graphical structures to be traversed. We have proposed a novel approach that combines the main advantages of these earlier algorithms yet avoids their difficulties. In the first phase of our approach, we use zero- and first-order dependence tests to build an undirected skeleton for the network under construction. This skeleton is used to explicitly restrict the search space of directed graphical structures to promising regions. Then, a search algorithm is used to traverse the restricted space to find a high-quality network. Our approach is general in the sense that it can be used with various different dependence tests, quality measures, and search algorithms. We have demonstrated the feasibility of our approach by means of experiments with two specific instances. These instances have shown good performance on datasets of various sizes generated from two real-world Bayesian networks. The good performance of even a simple hillclimber within our approach suggests that the restriction of the search space of graphical structures by means of a skeleton is safe, in the sense that it is not likely to prune high-quality networks. To corroborate
this observation, we have compared the computed skeletons against the true skeleton in varying situations. Using virtual datasets for the well-known Alarm network, skeletons without any missing edges and with up to twenty extra edges have been found, using very small thresholds for the dependence tests. Except for its three weakest dependences, also all edges from the true skeleton of the Oesoca network have been recovered with small thresholds; the numbers of extra edges for the skeletons computed from virtual datasets of various sizes range between 20 and 70. We conclude that the use of a skeleton provides for a careful balance of accuracy and a tractable search space. To conclude, we would like to note that the Oesoca network includes a dependence that is weak in general yet becomes very strong for patients in whom a relatively rare condition is found. This dependence is important from the point of view of the application domain, although for the learning task it is indistinguishable from the numerous irrelevant dependences found in the data. Since there is always a tradeoff between considering weak dependences that may be important and the computational resources one is willing to spend, we feel that learning a Bayesian network from data should always be performed in close consultation with a domain expert.
References W. L. Buntine. Classifiers: A theoretical and empirical study. In R. L. de Mantaras and D. Poole, editors, Proceedings of the International Joint Conference on Artificial Intelligence, pages 638–644. Morgan Kaufmann, 1991. J. Cheng, R. Greiner, J. Kelly, D. A. Bell, and W. Liu. Learning Bayesian networks from data: An information-theory based approach. Artificial Intelligence, 137(1–2):43–90, 2002. G. F. Cooper and E. Herskovits. A Bayesian method for the induction of probabilistic networks from data. Machine Learning, 9:309–347, 1992. R. G. Cowell, A. P. Dawid, S. L. Lauritzen, and D. J. Spiegelhalter. Probabilistic Networks and Expert Systems. Statistics for Engineering and Information Science. Springer-Verlag, 1999. L. M. de Campos and J. F. Huete. A new approach for learning belief networks using independence criteria. International Journal of Approximate Reasoning, 24(1):11–37, 2000. D. Heckerman, D. Geiger, and D. M. Chickering. Learning Bayesian networks: The combination of knowledge and statistical data. Machine Learning, 20(3):197–243, 1995. W. Lam and F. Bacchus. Using causal information and local measures to learn Bayesian networks. In D. Heckerman and A. Mamdani, editors, Proceedings of the Ninth Conference on Uncertainty in Artificial Intelligence, pages 243–250. Morgan-Kaufmann, 1993. G. Rebane and J. Pearl. The recovery of causal poly-trees from statistical data. In L. N. Kanal et al., editors, Proceedings of the Third Conference on Uncertainty in Artificial Intelligence, pages 175–182. Elsevier, 1987. P. Spirtes and C. Glymour. An algorithm for fast recovery of sparse causal graphs. Social Science Computer Review, 9(1):62–73, 1991. H. Steck and V. Tresp. Bayesian belief networks for data mining. In Proceedings of the Second Workshop on Design and Management of Data Warehouses, pages 145–154, 1999. S. van Dijk, D. Thierens, and L. C. van der Gaag. Building a GA from design principles for learning Bayesian networks. In E. Cantú-Paz et al., editors, Lecture Notes in Computer Science, Volume 2723: Proceedings of the Genetic and Evolutionary Computation Conference, pages 886–897. Springer-Verlag, 2003. M. L. Wong, S. Y. Lee, and K. S. Leung. A hybrid data mining approach to discover Bayesian networks using evolutionary programming. In W. B. Langdon et al., editors, Proceedings of the Genetic and Evolutionary Computation Conference. Morgan-Kaufmann, 2002.