PUBLS. INST. GEOPHYS. POL. ACAD. SC., E-7 (401), 2007
A State Dependent Nonlinear Approach to Flood Forecasting Renata J. ROMANOWICZ1, 2, Adam KICZKO1 and Florian PAPPENBERGER3 1
2
Institute of Geophysics Polish Academy of Sciences Ks. Janusza 64, 01-452 Warsaw, Poland e-mail:
[email protected]
Department of Environmental Sciences, Lancaster University, Lancaster, U.K 3
ECMWF, Shinfield Park, Reading, U.K
A b s tr a c t This paper presents an alternative to distributed inundation models for realtime flood forecasting that provides fast and accurate medium- to short-term forecasts. The methodology applies a State Dependent Parameter approach to derive a nonlinear dependence between the water levels measured at gauging stations along the river. The transformation of water levels depends on the relative geometry of the channel cross-sections, without the need to apply rating curve transformations to discharge. The relationship obtained is used to transform water levels as an input to an adaptive, variable time lag routing model. The paper provides an account of the uncertainties involved and describes the conditions for its application. The approach is illustrated using an 80 km reach of the River Severn, UK.
1. Introduction Flood warning systems require accurate water level forecasts over a range of forecasting horizons, from days to hours. The accuracy of the forecast varies with the forecast lead time. Therefore, the forecast should include not only water level values but also an assessment of its probable range (i.e., accuracy). Flood forecasting models apply data assimilation techniques and operate with varying accuracy decreasing with forecast lead times. Even though deterministic forecasts are still in use in some flood warning systems, real-time adaptive probabilistic forecasts are in increasing demand (Young 2002, Romanowicz et al. 2006). The on-line updated, stochastic data assimilation model presented in the second paper aimed for the longest possible forecast lead times. Forecasts for the river reach were combined together in order to prolong the forecast lead time downstream, thus forming an equivalent to a distributed flood forecasting system with the advantage of fast performance and probabilistic forecasts. However, the applied linear stage routing models were not able to give the same fore-
224
cast quality for both high and low water levels. Among different nonlinear approaches to flood forecasting, models applying artificial neural networks (NN) have become popular recently (Park et al. 2005). In particular, NN models allow for online data assimilation and give probabilistic forecasts (Chen and Yu 2007). The latter authors applied deterministic, NN based water level forecast and a probabilistic error assessment. The main disadvantage of NN models lies in the complex, non-transparent model structure. It makes it very difficult to find a physical interpretation of the model structure and to extrapolate model results to situations not included in the training sets applied for the model parameters estimation. Following experience gained during the derivation of stage routing models (Romanowicz et al. 2006, Young et al. 2006), we propose here an approach which applies both nonlinear transformation of the upstream stages and an advective time delay being a function of the water level. This approach allows the nonlinearity of the stage-stage relations to be captured, as well as accounting for the varying speed of the wave peak. The approach was tested on the River Severn, UK, reach between Welsh Bridge and Bewdley. 2. Methodology The water levels at gauging stations along a river are usually highly correlated but they also show a nonlinear relationship, resulting from variable channel and floodplain geometry. Let us consider a river reach between two gauging stations. We shall denote the water level measurements upstream at discrete time period k as input variable uk and water levels at downstream location as an output yk. We want to find the nonlinear water level transformation between these two locations in order to account for nonlinear channel geometry and other nonlinear processes which influence the flow. The shape of this nonlinear transformation is derived from the observations at the downstream end, using a State Dependent Parameter (SDP) approach (Young et al. 2001). In order to account for variations of wave celerity, we introduce a varying with water level advective time delay. A mathematical description of the proposed water level routing process is as follows: xk = h(uk −δ k ( uk ) ) ⋅ uk −δ k ( uk ) (1) yk = xk + ζ k
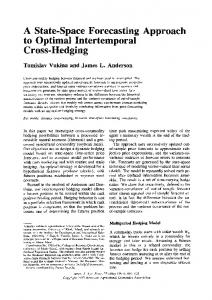
where h(⋅) denotes the nonlinear transformation of water levels at the input to the reach uk at discrete time period k, derived using SDP approach; δk = d(uk) denotes the delay related to the celerity of the flood wave, or the travel time of the wave peak and changing with the peak height, and ζk is a random Gaussian error, usually coloured with heteroscedastic variance. The schematic presentation of the modelling approach is shown in Fig. 1. The SDP relationship is first estimated in a nonparametric (graphical) manner using CAPTAIN toolbox for MATLAB™ (Taylor et al. 2007), in order to identify its characteristic nonlinear form, prior to parameterisation and final estimation of this identified relationship based on suitable parametric forms, such as a combination of power, exponential and piecewise linear analytical relations or the use of more general parameterisations, such as radial basis functions (Martin et al. 2003).
225
Delay
uk
δ k = d (uk )
uk , δ
Nonlinear transformation
ζk +
xk = h(uk −δ k ) yk
Fig. 1. Schematic representation of State Dependent Nonlinear model for flood forecasting.
It is worth noting that the model (1) is derived off-line. The nonlinear relationship between the water levels at two cross-sections may change with time, and the travel time of the wave peak also varies. In order to account for small modelling errors, the data assimilation procedure is used in the form of on-line adaptive gain. Namely, the on-line N-step ahead level forecast applies an on-line gain updating based on observations up to date, using real-time recursive estimation (Young 2002). Therefore, the forecast equation has the following form: yk + N = gˆ k ⋅ xˆk + N + ηk + N (2)
Here, xˆk + N is the deterministic N steps ahead water level estimate, obtained from variable delay routing model, and ηk + N is the noise term that represents the error in the estimation (lack of fit); gˆ k denotes an estimate of adaptive gain gk which is assumed to vary stochastically as a Random Walk (RW) process with variance hyper-parameter qk associated with the stochastic input to the RW model. With this assumption, the gain gk can be estimated in real-time using the scalar Recursive Least Squares (RLS) algorithm (Young 1984), conditioned on the observations up to time k. In calibration, we use the minimisation of N-step-ahead forecast error as the optimisation criterion for the gain hyper-parameter qk. The 0.95 confidence bounds of the N-step ahead forecast are identified using a Monte Carlo based estimation technique (Romanowicz and Beven 2006). The procedure for developing an on-line SDP-based flood forecasting model for two neighbouring gauging stations is as follows: 1. Estimate the relationship between the height of the wave peak upstream and the travel time δ required for that peak to reach the downstream station. 2. Determine the nonlinear transformation for the relationship (Eq. 1) between the water levels using an SDP approach. 3. Parameterize the obtained function using, e.g., radial basis functions. 4. Derive hyper-parameters for on-line updating of the forecast gain and 0.95 confidence bounds for the N-step ahead forecast. 3. Introducing the nonlinear water level transformation: River Severn case study
We apply the proposed approach to the River Severn reach, U.K., between Welsh Bridge and Bewdley. There are available 15 min water level measurements at Welsh
226
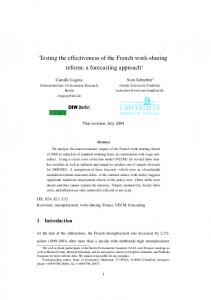
Bridge, Buildwas, Bridgnorth and Bewdley obtained from the UK Environment Agency, Midlands Region. This study of the River Severn was chosen as a development of the previous work (Romanowicz et al. 2006). We applied an SDP estimation approach to water levels at the three sub-reaches listed above for a period 1998-2000. The resulting nonlinear function for Welsh Bridge-Buildwas reach is shown in Fig. 2. The relationship was obtained assuming that the delay δ for each station is constant and corresponds to the maximum peak wave travel time. The figure presents the nonlinear function h(.) from Eq. (1); dotted lines show 0.95 confidence bounds. These confidence bounds are estimated based on the parametric uncertainty of SDP method. 2
1.8
nonlinear gain
1.6
1.4
1.2
1
0.8
0
1
2
3 stage at Welsh Bridge [m]
4
5
6
Fig. 2. SDP function for water level relationship between Welsh Bridge and Buildwas; dotted lines present 0.95 confidence bounds, based on the uncertainty estimates of the nonparametric nonlinear regression model (1).
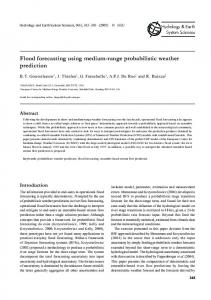
The comparison of wave peak travel time for different gauging stations indicates that flood wave celerity depends not only on location but also on water levels. Lekkas and Onof (2005) showed that celerity increases with increase of water depth in the channel, which results in a decrease in delay times. However, where inundation of the flood plain occurs, we observe the opposite effect, namely, the delay for high flood peaks is much larger than the delay for low peaks. This effect is illustrated in Fig. 2, which shows the relationship between the travel times and water levels for the subreach between Welsh Bridge and Buildwas, derived using 15 min data for the years 1998-2000. There is a scatter of points showing varying travel times for the water levels at Welsh Bridge between 1 and 3 m and a better defined relationship for the levels above 3 m. At the higher stages this relationship depends on the dynamics of out-of-bank flow along the whole river reach between Welsh Bridge and Buildwas. Figure 3 indicates that the delay in Eq. (1) should vary depending on the input water level in order to improve the SDP model fit. The results of the analysis of the relationships between travel times for all four gauging stations are summarised in Table 1. Table 1 also shows the threshold water levels corresponding to the changes in time delays
227
from the minimum to maximum values, as illustrated in Fig. 3 for the Welsh Bridge to Buildwas case.
Fig. 3. Relationship between wave peak travel times (no. of 15 minute time steps) and water levels at Welsh Bridge (1998-2000) for the Severn reach between Welsh Bridge and Buildwas. Table 1 Minimum and maximum travel times for each of the sub-reaches and corresponding water levels at the upstream gauging stations (Welsh Bridge, Buildwas and Bridgnorth, respectively) Min time [h]
Water level [m]
Max time [h]
Water level [m]
Welsh Bridge − Buildwas
8
2
14
3.5
Buildwas Bridgnorth
3
3.5
5
5
Bridgnorth − Bewdley
4
1.7
6
3.5
The flow (level) routing process in an open channel combines the processes of advection (translation of the wave in time) and dispersion which, in text book cases, leads to attenuation of the flood peak. Under over-bank flow conditions, the energy balance in the reach is influenced by local velocities, secondary flows, momentum transfer, and interface vortices between channel and flood bank and boundary shear stress (Knight et al. 1989). In this particular research, no attempt is made to model such effects explicitly. Instead the complex interactions between water level and flood wave discharges are taken into account through the nonlinear transformation of the input water levels to deal with the momentum loss of the wave and the (possibly complex) changes in cross-section geometry and storage along the river reach. Therefore, as shown in Fig. 2, this transformation can result in a downstream response with a higher relative change in water levels (an increase in gain at higher flows), especially at man-
228
made structures or other constrictions, as well as the textbook downstream attenuation of the flood peak. The application of the proposed methodology to the River Severn reach between Welsh Bridge and Bewdley resulted in improved on-line water level forecasts. Table 2 presents the results of validation of the models on 2002 flood event based on the model (1), with the variable transport delay (travel time) as given in Table 1. In Table 2, forecast success is reported in terms of the percentage of the output variance explained by the forecast RN2 = 1 − σ N2 / σ y2 , where σ N2 and σ y2 denote the variances of N
step ahead forecast error and observed water level, respectively and Root Mean Square Error (RMSE). Table 2 2 f
The goodness of fit R and RMSE criteria for the validation stage of on-line forecasts for the 2002 flood event Lead time [h]
R N2 [%]
RMSE [m]
Welsh Bridge − Buildwas
8
99.45
0.106
Buildwas − Bridgnorth
3
99.93
0.038
Bridgnorth − Bewdley
4
99.76
0.054
Buildwas − Bewdley
7
99.65
0.067
Welsh Bridge − Bridgnorth
11
98.81
0.117
Welsh Bridge − Bewdley
15
98.65
0.129
River Severn Reach
Fig. 4. Validation of SDP based, variable time delay model: 11-hour-ahead forecast for the Bewdley, November 2002 event, with on-line updating of the forecast gain (99.22% of output variation explained).
229
Since a nonlinear SDP transformation is applied to the upstream water levels at each sub-reach, the forecasts can be prolonged, as in Romanowicz et al. (2006), by using the forecast upstream instead of measurements. Obviously, the quality of the forecasts decreases with the increase of the lead time. The last three rows of Table 2 show the goodness of fit obtained after combining the individual reach forecasts. Therefore, the Bewdley forecast may be extended to a maximum 11 hours when the 5hour-ahead forecast for Bridgnorth is used, and up to a maximum of 25 hours when using the 19-hour-ahead forecast for Bridgnorth. The maximum lead times shown in brackets correspond to the wave peak time travel. Figure 4 shows the 11-hour-ahead validation forecast for Bewdley based on forecasts for the Buildwas-BridgnorthBewdley reaches, together with 0.95 confidence bounds. 4. Conclusions
We have shown that a high precision on-line forecast can be obtained from a simple, easily implemented, and transparent on-line data assimilation system, based on a nonlinear transformation of water level observations upstream and advective time delay varying with input water levels. The approach requires a wide range of input and output data to give robust predictions. From this point of view it resembles a neural network approach. However, in contrast with neural network models, the approach presented here is more straightforward and gives the possibility of generalisation of a nonlinear relation between water levels depending on river channel geometry. This generalisation is the subject of ongoing work. A c k n o w l e d g me n t s . This work was supported partly by the UK Flood Risk Management Research Consortium Research Priority Area 3 on Real-time Forecasting and grant 2 P04D 009 29 from the Polish Ministry of Higher Education and Science. We thank Professors Peter Young and Keith Beven for advice and discussion. Our colleagues from the UK Environment Agency are thanked for supplying the rainfall and flow data, which were used in this research. References
Chen, Shien-Tsung, and Yu. Pao-Shan, 2007, Real-time probabilistic forecasting of flood stages, 2007, J. Hydrol., 340, 43-77. Knight, D.W., K. Shiono and J. Pirt, 1989, Prediction of depth mean velocity and discharge in natural rivers with overbank flow, Proc. Int. Conf. on Hydraulic and Environmental Modelling of Coastal, Estuarine and River Waters, (Ed. R.A. Falconer, P. Goodwin, R.G.S. Matthew), Gower Technical, University of Bradford, September, Paper 38, 419-428. Lekkas, D.F., and C. Onof, 2005, Introducing the variation of advective time delay (ATD) to Transfer Function models, Environmental Modelling and Software doi:10.1016/j.envsoft.2005.06.005. Martin, D., M. Buhmann and J. Ablowitz, 2003, Radial Basis Functions: Theory and Implementations, Cambridge University.
230
Park, J., J. Obeysekera and R. VanZee, 2005, Prediction boundaries and forecasting of nonlinear hydrologic stage data, J. Hydrol., 312, 79-94. Romanowicz, R.J., and K.J. Beven, 2006, Comments on Generalised Likelihood Uncertainty Estimation, Reliability Engineering and System Safety, doi: 10.1016/j.ress.2005.11.030. Romanowicz, R.J., P.C. Young and K.J. Beven, 2006, Data assimilation and adaptive forecasting of water levels in the river Severn catchment, United Kingdom, Water Res. Research, 42, doi:10.1029/2005WR004373. Taylor, C.J., D.J. Pedregal, P.C. Young and W. Tych, 2007, Environmental time series analysis and forecasting with the Captain toolbox, Environmental Modelling and Software 22, 797-814. Young, P., 2002, Advances in real-time flood forecasting, Philosophical Transactions: Mathematical, Physical and Engineering Sciences, 360, 1433-1450. Young, P.C., 1984. Recursive Estimation and Time Series Analysis, Springer, Berlin. Young, P.C., P. Mckenna and J. Bruun, 2001, Identification of non-linear stochastic systems by state dependent parameter estimation, International Journal of Control, 74 (18): 1837-1857. Young, P., R.J. Romanowicz and K.J. Beven, 2006, Updating Algorithms in Flood Forecasting, Flood Risk Management Research Consortium, Report UR5, December 2006; www.floodrisk.org.uk.