... program. This paper presents a framework for performing the analysis in this ... predict the requirements irregular programs place upon a computer system.
A Statistical Mechanical Approach to a Framework for Modeling Irregular Programs on Distributed or Cluster Computers1
Shean T. McMahon and Isaac D. Scherson Department of Information and Computer Science University of California, Irvine Irvine, CA 92697-3425, USA
Abstract Correctly modeling the resource requirements of a computer program is made problematic by the property of irregularity. Irregular computer programs are ones in which modeling the program before runtime is neither feasible nor possible; the result being that the systems requirements are unknown. In this paper we present a method for modeling irregularity which makes use of well established probabilistic and data analysis techniques. The realm of continuous mathematics, rather than the more traditional discrete cases are employed, thus introducing the more diverse analysis methodologies this branch of mathematics affords. This approach, that of describing a discrete system using a continuous mathematical function has been well established in the physical sciences, and has proven to be a valid approach to describing problems of this sort.
1.0 Introduction The problem of scheduling a collection of jobs on a computer has elicited significant research. Essentially the problem we are trying to solve is how to best arrange the jobs so the computer’s resources are most effectively utilized. Many techniques have been suggested, ranging from simple and often inefficient “run them in any order” approaches, to sophisticated online load balancing techniques which attempt to arrange loads based upon the available resources at any given time. The rate of change load balancing technique [1] developed by our group is a case in point. One of the problems which appears when attempting to optimally schedule jobs is that of irregularity in the computer programs being run. Solving the problem becomes more of an art than a science as important scheduling information is not available. This forces the use of either sophisticated techniques, or the user needs to 1
rely on experience as a guide. The problem can be viewed as one of lack of information. The reality is that the information is available, it’s just not accessible, or so it would seem. What is lacking is a method to extract the important information from what is available. Techniques to achieve this exist and are well established in the physical sciences. By appealing to the data analysis methodologies used in physics, chemistry, and so forth a whole range of capability is brought to bear on the problem at hand. One interesting observation here is that data analysis in the physical sciences is almost always done using continuous mathematics; computer science on the other hand often deals in the discrete case. In reality the problems are not that different. Consider the case of a detector in a particle accelerator. The detector measures the number of particles which slam into it. Since the particles are whole items the problem is necessarily discrete. Essentially the problem is looking at events; a proton incident on a detector is an event. Countless other problems fit this mold, ranging from biology and psychology to physics and chemistry. These problems are also nearly always analyzed using continuous rather than discrete mathematics. A computer program can be analyzed similarly by recognizing that it can be treated as a sequence of events. This is not so far fetched. A computer performs operations. These operations are an event. This recognition allows an analogy to be drawn from the physical sciences. There is absolutely no reason data analysis techniques based in continuous mathematics cannot be used to model a computer program. This paper presents a framework for performing the analysis in this way.
This work was supported in part by NASA-JPL under grant #1216595 and by NASA-GSFC under grant # NAG5-9695.
1.1 Scope of this Paper This paper presents a method to model, and in turn predict the requirements irregular programs place upon a computer system. The problem of irregularity has consequences in many areas of computer science. Most of the treatment will address computational irregularity with the restriction of time constancy; the irregularity will scale only due to problem size. Extension to communication irregularity is essentially a matter of change of variables, while time irregularity can be managed in several ways.
Computation and communication are the natural breakpoints for irregularity. Essentially the problem of irregularity can be stated as one of unknown requirements. Time irregularity is a consequence in all cases here and is discussed at the end of this section.
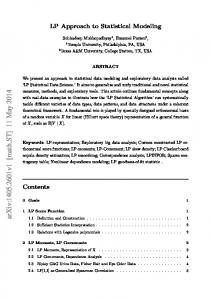
2.2 Computational Irregularity A program which is computational or C-irregular is one in which the amount of computation the program performs in unknown until runtime. Figure 1 provides an illustration
1.2 Acknowledgements I would like to acknowledge NASA/JPL’s REE project and NASA/Goddard and the Space Data Computing Division for support on this work, and Vara Ramakrishnan for inspiration.
2.0 Background: What is Irregularity? Computer applications can be classified in two broad categories: regular and irregular. Which category a program fits into has far reaching consequences. The classifications are reasonably straightforward; a program which is regular requires a known amount of computing resources. Since everything is known about the programs resource requirements, issues such as scheduling are easily addressed. On the other side of the coin we have irregular programs. An irregular program is one in which information regarding the programs resource requirements is unavailable. This raises some difficulties as it is no longer known what to expect when the program is run. The result being that the computer can no longer be optimally utilized.
2.1 Types of Irregularity Distributed/Parallel and Cluster computers can be thought of as performing two basic operations; they either communicate or they compute. These are referred to as T-irregular (thread) and C-irregular (compute) respectively[2]. Combinations can also occur. Table 1 lists these Irregularity Type Classification Program is: None NA Regular Computational C C-Irregular Communication T T-Irregular Computation and CT CT-Irregular Communication Table 1: Types of Irregularity and Classifications
Figure 1: Computation Irregularity and Problem Size A simple example of a computationally irregular problem is provided in pseudocode 1. PseudoCode 1: A Computationally Irregular Problem Get n from user; n x = ∑ i; i =1 Return n; Obviously in this code, the value of n is unknown until runtime, as a result no statements can be made as to the resource requirements of the program. This presents particular difficulties in multi-user or multitasking environments as the delicate scheduling issues which need to be resolved to make these systems run at peak efficiency can no longer be optimally solved.
2.3 Adaptive Mesh Refinement (AMR): A Real World Case Simple examples are fine, but real world problems offer insight into why this problem is of such importance. Consider the analysis of stress on an airplanes wing. Solution of this problem is achieved through numerical solution of a system of partial differential equations (PDE’s). One approach to this is to reformulate the
problem using either a finite difference or a finite element method. These approaches are well treated in many texts so the particular details will not be discussed here. Consider the finite difference case. In this method the surface the problem is to be solved on is divided up into a grid or mesh. The problem then becomes one of iteratively solving each division until the difference between adjacent grid elements is below some tolerance level. In idealized problems, a uniform, constant grid size may be fine, however many problems require that the problem be allowed to adapt the grid based upon current conditions.
Figure 2: Communication Irregularity and Problem Size
2.5 Time Irregularity
In the airplane wing problem some of the surface the problem exists on experiences little variation while other areas see significant changes[3]. In a case such as this the use of a uniform grid can solve the problem, but this requires a very fine mesh to address the areas where large variations occur. In the areas of small change this is a significant waste of computing resources. The solution to this is to adaptively refine the grid in areas of significant change. This technique by its very nature is at the very least computationally irregular. This follows as the grid is altered during runtime, resulting in a variation in problem size. Before running the problem there is no practical way to tell what sort of requirements the AMR technique will place on a system without significant analysis of the problem and the particular data set and conditions to be fed to the system. This is not always practical, nor possible.
Time irregularity is a potential factor in both computational and communication irregularity. It addresses programs in which the resource requirements change during runtime, but not due to variations in the problem size. We do not treat the case of problems which exhibit time irregularity in this paper, although it is mentioned for consistency and completeness’ sake. Figure 3 illustrates time irregularity
2.4 Communication Irregularity In a program which is communication or T-irregular, rather than looking at how many additions are done the problem might be how many loads or stores are performed, or how many messages are sent. Essentially though the problem is the same: how to incorporate the unknown into a method which requires known data. Figure 2 illustrates communication irregularity.
Figure 3: A time-irregular Program Incorporating time irregularity into the solution can be accomplished in several ways. These include: • Use the requirements for some set time, such as t1. • Use some statistical quantity of the requirements, such as the mean. • Treat the variation as if they were measurement errors. A visualization of could be achieved by placing error bars on the distribution which enclose the upper and lower bounds on the resource requirements.
3.0 Solution Methodology The solution presented focuses on solving the problem of computational irregularity. This solution however is equally applicable to either the communication or the computation realm. The first step in formulating a solution is to recognize that while a quantity of operations may be unknown, they still exist, and as such occur in some frequency. By extension a valid claim can be made that the frequency of operations will follow some distribution. The particular properties of the distribution are unimportant at this point. What is important is that it be understood that a distribution can be assigned to the frequency of operations. Note that this is true in general. A program in which zero computations are performed still has an associated distribution describing its computational requirements. In this case however the distribution is uniform and zero. At this point it is has been shown empirically that a distribution can be used to describe the frequency of operations in a program. This does not provide a solution, but does provide a solid foundation on which to build the solution.
3.1 The Irregularity Distribution Function Developing the distributions is perhaps the most difficult portion of this methodology. Essentially a basis for a solution can be found by appealing to data analysis techniques. All real-world distributions, and indeed any which would describe a computer application are finite in extent. This means that clearly defined endpoints for the distribution can be found. By analyzing the frequency of occurrence of operations, a curve describing the sample space can also be found. The equation describing this curve is the frequency distribution of the operations. Deriving these for a computer application is matter of analysis of the application and the allowed data sets. This does not mean that the actual data sets need to be analyzed, only a representative sample of typical data, or even statistics on the extent of the data, such as maximum and minimum number of data points and so forth. A full analysis of this is currently being investigated and is beyond the scope of this paper.
•
A distribution function can be found which describes the frequency with which each operation occurs. The frequency distributions are assumed to be continuous on some interval This assumption can be made based upon the following reasoning. Consider an experiment in which a number of particles are counted. Obviously this is a discrete case. The particles are whole objects, so fractional particles just don’t show up. A set of data such as this can still be approximated using a continuous curve. This is a standard methodology used to describe data. An example would be the normal distribution. This distribution is regularly employed in the description of discrete data sets.
In addition, the following can be concluded via inspection: • The frequency distributions exist on a clearly defined interval of finite extent All computer programs can be thought of as having a maximum and minimum problem size. As such maximum and minimum limits can be placed on the amount of computation and communication the program performs. The upper limit may extend to infinity, although the lower limit will never extend below zero. This leads to theorem 1: Theorem
Minimum Problem Size
“A programs problem size will necessarily be zero for negative problem sizes.” Corollary to the Minimum Problem Size Theorem “All real programs will have an upper limit on problem size. Beyond this limit the problem size will be zero or constant.” This follows as a programs problem size is limited by memory constraints. The amount of memory a real machine can contain and/or access is finite. Due to this finite constraint the problem size is limited to the available memory size.
3.2 Justifications, Statements, and Assumptions on Distributions
3.3 Moving from Frequency of Occurrence to Probability
For the purposes of this paper the following assumptions will be made: • The frequency distribution functions exist These functions are assumed to exist based upon the argument that a computer will perform the operations of computation and communication in some quantity.
The irregularity distribution functions describe a program in terms of the frequency of occurrence of operations, which is fine if the question is “how many operations occur for a given problem size?” This however is not the information of interest here. The information being sought is the most likely number of
operations. This is a probability question, so a conversion needs to be done to cast the frequency distribution to a probability distribution. The process requires finding the relative frequency for each data point and generating a corresponding distribution. This problem is intimately related to finding the frequency distribution functions, and rather than diverge into a lengthy discussion of just how this is accomplished, the problem will be left for discussion at a later date. All frequency distributions will have an associated probability distribution. As such their existence can be assumed. Let f(x) and g(x) represent computation and communication irregularity respectively. For illustrative purposes these functions will defined as f ( x) = a cos x g ( x) = e − dx
This is a simple and idealized example, but the principles are directly translatable to probability distributions describing computer program irregularity. Observe that the normalization condition is defined on the interval (-∞, ∞). To address this problem recall the additivity property of integral calculus[5]. c
∫
b
c
∫
∫
h( x) = h( x) + h( x),
a
a
b
To illustrate, consider for the moment a frequency distribution. In the case of a computer program, this distribution will have clearly defined upper and lower bounds. This is discussed in the justification of theorem 1. Outside of these bounds, the program can be considered to be performing zero of some particular operation.
The probability distributions must be normalized. This is accomplished using the normalization condition[4]. This is listed below. ∞
∫ A ⋅ p( x)dx = 1
−∞
p(x) is the probability distribution for the data in question, and A is a multiplicative factor which forces the probability distribution to obey the normalization condition. Solving the integral yields A in terms of the constants contained in p(x). Doing so for f(x) yields ∞
1=
∫
∫
= A (a ⋅ cos( x))dx −∞ ∞ −∞
]
Observe that if the cosine is integrated on a symmetric interval, then the value of the integral is ½. Thus,
(
1 = A ⋅ a ⋅ sin( x) + b)
+
∫
f ( x )dx
∫ 0 ⋅ dx = 0
+
b
a
Figure 4: Problem Size Bounds and Program Live Range
−∞ ∞
[
∫
∞
b
0 ⋅ dx = 0
−∞
A ⋅ f ( x)dx
= A ⋅ (a ⋅ sin( x) + b)
a
∞ −∞
)
a = A⋅ + b 2 2 ⇒ A= a + 2b
Q.E.D.
The individual portions of the plot reveal areas where no operations occur. The above integrals correspond to the regions of the distribution above them. It can be seen that the only remaining term is that for the portion of the distribution which exists on [a, b]. At this point the problem has been mapped into a probability space, and its proper bounds determined. This allows properties of the program to be revealed. The common statistical quantities in this realm are first moment (expectation value), and the second moment (variance). The use of moments here is a mathematical shorthand. They allow specification of common values using a single basis equation. The moments of a distribution are the expectation values of powers of the observable
xn .
moment, also known as the expectation value is
The first
x =
∫ xf ( x)dx ,
while the mean square deviation from this is the variance[6].
σ 2 = (x − x ) 2 = x 2 − 2x x + x = x
2
− x
2
2
Recall that the square root of the variance is the standard deviation σ. Note that the expectation value and the most probable value are not in general the same[7]. The expectation value is just the average of all the points observed. The most probable value occurs at the point where the distribution function is greatest. To illustrate, consider a system where 10000 data measurements are taken. Say that the second data point takes on a value of 50000, while all others take on a value of 5. The average value here is
requirement of independence between the distribution functions, although an assumption of independence allows a simpler treatment. The question of dependencies is curious however and may lead to some interesting insight into the nature of irregularity.
3.6 A Visualization Probability Space
Methodology:
The
Once the distributions have been found, a method is required to derive the actual space the program runs in. Because the problem is dealing with a two dimensional case (computation and communication), a two dimensional space is used to develop the run space of the program. Essentially, the distributions for both computation and communication are treated as orthogonal and plotted as marginal distributions on a plane. Figure 6 illustrates this for two normal distributions (note that the vertical extent has been exaggerated for visualization purposes).
1 mean = 10000 (9999(5) + 50000) = 9.9995.
If this is describing the expected number of operations in a computer program, it would be correct to say that the average number performed if all data set sizes are run is ≈10. The most likely case however is where the system is performing 50000 operations. Note that this also corresponds to the peak(s) in the probability distribution. Figure 5 explains this graphically.
Figure 6: A Pair of Marginal Distributions The concept behind marginal distributions is that each distribution exists along an axis of the plane. The distribution extends into the other axis. The idea being that a function of one variable is constant in all others. Marginal distributions necessarily exist in n dimensions. For the current discussion n = 2. The marginal distributions are defined as[9] ∞
f X ( x) =
Figure 5: Difference Between Expectation and Average Values
∫ f ( x, y)dy,
−∞ < x < ∞
∫ f ( x, y)dx,
− ∞ < y < ∞.
−∞ ∞
f Y ( y) =
−∞
3.5 Dependencies Between f(x) and g(x) One possible concern is dependencies between f(x) and g(x). The method used to combine the probability spaces for computational and communication irregularity is the joint probability[8]. This approach has no
Observe that the probability function f(x, y) is a function in both x and y, and that the probability functions defined previously are functions of only one variable To resolve this recall that the following are equivalent
ax ⇔ ax 1 ⇔ ax 1 y 0 ⇔ ax 1 y 0 z 0 ...
From here a method to combine the two is required. This is achieved via the joint probability distribution.
3.7 Joint Distributions The combination of the probability distributions yields a joint distribution. Figure 7 is an example of a joint Gaussian. Essentially what occurs is the two individual functions are combined to yield a probability surface describing the problem under consideration.
derivation of f(x, y) is more complex, but the mathematical analysis and interpretation are unchanged.
3.8 Example Consider the case of a program where the computational and communication requirements are generated by the following functions Computation ⇔ f = αx + sin( αx ) y
y
Communication ⇔ g = cos( α ) + sin( α ) + 3
where α is a scaling constant. Figures 8 and 9 contain plots of these functions for reference purposes.
Figure 7: A Joint Distribution
Figure 8: Computational Requirments
Recall that an important property of the joint distribution is that the marginal distributions which produce it need not be independent. The joint probability distribution is defined as[10] Probability [ x, y ∈ E ] =
∫∫
E
f ( x, y )dxdy
Where we let E represent the sample space for the programs to simplify notation. Expectedly, the normalization requirement becomes ∞ ∞
Figure 9: Communication Requirments
∫ ∫ A ⋅ f ( x, y)dxdy = 1
− ∞− ∞
As before, A represents the normalization constant. For simplicities sake, we assume independence between the irregularity distributions. This is not a requirement. In the case of independent distributions, the function f(x, y) is just the product of the two separate distributions.
The problem exists on the range [0, b]. Finding the normalization constants A1 and A2 yields b
∫ A f ( x)dx = 1 1
0
⇒
f ( x, y ) ≡ f ( x ) g ( y )
Solving this yields the probability distribution describing the space in which the application lives. In the event that the irregularity distributions are dependant,
1 = A1
⇒ A1 =
and
b
∫ (α + sin (α ))dx x
x
0
2α b 2 − 2α 2 cos
(αb ) + 2α 2
b
b b
∫
∫ ∫ A H ( x, y)dxdy = 1
A2 g ( y )dy = 1
3
0 0
0
1 = A2
⇒ ⇒
∫ (cos( )+ sin ( )+ 3)dy b
y
y
α
α
1 A3
=
α sin (αb )
x
y
x
y
0 0
0
1 − α cos
∫ ∫ (α + sin( α ))(cos( α ) + sin( α ) + 3)dxdy b b
⇒
⇒ A3 =
(αb ) + 3b + α
We can now form the probability distributions Pf and Pg. P f = A1 f ( x), Pg = A2 g ( y )
[αb
2α
(αb ) − 2α 3 sin 2 (αb ) − 3b 3 − 6α 2 b cos(αb ) − 2α 3 sin (αb ) cos(αb )] 3
sin
(αb ) + αb
2
cos
Observe that the quantity of interest here is the expected problem size. This is by definition a single value, and is given by
Calculating the expectation values yields
Problem Size =
b
∫
x = x ⋅ P f dx
∫∫ A xy ⋅ H ( x, y)dxdy 3
x, y
0
∫( b
= A1
x2
α
+ x sin
(αx ))dx
0
()
()
2b 3 + 6α 3 sin b − 6α 2 cos b + 6α 2 α α = A1 2 2 b 3b − 6α cos α + 6α 2
()
b
y =
∫ y ⋅ P dy g
0
∫ (y cos(α )+ y sin (α )+ 3 y )dy (2(α + α )sin (α )+ 2(α − α )cos(α )+ 3b ) b
= A2
y
y
0
=
A2 2
2
b
2
b
2
It can be shown that these are not equal. The implication of this is that the expected computation and communication problem sizes will be different. The joint distribution method is used to overcome this problem. The joint distribution is formed by taking the product of the marginal distributions f and g. H ( x, y ) ≡ f ( x ) g ( y )
(αx + sin( αx ))(cos( αy ) + sin( αy ) + 3) y y = αx cos(αx ) + sin (αx ) cos(α )+ αx sin (α ) y + sin (αx )sin (α )+ 3αx + 3 sin (αx ) =
Normalizing H yields
Note that this yields a single value which represents the expected problem size for the program described by the functions f and g, and is not in general equal to expectation values of f or g. Q.E.D
4.0 Conclusions We have taken the problem of irregularity in scheduling and extended this to a general method for modeling irregular programs. The move to a probability space allows computation of several statistical properties of the program which are unavailable when discussing the program using a “frequency of operation” approach. Our method allows the combination of the two degenerate forms of irregularity and a method to combine these to yield expected runtime information based upon a seemingly simple analysis of a program. Our method also shows applicability in performance modeling of computer systems. This is a subject of current research.
5.0 Future Questions and Research Our method lacks experimental verification. The techniques are all well accepted data analysis methodologies and follow directly from obvious properties of computer programs. This provides confidence in the approach. A method for generating the initial frequency distributions needs to be developed. Our group has some perspectives on this which have been revealed through our performance analysis work. While the joint distribution is indifferent to the independence of the distributions which compose it, investigation into the dependence between the computation and communication
distributions does appear warranted. Indeed, if independence can be proven the analysis presented above can be greatly simplified.
3. 4.
6.0 References
5.
1.
6.
2.
Luis Miguel Campos, Resource Management Techniques for Multiprogrammed Distributed Systems, Doctoral Thesis, University of California, Irvine, Irvine, California, 1999. Vara Ramakrishnan, The Convergence of Massively Parallel Processors and Multiprocessors, Doctoral Thesis, University of California, Irvine, Irvine, California, 2000.
7. 8. 9.
Daniel Zwillinger, Handbook of Differential Equations, Academic Press, San Diego, 1992. Roger Bowley and Mariana Sanchez, Introductory Statistical Mechanics, Oxford Science Publications, Oxford, 1996. Ed. Daniel Zwillinger, CRC Standard Mathematical Tables and Formulae, 30th edition, CRC Press, Boca Raton, 1996. Neil Gershenfeld, The physics of Information Technology, Cambridge University Press, Cambridge, 2000. David J. Griffiths, Introduction To Quantum Mechanics, Prentice Hall, Englewood Cliffs, New Jersey, 1995. Bivariate Distributions, http://www.ma.hw.ac.uk/~jim/112DE1/notes/bivariate.pdf. Daniel Zwillinger and Stephen Kokoska, CRC Standard Probability and Statistics Tables and Formulae, Chapman &Hall/CRC, Boca Raton, 2000.