271 Journal of Applied Sciences Research, 8(1): 271-276, 2012 ISSN 1819-544X This is a refereed journal and all articles are professionally screened and reviewed
ORIGINAL ARTICLES A Statistical Model for Mapping Spatial Distribution of Total Suspended Solid from THEOS Satellite Imagery Over Penang Island, Malaysia Robabeh Asadpour, Lim Hwee San, Maryamosadat Moussavi Alashloo, Seyed Yasser Moussavi Alashloo Robabeh Asadpour, aSchool of Physics Universiti Sains Malaysia, 11800 Pulau Pinang, Malaysia ABSTRACT A large proportion of the population resides near the coastline and be dependent upon the widely use of the region’s resources for their life. The surrounding area of the coastal is one of the most developed, in dustrialized and populated area in the word. Pollution events such as oil spills are right away apparent, while the effect of non-point source pollution such as agricultural run-off may be exhibit themselves over decades (Asadpour et al., 2011). For the effective conservation of these resources, it is necessary to have accurate information about the current state of the coastal region. So quality of surface water is an important environmental worry. This study focused on the one of the application of remote sensing in monitoring water quality parameter such as suspended solids. The purpose of this research is to inspect the preciseness of the proposed algorithm to achieve total suspended sediment concentration by utilizing THEOS satellite image over Penang area. The study area is situated within latitudes 5o 24’38 N to 5o 21’ 01’’ N and longitudes 100o 20’ 33’’ E to 100o 22’ 49’’E. Water samples were collected on 12 November 2009 concurrently with the satellite over passes and image acquisition this area. Location of water samples (in-situ) were determined by making use of hand held Global Positioning System (GPS). Geometric correction was performed on the image. The digital numbers (DNs) were extracted corresponding to the sea data locations for each three visible bands and converted into reflectance values. Reflectance values were extracted corresponding to the in-situ location and used for calibration of the developed algorithm. TSS predicted algorithm was achieved with high correlation with in-situ data measurements. The accuracy of proposed algorithm was showed based on correlation coefficient (R2 = 0.97) and root mean square error (RMSE = 7.43 mg/l). The proposed algorithm was used to colour code map the TSS concentration over Penang, Malaysia. Key words: TSS, THEOS Imagery, Regression Analysis, Penang Island Introduction Viewing and understanding marine ecosystem is important because it covers over 70 percent of surface of the earth and may account for as much carbon production as terrestrial sources. In coastal area the vast and continuous layer of water and suspended sediment comes in the human activities. The characteristic blue of the open ocean becomes more complicated by the additional optical contributions of sediments. In such cases, the water color approaches yellow-brown (Lee et al., 2002). The color of natural waters covers the entire visible spectrum. The most common pollutant both in terms of volume and weight are suspended sediments (KUMAR et al.; Ritchie et al., 2001), which have undesirable effect in surface water systems and water quality in lakes, reservoirs, and straits. The traditional method of measuring the spatial distribution of water quality parameters has involved in-situ sampling aboard ship. In-situ point measurement can give accurate results in the laboratory but the vast area makes it difficult to evaluate water quality. Also, in-situ sampling would be costly and time consuming (Shafique et al., 2001). In recent years there is increasing attention in evaluating water quality using a remote sensing technique. Remote sensing techniques have been proven useful in providing data of a periodic, synoptic nature to supplement traditional ground based point samples. Some researchers demonstrate the usefulness of satellite remote sensing as tool for the monitoring environmental changes (Arnone et al., 2005; Lim et al., 2009). Several models have been used to correlate in-situ water quality with remote sensing data. Empirical approaches that used regression analysis have been widely cited in the literature (Koponen et al., 2001; Nelson et al., 2003; Li et al., 2007; Lim et al., 2009). Water quality parameter used in this study is Total Suspended Solids (TSS). In this work, the regression algorithm based on simultaneous measurements of ground data and the remote sensing observations was investigated. Multi-spectral algorithms were used to determine the TSS concentration on the surface of seawater. The proposed algorithm was used to generate the water quality map for better management of water pollution in coastal zone (Lim et al., 2008). Corresponding Author: Robabeh Asadpour, School of Physics Universiti Sains Malaysia, 11800 Pulau Pinang, Malaysia, +60174952041, Tel: +604-6533888, Fax: +604-6579150 E-mail:
[email protected]
272 J. Appl. Sci. Res., 8(1): 271-276, 2012
Materials And Method Study Area: The study area is located in the Straits of Penang Island. Penang Island is northern part of Malaysia, within latitudes 5° 12’N to 5° 30’ N and longitudes 100° 09’ E to 100° 20 E and UTM zone 85. Penang is the second populated city in malaysia, with an estimated population of 720,000. Penang Island is approximately 295 sq. km (Syahreza et al., 2010). Straits of Penang is part of Indian Ocean and it is a channel separating mainland Peninsular Malaysia and Penang Island. The map of the region is shown in Fig. 1.
Fig. 1: The study area. Data Collection: Water samples were collected from 13 sampling stations included clear and turbid waters simultaneously with the satellite image on 12 November 2009. A THEOS satellite was acquired for this study as our previous work (Lim et al., 2011) The spectral characteristics of THEOS are shown in Table 1. Also the spatial resolution of image is 15 meters. Fig. 2 shows the raw THEOS image and distribution point of sampling. The sampling locations were determined using a handheld Global Positioning System (GPS). By using the standard method as suggested by Strickland and Parson, water samples were analysed to determine the suspended solid concentration (mg/l) (Strickland et al., 1972). Table 1: Spectral characteristics of THEOS (Kaewmanee et al., 2007; Syahreza et al., 2010). Band1 (blue) Band 2 (green) Band 3 (red) Band 4 (near infrared)
0.45-0.52 μm 0.53-0.60 μm 0.62-0.69 μm 0.77-0.90 μm
Image Processing: The PCI Geomatica version 10.3 software was used in all the analyses. Raw remotely sensed image contains some defect and flaws. Pre-processing of the remotely sensed images are primary steps to do the main analysis. The pre-processing used in this study was geometric correction, radiometric correction, and atmospheric correction. Geometric correction was applied to the image using a fifth order polynomial equation according to low RMS error. The Polynomial Math Model is a simple math model that produces the best mathematical fit base on two-dimensional ground control points (GCPs) on image. It uses a first to fifth order polynomial based on low RMSE (Olliver, 2001) and then resampled by using the nearest neighbourhood method. The ground control points (GCP) were determined according to the image-to image method. Overall,
273 J. Appl. Sci. Res., 8(1): 271-276, 2012
the RMS error achieved in this study was less than 0.4 pixels. Digital numbers (DN) for each location of water sample were determined for each three visible bands. The DN values were extracted using window size of 3 x 3 due to high correlation coefficient. In radiometric correction step, the DN values were converted into reflectance values using 2 basic steps. The first step is to convert the raw DNs to radiance and then the obtained value of radiance was converted to reflectance by using Eq. (1) and (2). (Lim et al., 2009).
Fig. 2: The raw satellite image and the sampling locations acquired on 12.11.2009. Lλ= gain * DN + bias
(1)
where, Lλ = Spectral radiance at the sensor's aperture [W/(m2 sr μm)], DN = the cell value digital number The gain and bias values are unique for each spectral band acquired in header file. R (λ) =
π
Lλ
(2)
λ
where R(λ) is the unitless planetary reflectance, Lλ is the radiance (W m-2sr-1 µm-1), d is the Earth-Sun distance in astronomical units, (λ) is the mean solar atmospheric irradiance (W m-2 µm-1), and θ is solar zenith angle (º). A simple atmospheric correction, namely darkest pixel technique was performed in this study (Lim et al., 2008). Low pass filter was used to eliminate noises from the image. The MEDIAN filter (windows size 3 x 3) was selected (based on the highest R2 and lowest RMSE values) for minimizing the random noise. Statistical Analysis: The reflectance and surface reference data were analyzed using the SPSS 18.0 statistical analysis and the regression equations were calculated by using these data. The statistical parameters for precision of the regression model include the correlation coefficient (R) and the Root Mean Square Error (RMSE). The square of the correlation coefficient (R2) shows the proportion of the total variation that can be described by the regression equation. Root mean square error (RMSE) usually measures the differences between values calculated by a model and the values actually observed from the thing being estimated. RMSE are also called residuals that can be a good measure of precision. Result And Discussion The plot of the relationship between the reflectance for each band and the TSS values shows positive correlations between these two parameters in all bands. In this study, the regression equation was calculated by using SPSS 18.0 statistical analysis. For precision of the regression model two statistical parameters were used, correlation coefficient (R2) and root mean square error (RMSE). The multiple regression analysis would recognize the relationship between the dependent variable (in-situ data) and the independent variables (reflectance).
274 J. Appl. Sci. Res., 8(1): 271-276, 2012
Different empirical equations were investigated. Finally, the best model including reflectance bands, reflectance bands interaction and reflectance bands square were determined after removing insignificant terms. The predicted TSS values computed by using the proposed algorithm were correlated with their corresponding in-situ data. Table 2 indicates an excellent agreement between measured TSS and predicted response. The result shows the proposed algorithm has a high precision with correlation coefficient R2 = 0.97, and RMSE = 7.43 mg/l between the predicted and the measured TSS values. The nonlinear regression shows that the vast majority of image-estimated TSS is closely correlated with the in-situ data. The algorithm model was achieved as follow: TSS = 620.967 (R1) + 619.680 (R2) - 51.892 (R3) - 234.421 (R1)2- 876.209 (R2) (R3) - 48.425
(3)
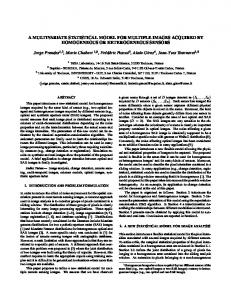
Fig. 3 illustrates that the predicted values of TSS from the model fitted excellent with the in-situ values, the data points are distributed relatively close to the straight line. A total of 97% variation in the result was attributed to the independent variables investigated. These results confirm that this algorithm is acceptable and can be used for the estimation of TSS concentration in Penang area.
Fig. 3: In-situ TSS (mg/l) data versus predicted TSS (mg/l) data. Table 2: Measured TSS and predicted TSS. No sample 1 2 3 4 5 6 7 8 9 10 11 12 13
Measured TSS (mg/l) 95 52 50 51 42 63 78 105 116 142 120 68 42
Predicted TSS (mg/l) 93.69340127 51.67278261 49.60193171 55.87188327 44.1281068 62.03830961 86.57708314 102.8907067 120.0520489 142.7733134 113.1767887 54.33397349 47.18611067
This algorithm was used to generate the colour code map to determine the range of pollution in this area. Fig. 4 illustrates TSS map for the study area generated by using the proposed algorithm. The map indicates high concentrations of TSS in shallow water near to the shorelines and estuary of rivers. This kind of map provides useful spatial information on water quality distribution patterns in the straits. The data can be used to show location of erosion and deposition areas and can provide important information for management and environmental planning of the marine environment.
275 J. Appl. Sci. Res., 8(1): 271-276, 2012
Fig. 4: TSS map for the study area generated by using the proposed algorithm on November 12th 2009. Conclusion: This study proposed a developed algorithm for water quality parameter (TSS). The predicted result from THEOS image exhibit that the predicted TSS has a close agreement with the in-situ data with high correlation coefficient and low root mean square error. So it can be concluded that the THEOS imagery and regression analysis can be used effectively to determine TSS levels over Penang Island. Acknowledgments This project was supported by University Sains Malaysia. We thank the technical staff and research officers who participated in this project. References Arnone, R., J. Acker, S. Ouillon, R. Gould and N. Rese, 2005. Measuring Marine Suspended Sediment Concentrations from Space: History and Potential. Presented at the 8th International Conference on Remote Sensing for Marine and Coastal Environments, Halifax, NS, Canada. Asadpour, R., H. Lim, M.M. Alashloo, S. Shekafti and S. Moussavi, 2011. Application of THEOS Imagery to Study Chlorophyll-a at the Strait of Penang Island, Malaysia. 2nd International Conference on Environmental Engineering and Applications, china, pp: 117-122. Kaewmanee, M., T. Choomnoommanee and R. Fraisse, 2007. Thailand Earth Observation System: Mission and Products. Ratio, 90: 100. Koponen, S., J. Pulliainen, H. Servomaa, Y. Zhang, M. Hallikainen, K. Kallio, J. Vepsäläinen, T. Pyhälahti and T. Hannonen, 2001.Analysis on the feasibility of multi-source remote sensing observations for chl-a monitoring in Finnish lakes. The Science of the total Environment, 268(1-3): 95-106. Kumar, M. and T. Singh. Environmental Monitoring and Assessment Remote Sensing Approach. Department of Earth, Sciences Indian Institute of Technology Bombay, India. Available from WSEAS On-Line Library: http://www.wseas.org/online. Lee, Z.P., K.L. Carder and R.A. Arnone, 2002. Deriving inherent optical properties from water color: a multiband quasi-analytical algorithm for optically deep waters. Applied Optics, 41(27): 5755-5772. Li, Y., W. Lu and H. Wang, 2007. Inversing chlorophyll-a concentration by multi-temporal models using TM images. 27th International Congress on High-Speed Photography and Photonics, pp: 62795H.
276 J. Appl. Sci. Res., 8(1): 271-276, 2012
Lim, H., M. MatJafri and K. Abdullah, 2009. Turbidity measurement from ALOS satellite imagery. OCEANS 2009-EUROPE Bremen, IEEE, pp: 1-5. Lim, H., M. MatJafri, K. Abdullah, A. Alias, J. Rajab and N.M. Saleh, 2008. Algorithm for TSS Mapping using satellite data for Penang Island, Malaysia. Fifth International Conference on Computer Graphics, Imaging and Visualisation, 2008. (CGIV '08). Penang, IEEE, pp: 376-379. Lim, H., M. MatJafri, K. Abdullah and R. Asadpour, 2011. TSS Mapping Using THEOS Imagery over Penang Island, Malaysia. The First International Conference on Interdisciplinary Research and Development, Thailand, pp: 55.1-55.6 Lim, H., M. MatJafri, K. Abdullah, M. Saleh and H. The, 2009. Water Total Suspended Solids (TSS) Mapping Using Landsat TM Data Over Penang Island, Malaysia. The 2nd International Conference On Earth Observation For Global Changes (EOGC 2009), . Chengdu, Sichuan, China. Nelson, S.A.C., P.A. Soranno, K.S. Cheruvelil, S.A. Batzli and D.L. Skole, 2003. Regional assessment of lake water clarity using satellite remote sensing. Journal of Limnology, 62: 27-32. Olliver, J., 2001. Datums and Map Projections for remote sensing, GIS and surveying. Survey Review, 36(279): 71-72. Ritchie, J.C. and C.M. Cooper, 2001. Remote sensing techniques for determining water quality: Applications to TMDLs, pp: 367-374. Shafique, N., B.C. Autrey, F. Fulk and S.M. Cormier, 2001. The selection of narrow wavebands for optimizing water quality monitoring on the Great Miami River, Ohio using hyperspectral remote sensor data. Journal of Spatial Hydrology, 1(1): 1-22. Strickland, J. and T. Parsons, 1972. A practical handbook of seawater analysis bulletin 167. Fisheries Research Board of Canada, Ottawa 310. Syahreza, S., H. Lim, M.Z.M. Jafri and K. Abdullah, 2010. Monitoring the Total Suspended Solids (TSS) using High Spatial Resolution Satellite of THEOS. THE 4TH ASIAN PHYSICS SYMPOSIUM—AN INTERNATIONAL SYMPOSIUM, pp: 155-159.