The query log data of a search engine record the user queries, along with the ... of selections of documents against their position in the ranking of a given query. ..... The best strategy consists in ordering the documents according to the sur-.
A Statistical Model of Query Log Generation Georges Dupret1 , Benjamin Piwowarski1, Carlos Hurtado2 and Marcelo Mendoza2 2
1 Yahoo! Research Latin America Departamento de Ciencias de la Computaci´ on, Universidad de Chile
Abstract. Query logs record past query sessions across a time span. A statistical model is proposed to explain the log generation process. Within a search engine list of results, the model explains the document selection – a user’s click – by taking into account both a document position and its popularity. We show that it is possible to quantify this influence and consequently estimate document “un-biased” popularities. Among other applications, this allows to re-order the result list to match more closely user preferences and to use the logs as a feedback to improve search engines.
1
Introduction
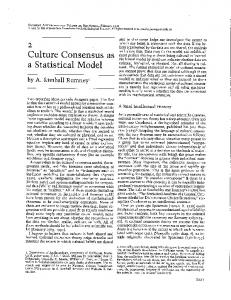
The query log data of a search engine record the user queries, along with the URL and the position of selected documents in the list returned to the user. Documents can then be reordered according to their popularity for a given query. If a discrepancy is observed between this new order and the search engine ranking, some action can be taken to improve the engine. In Fig. 1 we plotted the number of selections of documents against their position in the ranking of a given query. It is intuitive that documents at positions 2 and 4 should be re-ordered because the latter has a higher popularity among users. Nevertheless, comparison of the documents appearing at positions 9 and 13 reveals a caveat of this method: The lower popularity of the latter document might be caused by a less favorable position rather than by a lower relevance to the query. In this work, we propose to explain the selections observed in the logs as the result of a process that reflects 1) the attractiveness of a document surrogate for a particular query, 2) the ability of the engine to assess the document relative relevance accurately and 3) the influence of the position of the document on user selections. In Section 2 we model these different aspects and gain insight into the log generation process. To have an intuitive understanding of this model, imagine for a moment that the search engine of Fig. 1 is stochastic and ranks a given document, say u, half of the time at rank 6, and half of the time at rank 15. (This situation may seem unrealistic, but in fact each time the document collection is updated, the ranking for a given query is altered and the engine, although deterministic, appears as stochastic in the logs.) If we observe 3 times more user selections when u is presented at position 6 than when presented at position 15,
G. Dupret et al.
40
4
30 9 2
20
13
10 0 0
5
10
15
20
25
30
position
Fig. 1. Number of selection of documents per position for a typical query.
we can draw the conclusion that the position effect at position 6 is three times larger than at to position 15 (Section 2.2). Once the relative position effect is known, it is possible to compensate it on the observed popularity of document surrogates and re-order documents accordingly. In Section 3, we derive statistics that relate the model to aggregated values like the engine precision and the observed number of selections at a given position. Section 4 presents the results of numerical experiments based on the logs of a real search engine. In Section 5 we examine some re-ordering strategies found in the literature in terms of our model. Finally, in Section 6 we compare this work to the model proposed by Radlinski and Joachims [5] and report other potential applications.
2
Log Generation Model
In this section, we describe a probabilistic model of user selections which gives rise to the logs. It makes use of two hidden, latent variables, namely the influence of the position on user decisions and the attractiveness of the surrogate for a given query. The resulting Bayesian model makes a conditional independence assumption on these two variables. 2.1
Variables and Assumptions
We consider that an observation in the log is the realization of four random variables: A query (q) issued by the user, a document (u), the position of the document (p) and the information about whether the document was selected or not by the user (s). The probability of observing a selection is written PS (s, p, u, q), where the subscript S recalls the relation with the selections observed in the logs. More specifically, a query q is defined as a sequence of terms given to the search engine. A significant number of queries are repeated by different users at different times, giving rise to various query sessions of q.
A Statistical Model of Query Log Generation Table 1. Variables of the log-generation model q u a p c s
discrete discrete binary discrete binary binary
the the the the the the
query is q. document or URL is u. document surrogate is attractive and justifies a selection. position of the document is p. user considers a given position. user selects the document.
The selection of a document u following a query q depends on the surrogate “attractiveness” a of the user who issued query q. When a is true, we say that the surrogate is attractive. The probability of a being true reflects the proportion of users that estimate that the surrogate is promising enough to justify a selection. If we make the assumption that the surrogate represents fairly the document, the probability of a can be interpreted as a relative measure of relevance. This is the approach taken by Radlinski and Joachims [5] among others. It is relative because only the relative relevance of selected documents can be compared this way [3]. While click-through data is typically noisy and clicks are not perfect relevance judgements, the user selections do convey information [8,4]. Occasional user selection mistakes will be cancelled out while averaging over a large number of selections. The question of how large should the logs be to counterbalance user variability and mistakes is an open question. The observed noise is large, which suggests that a large quantity of data is necessary. On the other hand, commercial search engines generate an enormous amount of data, and the comparatively small amount used in experiments reported in the literature [9,10,5] have led to satisfactory results. The decision about the surrogate attractiveness can be regarded as a “positionless” process where users fetch all documents whose surrogate is pertinent to their query, wherever they are situated in the ranking. This is modelled by the upper part of the Bayesian network in Fig. 2: If the surrogate of document u is relevant to query q, the binary variable a is true. It is false otherwise. Depending on the position p of document u in the ranking of query q, the user will consider the document or not, as reflected by the variable c (“consideration”). If this process was the only one involved in document selection, it would suppose “blind” users who select documents based solely on their position in the ranking or on any other interface artifact that appear at fixed positions like the division of results in pages. In the “blind” process, selecting a document or not is entirely determined by the document position p. The position p in turn is determined exogenously by the search engine based on the document u, the query q and the entire document collection (not represented because it is fixed), as shown by the lower branch of the Bayesian network. The existence of a bias due to the position of a document is well documented in the literature. Joachims [4] observes that despite differences in the quality of the ranking, users tend to click on average at the same positions.
G. Dupret et al.
q
a
u
p
s c
Fig. 2. Bayesian Network associated with the Log-Generation Model
2.2
Model and Estimation
According to the assumptions we just identified, we apply the chain rule to the probability of observing a selection (Fig. 2): P(s, c, a, p, u, q) = P(s|a, c)P(c|p)P(p|u, q)P(a|u, q)P(u)P(q) where P(s|a, c) is deterministic because a user selects a document only if its surrogate is both attractive and considered. To eliminate the latent variables, we marginalize P(s, c, a, p, u, q) over a and c. Using the boldface (s, c or a) for binary random variables to denote the event “s, c or a is true”, we have: PS (s, p, u, q) = P(c|p)P(p|u, q)P(a|u, q)P(u)P(q) We introduce mnemonic indices. The term P(c|p) is rewriten PP (c|p) to emphasize that it represents the position effect on user decision to make a selection. The term P(p|u, q) is the probability that a document is presented at position p. As this depends exclusively on the search engine, we add the subscript E. The term P(a|u, q) is the probability that the surrogate is attractive given the query. We use the subscript A to mark this fact. The log-generation model is: Lemma 1 (Generation Process). The process governing the log generation obeys to PS (s, p, u, q) = PA (a|u, q)PP (c|p)PE (p|u, q)P(u)P(q) The quantities PS (s, p, u, q) and PE (p|u, q) can be estimated by simple counting from the logs: PS (s, p, u, q) is estimated by the number of selection of document u at position p for all the sessions of query q, divided by the number of query sessions. PE (p|u, q) is estimated by the number of times u appears in position p of query q, divided by the number of sessions of q. P(u) = 1/U where U is the total number of documents. It is uniform and independent of P(q). The probability of observing a query is estimated by the proportion of sessions for that query. The remaining two probabilities PP (c|p) and PA (a|u, q) can be estimated using Lemma 1. We remark first that if P∗A (a, u, q) and P∗P (c|p) represent a solution to this system, then λP∗A (a, u, q) and (1/λ)P∗P (c|p) is also a solution for any constant1 λ �= 0. This reflects that only the relative position effect can be 1
Note that this solution may not be valid from a probabilistic point of view.
A Statistical Model of Query Log Generation
� estimated. In practice, we either set p PP (c|p) = 1 or set the effect of a given position to a constant, say PP (c|p = 1) = 1 and normalize P∗P (c|p) afterward. If the search engine is deterministic, i.e. if PE (p|u, q) = {0, 1} ∀u, q, a simple analysis shows that there are more unknowns than equations in the system. Intuitively, this reflects that if each document appear always at the same positions in the ranking of a query, it is impossible to distinguish the effects of attractivity and position. The vast majority of search engines are designed to order the documents in a deterministic way, but in practice each time the document database is updated, the ranking of documents is altered, giving rise to a situation where the engine appears as stochastic and the system of equations can be solved. If we restrict the system to the cases where 0 < PE (p|u, q) < 1 (inequalities are strict), we can transform the model into an overspecified system of linear equations by taking the logarithm: �
P (s,p,u,q) log PA (a, u, q) + log PP (c|p) = log PS (p|u,q) E log PP (c|p = 1) = log(1) = 0
(1)
where the unkowns are log PA (a, u, q) and log PP (c|p). The advantage is that the system can be solved now using standard software for sparse matrix algebra.
3
Aggregate Behavior
In this section we study the relation between the log generation process and aggregate values like the total number of selections at a position, the position effect and the engine precision. The proportion of selections at a given position is simply the sum over all queries and documents of the selections at that position: Definition 1 (Proportion of Selections at a position). The proportion of selections at position p is defined as Sp =
�
PS (s, p, u, q)
u,q
Similarly, we also define S =
� p
Sp .
To obtain the expected number of selections at a position, one need to aggregate Sp over all the sessions. Precision is traditionally defined as the concentration of relevant documents in the result set. We can define by analogy a surrogate precision measure. To obtain the contribution of position p to this new measure, we observe that a document is placed at p by the engine with probability PE (p|u, q) and its surrogate is attractive with a probability PA (a|u, q). By aggregating over documents and queries, we obtain:
G. Dupret et al.
Definition 2 (Attractiveness Gain). For a given search engine, the attractiveness gain achieved at position p is the sum of the attractiveness of the documents surrogates appearing at that position: � Gp = PA (a|u, q)PE (p|u, q)P(u)P(q) u,q
If we make the assumption that the surrogates are fair representations of the documents, we can take the probability of attractiveness as an estimate of the document probability of pertinence. The sum of the gains up to rank k is then an empirical measure of the search engine precision at rank k. Note that this measure cannot be used to compare two different search engines in different settings [3]. We can now explain the selections observed in the logs as a consequence of Lemma 1 (Log Generation Process) and Definitions 1 and 2: Lemma 2 (Aggregate Behavior). The proportion of selections Sp at position p is the product of the gain and the position effect: Sp = Gp PP (c|p). A first consequence of this lemma concerns deterministic search engines where the probability PE (p|u, q) of finding document u at position p is 1 for a given position puq and 0 everywhere else: Rewriting the aggregate behavior in Lemma 2 with p = puq , we obtain PA (a|u, q) =
Gp P (s, p|u, q) Sp S
This matches intuition because the number of selections Sp generally decreases with the position and because selection at a later position is a better indicator of a surrogate attractiveness than a selection among the first positions. On the other hand, the term Gp counter-balances this effect and reflects the ability of the search engine to place attractive surrogates first.
4
Numerical Experiment
To illustrate the proposed method, we apply the former results to the logs of todocl, a search engine of the Chilean Web, for two periods of approximately 3 and 6 months separated by a new crawling. Various characteristics of the logs are shown in Table 2. The last column reports the numbers of distinct queries and documents that appear in both logs. We denote the three months log by L3 and the six months log by L6 . We first examine the impact of a strong and wrong simplifying assumption of our model, namely that the popularity of a surrogate does not depend on the surrogates that precede it in the results list and does not depend on the previous
A Statistical Model of Query Log Generation Table 2. Characteristics of the three (L3 ) and six months (L6 ) logs and their intersection. The number of sessions in the last column is the sum of the number of sessions involving the queries and URL common to both logs. L3 L6 Common Distinct Queries 65,282 127,642 2,159 Distinct selected URLs 122,184 238,457 9,747 Sessions 102,865 245,170 52,482
user selections during a given session, or at least that these effects cancel out. If this hypothesis is true, we should have that the popularity estimates in L3 and L6 are approximately equal: ˆ 3A (a|p3 , u, q) � P ˆ 6A (a|p6 , u, q) P where p3 and p6 are the position of u in the results of q in L3 and L6 respectively. Because we cannot evaluate the probability of attractiveness directly, we restrict our attention to the cases where p3 = p6 : We select the document query pairs whose document occupies the same position in the two logs. Formally, this set is defined as I = {(u, q)|(u, q) ∈ L3 , (u, q) ∈ L6 , p3 (u, q) = p6 (u, q)}. For these ˆ 3 (s|p3 , u, q) � pairs, the position effect cancels out and the assumption holds if P S 6 3 ˆ ˆ PS (s|p6 , u, q) where PS (s|p, u, q) denotes the estimate of PS (s|p, u, q) derived
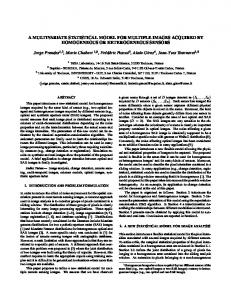
ˆ 6S (s|p, u, q) its equivalent from L6 . from L3 and P The set I contains 2,159 distinct queries and 7,755 distinct documents for 8,481 pairs. Although for some pairs (u, q) ∈ I the document u remains at the same position, the ranking of the other documents do change. This change in the context of the document is significant: Denoting Qc the sets of queries q containing at least one document u that has not changed its position (i.e. (u, q) ∈ I), a query in Qc contains an average of 14.1 and only 5.2 distinct documents in L6 and L3 respectively, revealing that the list of results contain different documents before and after the new crawl. The new position of documents that have been displaced by the new crawl are in average 7.8 ranks apart from the original one. ˆ 3 (s|p, u, q) estimates for the (u, q) pairs of I in 10 In Fig 3, we divide the P S bins of equal range and represent the corresponding six months estimates in 10 ˆ 3S (s|p, u, q) between 0.4 and 0.5 (the ].4, .5] box-plots. Considering for example P ˆ 6S (s|p, u, q) is bin on the plot), we observe that the median of the corresponding P slightly larger than 0.4. On the other hand, the lower and upper hinges (median of estimates smaller and larger than the median) are approximately 0.25 and 0.5, respectively. The alignment of the box-plot medians with the diagonal shows that the surrogate estimate is stable under context variations, leading to the conclusion that the impact of previous selections tends to cancel out. If the median aligned on a horizontal line, this would mean that selections were governed by variables not included in the model. On the other hand, the large variation imply that
G. Dupret et al. 17141511 979 784 166 94 178 78
28
4
1.0
0.8
0.6
0.4
0.2
0.0 ]0,.1]].1,.2]].2,.3]].3,.4]].4,.5]].5,.6]].6,.7]].7,.8]].8,.9]].9,1]
Fig. 3. On the lower axis, the estimates of the probability of selecting a document in a session of a query have been divided in 10 bins according to their values. For example, ˆ 3S (s|p, u, q) ≤ 20%. the second bin corresponds to the u, q pairs for which 10% < P ˆ 6S (s|p, u, q) On the ordinate, we have for each of these u, q pairs the corresponding P estimate. On the upper axis, we report the number of u, q pairs that fall into the bin. The median is indicated by the black center line. The first and third quartiles are the edges (hinges) of the main box. The extreme values (more than 1.5 the lower/upper inter-quartile range) are plotted as points and are situated after the notches.
estimates will suffer from large variance. The inclusion of more variables into the model might reduce this problem, but this needs to be verified. The medians alignment to the diagonal deteriorates as the document popularity increases, suggesting that surrogates that enjoyed a high popularity in L3 experience some decrease in L6 (Sic transit gloria mundi 2 ). This can be due partly to the documents getting outdated compared to documents that appear for the first time in L6 . Moreover, because L6 contains twice as many documents, there is potentially a larger number of attractive surrogates for each query. This will partly divert selections from the documents already in L3 and push down the relative number of selections. The larger distance of the median from the diagonal will induce a bias in the estimates of the model. We compute the gain Sp from the solution of the linear system in Eq. 1 and plot it in Fig. 4 (triangle). While the position effect is expected to display discontinuities, in particular where pages change, it is reasonable to make the hypothesis that the gain decreases smoothly. We use a linear regression of second order on the experimental values and plot it as a continuous curve on Fig. 4. The position effect (circles) decreases from a 5% at position 1 and stabilizes around 3% around position 20, inducing that users are approximately 1.7 more likely to make a selection at the first than at the latter position in the blind 2
Thus passes away the glory of the world
A Statistical Model of Query Log Generation 12% Sp Gp PP (c|p)
8%
4%
2%
0
5
10
15
20
25
30
Position
Fig. 4. All values are normalized by the sum of their values over positions 1 to 30. 1) The normalized number of selections Sp at position p (squares). 2) The position effect PP (c|p) (squares). 3) The normalized gain Gp (triangle).
process. There is a distinct increase of the position effect corresponding to the page change at position 10. The gain presents a slope similar to the probability of selections, suggesting that users of the todocl engine are more influenced by the relevance of surrogates than by their position, although much larger samples of log data should be used to obtain reliable position effect estimates before definitive conclusions are drawn.
5
Re-ordering Strategies
We analyze in this section various strategies to take the logs into account in the document re-ranking and derive what Radlinski and Joachims [5] call a osmosis search engine, i.e. an engine that adapts itself to the users. These authors consider that the surrogates represent fairly the documents and that ordering according to the attractiveness respects the preference of the users for the documents themselves. We make the same hypothesis in this section and its results are valid only if it holds. In order to compare two ranking strategies, we need to identify what the optimal ordering strategy should be. An optimal search engine estimates accurately the relevance of documents to queries, orders them accordingly and presents adequate surrogates to the users: Definition 3 (Optimal Search Engine). A search engine is optimal if, for all documents u and v and all query q, we have that puq < pvq ⇔ PA (a|u, q) > PA (a|v, q). where puq and pvq are the positions of documents u and v in the result list of query q.
G. Dupret et al.
A consequence of this definition is that optimal search engines are almost always deterministic: Only when PA (a|u, q) = PA (a|v, q) can a search engine be both stochastic and optimal. The best strategy consists in ordering the documents according to the surrogates attractivity estimates, but it might be interesting to analyze the consequence of ordering according to the observed number of selections. Under this scheme, two documents are swapped if PS (s, p2 , u2 , q) > PS (s, p1 , u1 , q) and p2 > p1 . If the engine is deterministic, this can be rewritten PA (a, u2 , q)PP (c|p2 ) > PA (a, u1 , q)PP (c|p1 ). This strategy implies that we have a permutation if PA (a, u2 , q) >
PP (c|p1 ) PA (a, u1 , q) PP (c|p2 )
This is adequate only if the position effects are equal. On the other hand, if PP (c|p1 ) is sufficiently larger than PP (c|p2 ), document u2 remains trapped at its original position. Most applications that do not attempt to re-order selections, like query clustering [10], simply discard document popularity and consider only whether a document was selected or not. This is equivalent to setting the position effect and the popularity to a constant.
6
Related Work
In [5], Radlinski and Joachims pursue a goal similar to our. Based on eye tracking study and expert judgements, they identify six preference feedback relations based on query logs. For example, the selection of a document is interpreted as a preference feedback over all the documents preceding it in the list, but not selected. They observe that users often reformulate their query to improve search. The set of reformulation –called a query chain– is used to derive a relation of preference among documents. The selection of a document is interpreted as a preference feedback over all the preceding documents appearing but not selected in earlier formulations of the query. The preference relations are then set as constraints and used to train a Large Margin classifier. It is interesting to compare the assumptions in Radlinski and Joachims [5] to ours. The preference feedback over preceding unselected documents parallels our assumption that documents should be ordered according to their (un-biased) popularity, and that the position of the selected document is of importance. They take popularity into account because a positive feedback is accounted for each document selection, and they take position into account because documents selected at latter positions have a preference relation over a larger number of documents than selected documents appearing at the top of the list. Popularity and position are thus two main variables in both their analysis and ours. On the other hand (provided we have enough data) we are able to derive a quantitative estimate of the position effect with no need of a priori hypothesis while Radlinski and Joachims fix arbitrarily some parameters to limit how quickly the original order is changed by the preference feedback data.
A Statistical Model of Query Log Generation
Our model does not take into account the influence of previous selections on user next selection. To a certain extent, Radlinski and Joachims include this information implicitly because no preference feedback is derived over a document that was previously selected. This is probably the most severe limitation of our model and the topic of future work. Future work should also attempt to take query chains into account. Both methods fail to address the problem of ambiguous queries. An example of such query is “car” that refers to several topics like “renting a car”, “buying a car”, etc. The user has probably one and only one of these topics in mind and will select documents accordingly. The problem for both models is that they are attempting to order documents in answer to different information needs into a single list. A possible solution is to previously disambiguate queries [2]. In conclusion, Radlinski and Joachims model is more complete than ours essentially because previous selections are taken into account although implicitly. Our model on the other hand is less heuristic and makes explicit assumptions. It opens the doors to a more formal analysis. It also offers some primary theoretical results. The position effect is quantifiable, the difference between document preferences and surrogate attractiveness is made and dependence relations between variables is determined before hand.
7
Conclusions
We proposed a theoretical interpretation of data found in search engine logs. For a given query, it assumes that two factors influence a document selection: the position of the document in the result list and the attractiveness of the document surrogate. The main objective of this model is to estimate the effect of the document position in the ranking on users decisions to select it, thereby getting an un-biased estimate of the attractiveness of the document surrogate. We foresee various applications to this work, but the most important one relates to the development of search engine that learns to rank documents from the users. Frequent queries rankings can be altered and cached to match users preferences rather than engine scores and consequently increase the engine precision3 . Moreover, the score function of the search engine can be tuned based on user selections to improve the engine precision both on queries already in the logs and on future queries. Probabilistic retrieval models [7,6] rely on the probability of a document term to flag a relevant document given a query term. The estimation of this probability is based on user feedback and is unpractical to obtain explicitly, making the possibility to extract automatically the necessary information from the logs an important and novel method to improve significantly these engines. It is also important to weight appropriately the documents in the relevance set when using feedback methods or when clustering queries. The knowledge of the influence of the position of a document on users selections decisions can be 3
Pre-computation of frequent queries is also an effective way of improving engine speed due to the heavy skew of the query frequency distribution [1].
G. Dupret et al.
used to study the interface. Our approach was developed for results presented in list, but it is straightforward to extend it to tables of images or other multimedia content where the automatic estimation of a relevance score to a query is usually more problematic than for text documents. The influence of previously seen documents on the user selection decision was neglected in the model. A user who finds a document that fulfil his information need is not likely to continue his search, thereby discarding other relevant documents. This is a topic for future work.
Acknowledgments Carlos Hurtado was supported by Millennium Nucleus, Center for Web Research (P04-067-F), Mideplan, Chile.
References 1. R. Baeza-Yates and F. Saint-Jean. A three level search engine index based in query log distribution. In SPIRE 2003, Manaus, Brazil, October 8-10, 2003. Proceedings, Lecture Notes in Computer Science 2857, pages 56 – 65, 2003. 2. G. Dupret and M. Mendoza. Recommending better queries based on click-through data. In Proceedings of the 12th International Symposium on String Processing and Information Retrieval (SPIRE 2005), LNCS 3246, pages 41–44. Springer, 2005. 3. T. Joachims. Evaluating search engines using clickthrough data. Department of Computer Science, Cornell University, 2002. 4. T. Joachims. Optimizing search engines using clickthrough data. In KDD ’02: Proceedings of the eighth ACM SIGKDD, pages 133–142, New York, NY, USA, 2002. ACM Press. 5. F. Radlinski and T. Joachims. Query chains: learning to rank from implicit feedback. In KDD ’05: Proceeding of the eleventh ACM SIGKDD international conference on Knowledge discovery in data mining, pages 239–248, New York, NY, USA, 2005. ACM Press. 6. B. A. Ribeiro-Neto and R. Muntz. A belief network model for IR. In SIGIR ’96: Proceedings of the 19th annual international ACM SIGIR conference on Research and development in information retrieval, pages 253–260, New York, NY, USA, 1996. ACM Press. 7. S. E. Robertson and K. S. Jones. Relevance weighting of search terms. Taylor Graham Publishing, London, UK, UK, 1988. 8. T. Joachims. Unbiased evaluation of retrieval quality using clickthrough data. Technical report, Cornell University, Department of Computer Science, http://www.joachims.org, 2002. 9. J.-R. Wen, J.-Y. Nie, and H.-J. Zhang. Clustering user queries of a search engine. In WWW ’01: Proceedings of the 10th international conference on World Wide Web, pages 162–168, New York, NY, USA, 2001. ACM Press. 10. O. R. Za¨ıane and A. Strilets. Finding similar queries to satisfy searches based on query traces. In Proceedings of the International Workshop on Efficient Web-Based Information Systems (EWIS), Montpellier, France, Sept. 2002.