lar to the rolling direction. As shown in Fig. 1, these sections were friction stir welded together using a tool having a 23.0 mm diam- eter shoulder and an 8.2 mm ...
M. A. Sutton A. P. Reynolds Dept. of Mechanical Engineering, University of South Carolina, Columbia, SC 29208
D.-Q. Wang C. R. Hubbard High Temperature Materials Lab, Oak Ridge National Laboratory, Oak Ridge, TN 37830
1
A Study of Residual Stresses and Microstructure in 2024-T3 Aluminum Friction Stir Butt Welds Three-dimensional residual stress mapping of an aluminum 2024-T3 arcan specimen, butt-welded by the friction stir technique, was performed by neutron diffraction. Results indicate that the residual stress distribution profiles across the weld region are asymmetric with respect to the weld centerline, with the largest gradients in the measured residual stress components occurring on the advancing side of the weld, with the longitudinal stress, L , oriented along the weld line, as the largest stress. Within the region inside the shoulder diameter, the through-thickness stress, Z , is entirely compressive, with large gradients occurring along the transverse direction just beyond the shoulder region. In addition, results indicate a significant reduction in the observed residual stresses for a transverse section that was somewhat closer to the free edge of an Arcan specimen. Microstructural studies indicate that the grain size in the weld nugget, is approximately 6.4 microns, with the maximum extent of the recrystallized zone extending to 6 mm on each side of the weld centerline. Outside of this region, the plate material has an unrecrystallized grain structure that consists of pancake shaped grains ranging up to several mm in size in two dimensions and 10 microns in through-thickness dimension. 关DOI: 10.1115/1.1429639兴
Introduction
Friction stir welding 共FSW兲 is a solid state joining process invented at TWI in 1991. The process is solid state and as such, temperatures experienced near the weld are lower than those experienced during fusion welding and there are no large density changes due to a solid-liquid transformation. It is anticipated that FSW will result in lower residual stress and distortion when compared to fusion welding techniques 关1兴. The in-situ extrusion process used to produce the FSW results in a gradation of microstructure across the weld. In the 2024-T3 alloy considered here, a refined, equiaxed grain structure is observed in the weld nugget and large grains elongated in the rolling direction comprise the parent material. Typical joint strength for 2024-T3 FSW’s is in the range of 80– 85 percent of the base metal. Advantages of the FSW process for welding aluminum include elimination of consumables such as filler wire and shielding gas, no solidification zone in the weld region, thereby mitigating cracking problems associated with segregation during solidification of the weld metal. In addition, the FSW process allows one to fabricate butt- and lap-seam welds between wrought, cast, and extruded materials, leading to simplified fabrication processes while producing none of the health hazards typically associated with welds 共e.g., fume, spatter, and radiation, etc.兲. As a relatively new manufacturing process, there is little published research on how friction stir welding affects the fatigue crack growth and tearing strength of structural components. For example, it is well known that residual stresses can affect the fatigue crack growth process, and possibly the ductile tearing behavior under mixed mode loading 关2兴. To better understand the response of a FSW structure undergoing general loading, as well as its true fatigue crack growth resistance, the residual stress distribution is needed. In this study, the three residual normal stress components are measured in the FSW region of an Arcan specimen machined from aluminum 2024-T3. The residual stresses Z 共through thickContributed by the Materials Division for publication in the JOURNAL OF ENGINEERING MATERIALS AND TECHNOLOGY. Manuscript received by the Materials Division March 23, 2001; revised manuscript received July 20, 2001. Associate Editor: S. Mall.
ness兲, T 共transverse兲 and L 共longitudinal兲, were measured using the neutron diffraction technique. To obtain reliable residual stress measurements, microstructural measurements were made to determine how the grain structure varies with position in the FSW, providing information regarding required sampling volume size. Results for each stress component are presented and discussed in the following sections.
2
Experimental Methods
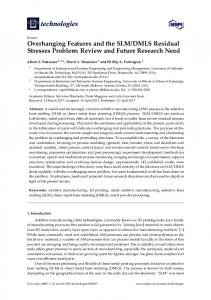
The material used in this work is a rolled 2024-T3 aluminum plate 共Al-4.5 percent Cu-1.5 percent Mg based alloys兲 having a thickness of 7 mm. In this work, a 1.22 m by 2.44 m plate was cut into two square pieces, with the plane of the cut being perpendicular to the rolling direction. As shown in Fig. 1, these sections were friction stir welded together using a tool having a 23.0 mm diameter shoulder and an 8.2 mm diameter pin. Measured process parameters were a rotational speed of 360 rpm and a travel speed of 3.3 mm/s perpendicular to the rolling direction of the sheet. Figure 1 shows a crown-side view of a typical FSW used in this work. During the FSW process, the tool shoulder contacts the crown side of the two sections during processing while the root side is in direct contact with a backing plate and opposite to the crown side. The advancing and retreating sides of the weld correspond to where the maximum and minimum relative velocities between the tool and work-piece are observed. After completing the welding process outlined above, the sheet was cut into several Arcan specimens. The Arcan specimens, which were used in this work to determine the residual stress distribution after friction stir welding, are shown in Fig. 2. 2.1 Microstructure in FSW Region. To acquire high contrast images of each FSW microstructure, metallographic specimens were prepared by standard techniques and etched with either Keller’s etch, Barker’s etch, or hydrofluoric acid. All photomicrographs were taken using either a light microscope or a scanning electron microscope 共SEM兲, depending upon the size of the features to be characterized. Figure 3 presents a schematic of a FSW specimen, along with definitions for both the Cartesian axes and section planes used in this work. As shown in Fig. 3, the longitudinal 共L兲 axis coincides with the direction of tool travel. The depth
Journal of Engineering Materials and Technology Copyright © 2002 by ASME
APRIL 2002, Vol. 124 Õ 215
Fig. 1 Crown-side view of FSW process
共Z兲 axis is in the specimen thickness direction and directed towards the weld crown. The transverse 共T兲 axis is perpendicular to the direction of tool travel and is directed towards the advancing side of the weld; depending upon the direction of tool rotation, the L-T-Z coordinate will either be a right-handed 共CW tool rotation兲 or left-handed 共CCW tool rotation兲 system. In this work, it is a left-handed coordinate system. The origin of the L-T-Z coordinate system is at mid-thickness at the weld centerline, where the longitudinal location of the origin within the specimen is arbitrary. Each vertical transverse cross-section is parallel to the T-Z plane and perpendicular to the longitudinal axis. A vertical longitudinal cross-section is parallel to the L-Z plane and located at a pre-selected T⫽T 0 location. The positive and negative values for T 0 correspond to cross-sections on the advancing side and retreat-
Fig. 4 Microstructure as a function of transverse location in vertical transverse cross-section at mid-thickness of specimen „ Z Ä0…
ing side of the weld, respectively. A horizontal cross-section is parallel to the L-T plane and located at a depth position Z⫽Z 0 . The positive and negative values for Z 0 correspond to crosssections on the crown side and root side of the weld, respectively. Figures 4 and 5 present micrographs showing the evolution of 2024-T3 microstructure in the FSW region. Figure 4 shows how
Fig. 2 Arcan specimen with location of friction stir weld
Fig. 3 Coordinate system and cross-sectional designations for micro-structural investigations
216 Õ Vol. 124, APRIL 2002
Fig. 5 Microstructure as a function of through-thickness location in vertical direction
Transactions of the ASME
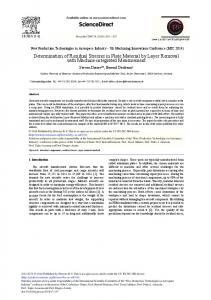
the microstructure evolved within a vertical transverse section as a function of transverse position and depth. The central portion of the friction stir weld, or ‘‘nugget,’’ has a refined microstructure that is consistent in general character with previous observations 关3–5兴. At the edge of the welding tool’s pin, an abrupt transition occurs from the highly refined, equiaxed, grains comprising the nugget to the deformed base metal grains. At a location corresponding to approximately the tool shoulder radius on the advancing side, a relatively coarse, recrystallized grain structure is observed. At 4.5 mm from the edge of the shoulder, the microstructure appears to be identical to the original, elongated grain structure present in the rolled, 2024-T3 base material. Figure 5 shows how the microstructure changes with throughthickness position in a vertical longitudinal cross-section (T ⫽0). As one travels from the crown to the root of the FSW, the grain size decreases, most likely due to the higher heat input near the crown that causes additional grain growth in this region. As the trailing edge of the shoulder passes over the welded material, a substantial amount of heat is generated causing grain coarsening in the crown relative to the root of the weld. In summary, the grain size variation across and through the FSW region has been investigated. In the weld nugget, the average grain size is 6.4 microns. The maximum extent of the recrystallized zone is 6 mm on each side of the weld centerline. Outside of this region, the plate material has an unrecrystallized grain structure that consists of pancake shaped grains that are elongated in the L-T directions and thin in the Z direction; approximate unrecrystallized grain size is 10 microns in the Z-direction, and several millimeters along both the rolling direction 共L兲 and transverse direction 共T兲. It is noted that this variation in grain structure is typical of friction stir welds in recrystallization-resistant aluminum alloys. 2.2 Microstructure and Neutron Diffraction. Results from the microscopy studies indicate that an average grain size of 6.4 microns is present across the weld centerline. This refined grain structure assures that a good statistical average will be obtained using typical neutron diffraction sampling volume sizes 共e.g., 2 mm⫻2 mm⫻2 mm兲. Furthermore, our neutron diffraction results indicate that texture effects are minimal, as the neutron diffraction peak intensity had only minor variations. 2.3 Neutron Diffraction Measurements. As shown in Fig. 6, the normal stresses Z , T , and L were determined within two planar transverse sections, ABEF and CDGH, that cross the weld line with 65 data points in each section. The 5⫻13 rectangular grid of data locations is symmetric about both the weld centerline and the transverse axis. Spacing is 1.25 mm in the normal 共Z兲 direction for all data points and 共a兲 4 mm for the eleven inner rows and 共b兲 6 mm for the outer two sampling rows. All neutron diffraction measurements were made at the High Flux Isotope Reactor of Oak Ridge National Laboratory using a modified triple-axis spectrometer 关6兴. A doubly focusing silicon crystal monochromator was used in the experiment. The take-off angle for the 共311兲 Si reflection of the monochromator was 84 deg, and the incident neutron wavelength was 1.65 Å. The aluminum 共331兲 reflection was used for determining the strains. Sampling volumes were 2⫻2⫻2 mm3 for longitudinal strain measurements and 1(T)⫻1(Z)⫻10(L) mm3 for both throughthickness and transverse strain measurements. The residual stresses were calculated using strain-stress conversion equations according to an isotropic, homogeneous form of Hooke’s law:
i j⫽
E E ⫹ ␦ 1⫹ i j 共 1⫹ 兲共 1⫺2 兲 i j kk
(1)
where k is a dummy suffix summing over all k 共i.e., kk ⫽ 11 ⫹ 22⫹ 33); E, the Youngs modulus; , the Poissons ratio; ␦ i j , Kronecker’s delta function. In this work, neutron diffraction data was obtained along three perpendicular directions 共1, 2 and 3 Journal of Engineering Materials and Technology
Fig. 6 Schematic of Arcan specimen with measurement locations „all units are in mm…
corresponding to the L, T, and Z directions, respectively兲, providing sufficient information to obtain the three normal stresses L , T , and Z , but not the shear stresses. 2.4 Calibration. To obtain the initial atomic spacing as a function of position within the weld region, long, rectangular comb-like samples with size 3 mm (T)⫻3 mm (Z)⫻24 mm (L), were cut from various locations in the FSW weld region using the electric discharge machining process 共EDM兲. Results from these studies indicate that the effects of chemical composition and grain size were quite small, introducing diffraction angle variations ⬍0.01 deg throughout the weld region. Thus, the baseline tests indicated that a single initial atomic spacing was sufficient throughout the FSW region. With regard to the neutron diffraction measurements, it is noted that all of the data was corrected for the effect of sample volume size since previous studies have shown that changing the sampling volume 共e.g., slit size兲 will induce an error in the angular measurements due to the difference in intensity uniformity in the sampling volumes. Using the following procedure, all of the 1⫻1⫻10 mm3 diffraction angle data was corrected to achieve the same baseline values as obtained for the 2⫻2⫻2 mm3 during calibration tests. First, the initial atomic spacing in a stress-free reference sample was obtained by performing neutron scattering experiments using both sampling volumes. By comparing the measured diffraction angle data obtained by both sampling volumes, and assuming that the smallest sampling volume 共2⫻2⫻2 mm3兲 is the reference state, all diffraction angle data for each neutron detector that was obtained using the 1⫻1⫻10 mm3 sample volumes were corrected by ⌬. Thus, if the diffraction angles for a given neutron detector and a 1⫻1⫻10 mm3 sampling volume is 1 , then the corrected diffraction angle for the 1⫻1⫻10 mm3 volume is corrected ⫽ 1 ⫹⌬ . 1 Based on the experimental neutron diffraction angle data, an estimate for the standard deviation in each measured strain component is 25 strain, which corresponds to a standard deviation in stress of approximately 4 Mpa. The effects of material anisotropy and sample re-positioning errors are not included in this error analysis. APRIL 2002, Vol. 124 Õ 217
Fig. 7 Longitudinal stress distribution in sections „a… CDGH and „b… ABEF
3 Residual Longitudinal, Transverse and ThroughThickness Stresses Figures 7, 8, and 9 present the longitudinal, transverse and through-thickness normal stresses throughout the FSW region in the Al-2024-T3 friction stir weld Arcan specimen. The measurement locations are shown on each figure as open circles. The data in Figs. 7–9 reveal that the residual stress distribution is a strong function of the (T,Z) position in the weld region and a somewhat weaker function of the L position. Similar to residual stress distributions observed in fusion welds 关6,7兴, the longitudinal stress was the largest tensile component, with a maximum stress of 105 MPa located at T⬇7.5 mm from the weld centerline 共Fig. 7兲 on the advancing side of the weld and at plate mid-thickness (Z⬇0); only a narrow region within the nugget near the root side of the weld has residual longitudinal stresses lower than 75 Mpa. As shown in Fig. 8, the transverse normal stress is tensile in the weld nugget region with a maximum of 70 MPa near the plate mid-thickness. As shown in Fig. 9, the through-thickness normal stress was the largest compressive component with a maximum of ⫺40 MPa兲 located near the root side (Z⫽⫺2.7 mm) and approximately 12 mm from weld centerline on both the advancing and retreating sides of the weld. Under the assumption that the residual shear stresses are negligible, Fig. 10 shows both the measurement locations and how the effective stress varies throughout the weld region. As shown in Fig. 10, the largest residual effective stresses are located just outside the pin diameter, extending from the crown side towards mid-thickness.
4
Discussion of Results
The effect of post-weld machining of the friction stir welded plate into the Arcan specimen is clearly visible through direct comparison of the results in Figs. 7–9 for the planes CDGH 共near the machined surface兲 and ABEF 共near the specimen centerline兲. 218 Õ Vol. 124, APRIL 2002
Consistent with the presence of a free boundary nearby, all three components of normal stress on CDGH were lower than measured at the centerline; ⬃15–20 MPa for both LL and TT , and ⬃5 MPa for ZZ . All three components, LL and TT , and ZZ , are asymmetric with respect to the weld centerline. Furthermore, inspection of Figs. 7–9 clearly shows that the largest gradients in the residual normal stress occur on the advancing side of the weld. The transverse locations of the largest residual stress gradients are in the proximity of the shoulder diameter and 10 mm beyond the advancing side location where sharp gradients in microstructure are observed 共see Fig. 5兲. Though still a subject of debate, it is speculated that the higher residual stress gradients in this region are related to higher thermal gradients on the advancing side, resulting in the observed asymmetry in the measured residual stresses. In this study, the normal, transverse, and longitudinal strains measured by neutron diffraction are three of the strain components at each point in the field. Inspection of the shoulder region in Figs. 7–9 indicates that gradient terms such as ZZ / T, LL / T and TT / Z are nonzero, resulting in nonzero gradients in shear stresses. Under such conditions, finite residual shear stresses are likely to be a general feature with the FSW region; similar results were observed recently 关6兴 for a butt-welded steel plate. Additional neutron diffraction experiments currently are being conducted on this specimen to determine the magnitude of the shear stresses in these regions. As outlined in recent analytical and computational work 关8,9兴, a friction stir weld is obtained by rotational extrusion of material around the tool and pin within a transverse region that is approximately bounded by the shoulder diameter at the crown and the pin diameter at the root, forming what may be called an extrusion zone. Due to the complexity of the FSW process, models of the process that are capable of predicting the residual stress fields have not been developed. Lacking a reliable model, the following Transactions of the ASME
Fig. 8 Transverse stress distribution in sections „a… CDGH and „b… ABEF
Fig. 9 Normal stress distribution in sections „a… CDGH and „b… ABEF
Journal of Engineering Materials and Technology
APRIL 2002, Vol. 124 Õ 219
Fig. 10 Equivalent stress distribution in sections „a… CDGH and „b… ABEF
mechanics-based explanation is provided in an effort to provide a qualitative framework for understanding the overall trends shown in Figs. 7–9. Consolidation of the FSW material is achieved within the extrusion zone through downward forces exerted by the tool shoulder. Due to the deformation constraint provided by the relatively cold material along each side of the extrusion zone, heating of the extruded material will result in thermal expansion that cannot be accommodated by the surrounding material. Thus, the extruded material experiences compressive plastic strains in both the transverse and longitudinal directions. Since the plastic state is incompressible, this requires that the extruded material must undergo extensional plastic strain in the Z-direction. As the extrusion zone is deforming plastically, the material outside of the extrusion zone remains elastic. Thus, after cooling, the elastic material surrounding the extrusion zone will attempt to return to its initial configuration. Since the plastically deformed material within the extrusion zone will try to retain its permanent deformation, the resulting incompatibility between these two states results in 共a兲 tensile transverse and longitudinal stresses in weld zone and 共b兲 compressive through-thickness residual stresses in the weld zone. Qualitatively, the preceding description is consistent with results shown in Figs. 7–10. However, details in the residual stress field 共e.g., larger ZZ compressive stresses in the shoulder region兲 will require additional information, ideally from threedimensional model results. It is worth noting that the authors have obtain experimental evidence which indirectly supports the trends in Z noted in this work. Recently, the authors performed low K max fatigue tests with an initially planar, through-thickness flaw located in a vertical transverse cross-section, where the planar crack propagated along the centerline of the FSW. By increasing K max , the authors were able to induce slant fatigue crack growth. However, immediately after slant crack growth occurred, crack surface interference was observed. This trend is consistent with the presence of compres220 Õ Vol. 124, APRIL 2002
sive residual stress Z ; when released, the resulting increase in specimen dimension induces crack face contact during the unloading phase of the fatigue process.
Conclusions Measurements of both the FSW microstructure and the threedimensional residual stress field in an aluminum 2024-T3 arcan specimen, butt-welded by the friction stir weld technique were performed. The stresses LL and TT , and ZZ obtained using neutron diffraction show that 共a兲 the longitudinal stress was the largest tensile component, with a maximum value of 105 MPa, with the highest stresses occurring near the crown side of the specimen over the entire FSW region, 共b兲 the transverse stress is approximately 70 percent of the longitudinal stress, with the largest stresses occurring at mid-thickness, 共c兲 ZZ is the largest compressive component with a maximum of ⫺40 MPa兲 located near the root side (Z⫽⫺2.7 mm) and approximately 12 mm from weld centerline, with a rapid transition to tensile stresses outside the shoulder diameter and 共d兲 post-weld machining resulted in a substantial reduction in residual stresses for the transverse crosssection which was close to the free boundary. Furthermore, trends in each of the residual stress can be predicted qualitatively based on recent modeling efforts which indicate that the joining process involves the solid state, rotational extrusion and consolidation of material due to the motion of the FSW tool.
Acknowledgments Research sponsored by the Assistant Secretary for Energy Efficiency and Renewable Energy, Office of Transportation Technologies, as part of the High Temperature Materials Laboratory User Program, Oak Ridge National Laboratory, managed by UTBattelle, LLC, for the U.S. Dept. of Energy under contract DETransactions of the ASME
AC05-00OR22725. DQW was supported in part by an appointment to the Oak Ridge National Laboratory Postdoctoral Research Associates Program administrated jointly by the Oak Ridge National Laboratory and the Oak Ridge Institute for Science and Education. In addition, the support of NASA Headquarters through grant NCC5-174 and AFRL contract #TMC-96-58350097-01 are gratefully acknowledged.
References 关1兴 James, M., Mahoney, M., and Waldron, D., 1999, ‘‘Residual Stress Measurements in Friction Stir Welded Aluminum Alloys,’’ Proceedings of the 1st International Symposium on Friction Stir Welding, June, Thousand Oaks, CA. 关2兴 Sutton, M. A., Yang, B., Reynolds, A. P., and Taylor, R., 2000, ‘‘Preliminary Studies of Mixed Mode Fracture in 2024-T3 Friction Stir Welds,’’ Best of Aeromat Session, ASM Materials Solutions Conference and Exhibition, St. Louis, MO, October 9–12. 关3兴 Jata, K. V., and Semiatin, S. L., 2000, ‘‘Continuous Dynamic Recrystallization
Journal of Engineering Materials and Technology
关4兴 关5兴 关6兴 关7兴
关8兴 关9兴
During Friction Stir Welding of High Strength Aluminum Alloys,’’ Scr. Mater., 43, pp. 743–749. Rhodes, C. G., Mahoney, M. W., Bingel, W. H., Spurling, R. A., and Bampton, C. C., 1997, ‘‘Effects of Friction Stir Welding on Microstructure of 7075 Aluminum,’’ Scr. Mater., 36, No. 1, pp. 69–75. Murr, L. E., Liu, G., and McClure, J. C., 1997, ‘‘Dynamic Recrystallization in Friction-Stir Welding of Aluminum Alloy 1100,’’ J. Mater. Sci. Lett., No. 16, pp. 1801–1803. Wang, D.-Q., Hubbard, C. R., and Spooner, S., ‘‘Residual Stress Determination for a Ferritic Steel Weld Plate,’’ ORNL, TM1999/141. Sutton, M. A., Abdelmajid, I., Zhao, W., Wang, D.-Q., and Hubbard, C. R., Basic Studies of Welds in a Tank Car Steel: Residual Stress Measurements and Weld Characterization for TC-128B Plate Steel,’’ accepted to be published in Transaction of Transportation Research Board. Xu, S., Deng, X., Reynolds, A. P., and Seidel, T. U., ‘‘Finite Element Simulation of Material Flow in Friction Stir Welding,’’ Sci. Technol. Weld. Joining 共in press兲. Nunes, A. C., Jr., Bernstein, E. L., and McClure, J. C., ‘‘A Rotating Plug Model for Friction Stir Welding,’’ submitted to the Welding Journal Research Supplement 共in review兲.
APRIL 2002, Vol. 124 Õ 221