A Study on the Detection of Fault Frequencies for Condition Monitoring of Induction Machines I. Ahmed*, N. Ertugrul and W.L. Soong School of Electrical and Electronics Engineering University of Adelaide, Australia, 5000 Tel: + 618 8303 3160, Fax: + 618 8303 4360 *
[email protected]
Abstract This paper describes a study aimed to improve the detection of faults in induction motors. Two hidden faults (misalignment and soft footing) and the broken rotor bar fault are investigated by analysing a number of noninvasive sensor quantities: voltage, current, vibration and axial flux. The measurements were performed under different loading conditions to determine the effects of loading on the characteristic fault frequencies. The actual motor speed has also been measured in real time to be able to determine the fault frequencies accurately, since the fault frequencies depend on the slip frequency and hence operating speed. The measured sensor parameters were analysed under steady-state operation using the frequency spectrum technique, and a number of results were provided to investigate the relationships between the healthy motor and the motor with multiple faults considering the characteristic fault frequencies. Keywords Condition monitoring, misalignments, broken rotor bars, softfoot.
1. Introduction As reported in the literature, 10% of the induction motor (>100hp) failures are due to rotor faults, 40% of the faults are due to stator faults, 40% of the faults are bearing related. Due to the nature of the possible faults and their dependence on the motor loading it is important to consider multiple fault detection approaches [1 – 5]. The most common methods for the detection of different faults in induction motors involve the measurement of vibration, current, voltage, and axial leakage flux, which are all non-invasive techniques. It is well understood that the faults in induction motors produce characteristic fault frequencies that can be observed using spectrum analysis of one or more sensor quantities mentioned above. For example, the broken rotor bar sidebands magnitudes can be observed at frequencies of (1±2s) f1, the shorted turn(s) fault(s) can be monitored at the frequencies of f1 ((n/p) (1-s) ± k) and the rotor eccentricity can be inspected at the frequencies given by f1± fr. In these expressions, f1 is the supply frequency, fr is the rotor frequency (fr = Nr /60), R is the number of rotor bars, s is the slip, p is the number of pole pairs of motor, and n and k are integers. However, the primary challenge is that the fault frequencies exist
in the healthy machines as well, and they are heavily influenced by both the loading and the size of the motor. This makes it very difficult to determine whether the measured characteristic fault frequencies correspond to a fault or not [1 - 3]. Therefore, it is important to study the above mentioned issues, firstly by accurate measurement of the operating speed of the motor (which also indicates the degree of loading) to calculate the fault frequencies, and then use these values as a reference to search for the frequency spectrum of a given sensor signal. This paper aims to improve the detection of faults in induction motors by analysing a number of non-invasive sensor signals under a healthy state of the motor, and the motor with two hidden faults (misalignment and soft footing) and the motor with broken rotor bar fault. In the following sections of the paper the hardware description including the sensors and data acquisition system to acquire the signals is given. In addition, the analysis of each signal is provided that includes the healthy as well as faulty states.
2. Condition Monitoring Hardware and Introduction of Faults The tests performed in this study were obtained using a test rig (Figure 1a) based on a high-speed data acquisition system (2 x DAQPAD-6052E boards from National Instruments, capable of simultaneous sampling at 5MHz) and custom-written LabView software (Figure 1b). To introduce the faults, identical 2.2kW, 415V, 4.8 Ampere, 4 pole induction motors were used. A separately excited 5kW DC generator loaded the motors.
a b Figure 1: Photographs of the motor test setup (a), the data acquisition hardware (b). As the observability of the slip frequency significantly depends upon the level of loading of the motor, an accurate measurement of the rotor speed is critical. Therefore, the speed of the motor is measured by a DC tachometer that is directly attached to the motor shaft.
Due to the finite value of the accuracy of the laser alignment tool, the correctness of the alignment is defined based on the acceptable range of alignment values that is given for specific motor speeds and provided by the manufacturer of the laser alignment tool. Table 1 shows a set of results that compares the acceptable values and the values obtained for a motor under test. The table demonstrates that since the measured values are equal or below the acceptable ranges in vertical and horizontal directions, the setup is considered properly aligned. Table 1: Comparison of the acceptable values for the alignment and the values obtained for a given motor speed. Alignment Vertical offset Vertical gap Horizontal offset Horizontal gap
Acceptable ranges (mm) 0.09 0.07 0.02 0.07
Measured values (mm) 0.09 0.05 0.02 0.07
Furthermore, it is important to achieve correct mounting for the motor using a torque wrench. One of the hidden faults that may be present in induction motors is the soft foot. The soft foot in the motor may distort its case, which may cause air-gap eccentricity, and may result in noise and vibration. The soft foot is introduced by loosening one or more of the feets of the motor, which results in excessive level of vibration that can be observed primarily using the vibration sensor signals. As stated earlier, the fault frequencies are given in terms of the supply frequency and the slip. Therefore, an accurate value of the slip is paramount to be able to determine the points of interest on the frequency spectrum. In this paper, the measured rotor speed, N r is used to calculate the slip, s, which is then used to find out a reference slip frequency, f2. Slip, s = (Ns – Nr) / Ns f2 = s (f1)
(1) (2)
0
Amplitude (dBs)
The motors were installed on the test rig by using an advanced laser alignment tool (Optalign Plus from Pr•ftechnik) and a torque wrench (Norbar set at 35Nm for ideal mounting). These two tools were used to ensure the accuracy and the repeatability of the mounting as well as to introduce misalignment and soft-foot. All the sensor outputs were sampled simultaneously via an antialiasing filter, which was an 8th order Butterworth filter, with a cut-off frequency of 2 kHz.
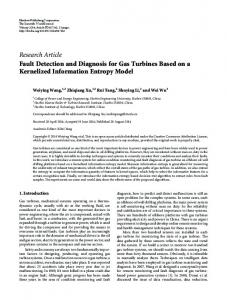
The supply frequency f1 can be determined using FFT of the current, the voltage or the flux signal. FFT of a current waveform is given in Figure 2.
- 20 f 1 = 50 Hz
-40 -60 -80
-100
47
48
49
50
51
52
53
Frequency (Hz)
Figure 2: Measured spectrum of motor current showing the supply frequency component
3. Analysis of a Healthy Motor As stated previously, the fault frequencies do exist in healthy motors as well. Therefore the main task in this section is to investigate the fault frequencies in healthy machines using a set measured sensor signals, which can be used a reference to study the effect of the multiple faults on the characteristic fault frequencies. In addition, a specific attention is given to measure the slip (and the rotor speed) accurately, which is utilised to identify the fault frequencies. Figure 3 illustrates the frequency spectrum of the flux signal around the slip frequency range. As can be seen in the figure, for the loading condition given, the slip frequency can be identified clearly, as 2.75Hz, which indicates a magnitude of around -30dB.
Figure 3: Frequency spectrum of flux signal around the slip frequency range at full-load For the motor given, the average power is calculated as 2637.74W that utilised the instantaneous power. Fig. 4 provides a graph that demonstrates the effect of loading on the magnitude of slip frequency. As seen in this figure, the degree of loading significantly affects the value of slip frequency magnitude. 0
Amplitude in dB
In addition, two line currents, two line voltages and the axial leakage flux of the motor are measured. Furthermore, two vibration measurements were performed one of the driving end horizontal end and one on the non-driving end vertical.
-20 -40 -60 -80 9
53
100
140
Percentage of Load
Where Ns is the synchronous speed of the motor under test.
Figure 4: The effect of loading on the slip frequency of healthy motor
Fig. 5 illustrates the frequency spectrum of current and flux signals at full load of the healthy motor under test. As highlighted in the figure, the sidebands [(1±2s) f1] around the supply frequency f1 are used to detect the Broken Rotor Bar (BRB) faults. The severity of the BRB fault can be determined using the magnitudes of the sidebands. The sidebands are found to be 44.20Hz (61.70dB) and 55.51Hz (-70.93dB) for the current spectrum, and -44.20Hz (-52.56dB) and 55.51Hz (53.01dB) for the flux spectrum. These results indicate that the current spectrum is more sensitive to the BRB faults.
Figure 5: Frequency spectrum of current and flux signals illustrating the fault frequencies (also known as side bands) that are used to detect the Broken Rotor Bar (BRB) fault. Similarly, current and flux spectrums can be used to identify Shorted Turn (ST) fault frequencies, which was described in the introduction section. Fig. 6 demonstrates the location of the ST fault frequency for n=1. As can be seen, a ST frequency can be observed for the current signal at 73.63Hz (-69.07dB) and for the flux signal it is at 73.63Hz (-24.74dB). The eccentricity related fault frequencies were given previously, [f1 ± fr]. Fig.7 provides the results of the analysis of the current and flux signal, which are 26.38Hz (-62.01dB) and 26.38Hz (-27.00dB) respectively.
It can be concluded from the analysis of the results obtained from healthy motor that, the fault frequencies exist in healthy machines as well. Moreover, the degree of loading significantly affects the value of slip frequency. In addition, both current and flux measurements can be utilised to observe faults. Although the analysis of the frequency of the current signal is more effective in the detection of BRB faults, the flux signal analysis is effective in ST and eccentricity related faults.
Figure 7: Frequency spectrum of current and flux signals illustrating the fault frequencies that are related to eccentricity.
4. Analysis of a Faulty Motor As stated previously, the principal aim in this study is to determine the effect of the single and multiple faults on the characteristic fault frequencies that may not be directly related to the frequency under consideration. In this section of the paper, the motor under test with two combination faults and a single fault are considered, which include the motor with misalignment and soft foot; the motor with misalignment, soft foot and with two broken rotor bars, and the motor with 2BRB fault only. Fault 1 (misalignment and soft foot)
Figure 6: Frequency spectrum of current and flux signals highlighting the locations of the fault frequencies that can use to detect the ST faults.
In this mode of operation, the slip frequency at full load was found to be 2.74 Hz (-15.64)dB as expected in the rated loaded machine. The average power of 2637.74 Watt (at a lagging power factor of 0.80) was also calculated using the instantaneous power. As can be seen in Figure 8, the magnitude of the slip frequency was measured higher in this mode of operation than the case in Fig.3.
Figure 8: Frequency spectrum of the leakage flux signal around the range of slip frequency. The frequency spectrums of the flux and current signals of the motor under test with misalignment and soft foot under full load operation are shown in Figure 9. The measured sideband frequencies in the current spectrum are 44.03Hz and 55.48HzHz, and the corresponding magnitudes are -76.56dB and – 70.81dB.
Figure 10: Frequency spectrum of current and flux signals under Fault 1, which highlights the shorted turn fault frequencies.
The sideband frequencies and their magnitudes for the flux signal are also determined as 44.03Hz (-39.93dB) and 55.48Hz (-45.06dB). It was observed from these tests that the magnitude of the sideband frequencies in flux spectrum increased significantly under this combination fault, while the current spectrum has an opposite trend.
Figure 11: Frequency spectrums of the current and the flux signals in Fault 1 illustrating the fault frequencies that are related to eccentricity Fault 2 (two broken rotor bars) In this case, the motors under test with two broken rotor bars are considered. Fig. 12 shows the frequency spectrum of the flux signal to determine the slip frequency. Figure 9: Frequency spectrum of the current and flux signal under Fault 1.
As indicated before, the speed of the motor was also measured to verify the slip frequency. As indicated in the figure, the slip frequency is 2.95Hz (-39.62dB) in this test.
In Figure 10, the shorted turn fault frequencies are given for n=1. The measured values for the current and the flux signals are 73.63Hz (-75.01dB) and 73.63Hz (-20.12dB) respectively. As observed in this test, the flux signal demonstrates a visible increase under Fault 1. In addition, eccentricity related characteristic fault frequencies for the current and flux signals were investigated and determined (Figure 11) as 26.37Hz (84.96dB) and 26.37Hz (-30.95dB) respectively. Again, in Fault 1, the flux measurement demonstrates a measurable change at the subject characteristic fault frequency, while the current spectrum is indeterminate.
Figure.12: Frequency spectrum of the flux signal under Fault 2 The frequency spectrum of the flux and the current signal of the test motor under full load and Fault 2 are shown in Figure 13. As shown, the broken rotor bar
sidebands components from the current signal are 44.10Hz (-56.53dB) and 55.89Hz (-67.52dB), and for the flux signal they are 44.10Hz (-50.74dB) and 55.89Hz (-54.76dB).
Figure 13: Flux and current spectrum under Fault 2
Fault 3 (misalignment, soft foot and 2BRB) In this test, three types of faults were introduced to the motor under test and corresponding characteristic fault frequencies were investigated both in flux and current signals. Figure 14 illustrates the frequency spectrum of the flux signal where the slip frequency is measured as 3.26Hz (– 44.41dB).
Figure 14: Slip frequency under Fault 3 Under Fault 3, the values of the sideband frequency components were also identified using the current and flux spectrums (Figure 15), as for the current signal 43.46Hz (-60.10dB) and 56.51Hz (-71.25dB), and for the flux signal 43.46Hz (-50.56dB) and 56.54Hz (50.68dB).
5. Comparison of Experimental Results The results obtained in the previous sections were summarised in Table 2. Table 2: Summary of the characteristic fault frequencies under various fault conditions Motor Slip Magnitude Magnitude of Status frequency of the BRB the BRB and sidebands sidebands in magnitude in current flux signal signal (dB) (dB) 2.75Hz -61.70 Healthy -52.56 -28.18dB -70.93 motor -53.01 2.74Hz -76.56 -39.93 Fault 1 -15.64dB -70.81 -45.06 2.95Hz -56.53 Fault 2 -50.74 - 39.62dB -67.52 -54.76 3.26Hz -60.10 Fault 3 -50.56 - 44.41dB -71.25 -50.68 As indicated previously, all the results given in this paper obtained under full load operating condition of the test motor. In addition, due to the direct measurement of the rotor speed, the measured slip frequency is considered accurate, which was used to determine the characteristic fault frequencies. It can be concluded that, the faults due to misalignment, soft foot and broken rotor bars increase the slip frequency significantly. Moreover, there is a significant increase in the magnitude of the slip frequency when the test motor has a combination fault of misalignment and soft foot (Fault 1). Although the broken rotor bar faults are easy to detect using the analysis of the current signal (based on the sidebands), no clear conclusion is drawn in the case of the combination faults (Fault 1 and Fault 3). In the analysis of the flux signals however, the sideband frequencies are not detectable except for Fault 1 (misalignment + soft foot).
6. Conclusions The paper presented a comprehensive test results based on a hardware developed to obtain non-invasive signals from a set of sensors in induction motors. The principal aim of this study was to determine the effects of single and multiple faults on the characteristic fault frequencies that may not be directly related to the specific frequency under consideration. Therefore the speed of the motor was measured directly to determine the slip frequency and the characteristic fault frequencies that also exist in healthy motors. The slip frequency was verified by using the flux spectrum.
Figure 15: Flux and current spectrum under Fault 3
As reported above, the slip frequency increases with the faults. In addition, the broken rotor bar faults are easy to detect using the analysis of the current signal. However, no conclusion is drawn in the case of the combination faults that may include broken rotor bar fault. Furthermore it was found that the analysis of the flux
signals did not produce a visible change in the frequency spectrum for the given faults. The future study in this research will extend the experimental work to cover all possible single and combination faults and will investigate their effects on the characteristic fault frequencies.
References [1] Ahmed, I., Supangat, R., Grieger, J., Ertugrul, N., and Soong, W. L. "A Baseline Study for On-Line Condition Monitoring of Induction Machines." Australian Universities Power Engineering Conference, Brisbane, Australia 2004 [2] Siau, J., Graff, A., Soong, W. L., and Ertugrul, N. "Broken Bar Detection in Induction Motors Using Current and Flux Spectral Analysis." Australian Universities Power Engineering Conference, Christchurch, New Zealand 2003
[3] Sin, M., Soong, W. L., and Ertugrul, N. "Induction Machine On-Line Condition monitoring and Fault diagnosis- A Survey." AUPEC2003, Christchurch, New Zealand [4] Williamson, S., And Smith, A.C. “Steady State Analysis of 3 - Phase Cage Motor with rotor bar and End Ring Faults. IEEE Proc., vol. 129, pt. B, no. 3, May 1982, pp.93 – 100
[5] Benbouzid, M. E. H. (2000) ‘A Review of Induction Motors Signature Analysis as a Medium for Faults Detection’, IEEE Transaction on Energy Electronics, vol. 47, no 5, Oct., pp984-993