A Survey on Goal-Oriented Visualization of Clone Data Hamid Abdul Basit
Muhammad Hammad
Rainer Koschke
SBA School of Science and Engineering Lahore University of Management Sciences Pakistan
[email protected]
Punjab Information Technology Board (PITB) Pakistan
[email protected]
Dpt. of Mathematics and Informatics University of Bremen Germany
[email protected]
alizations for a particular user goal. We can identify redundant and complementary types of visualizations, and information needs currently not well addressed by visualizations. The framework can help researchers to assess clone visualizations with respect to concrete information needs and goals, and to identify the necessity to devise new kinds of visualizations for goals and needs currently not well addressed. This paper extends our previous work [2] by surveying and relating existing clone visualization to user goals and information needs. The rest of the paper is organized as follows. The next section describes how we identified the user goals and derived their information needs. Section II-A lists those user goals and their associated information needs. A survey of existing visualization for clone data is given in Section III. Section IV, finally, concludes.
Abstract—Comprehending software clones is necessary for a number of activities in software development. The comprehension of software clones is challenged by the sheer volume of data and the complexity of the information content in that data. Visualization, or visual data analysis, takes advantage of human cognitive skills to discover unstructured insights from the visual presentations of complex and voluminous data. In this paper, we survey the existing literature on visualization of software clones. We gather the insights provided, and put that information in context of actual information needs systematically derived from the clone management goals. This framework allows us to better understand the role a visualization may play in achieving a specific user goal, identify potential gaps between existing types of visualization and information needs, and find complementary non-redundant subsets of visualizations for each user goal.
I. I NTRODUCTION The sheer amount of data produced by clone detectors for large systems, and the inherently rich and complex strucure of this data, makes it difficult for a human analyst to fully understand it. Various aspects of a clone may play a role for a particular task at hand: its type, degree of similarity, location, dispersion, size, impact, evolution, and more. We cannot concisely compute answers to frequently asked questions about clones, like which clone should I refactor? A human analyst must comprehend and weigh the different aspects of a clone to make an informed decision. Visual data analysis is an approach to make sense of complex and voluminous data. Various types of visualizations have been proposed in the literature to show clones data. In this paper, we summarize these attempts, and put them in a framework of user goals and their associated information needs. A user goal is the reason for detecting clones. For instance, a defect was corrected by a programmer who then wants to check whether this defect is fixed completely. To reach a goal, several information needs exist. For instance, is this defect embedded in code that has been copied elsewhere? If so, where was it copied? What is the relation of those copies and their contexts? Will the same patch work in those contexts too? This framework relates user goals, information needs, and types of visualizations addressing those needs. We thereby follow the suggestion by Maletic et al. to categorize different types of visualization also by the task they are to support [1]. This survey allows us to identify the appropriate types of visu-
c 2015 IEEE 978-1-4673-7526-9/15/$31.00
II. U SER G OALS AND I NFORMATION N EEDS We conducted a survey of user goals considering 84 papers on uses of clone detection. We started from the list of papers on clones gathered by Tairas1 . We extended this list by looking into their references and searched the Internet with keywords like clones, duplicated code, etc. We also looked at major surveys [3]–[6], the proceedings of the Dagstuhl seminar “Software Clone Management Towards Industrial Application” [7], and the references therein. 50 of the initial 84 papers provided use cases and/or information needs. Our previous publication lists all the identified papers [2]. We collected the user goals described in those papers and grouped them into categories. The use cases were partly described in these papers. We jointly discussed and assigned a common label for those use cases. Similar groups were then grouped into higher-level groups to form a two-level taxonomy. We then identified the information needs for these user goals. If the papers did not explicitly state it, the needs were at least implied by the kind of information the tool or method described in the paper attempts to derive. Beyond that, we brainstormed additional information needs for the user goals not originally described in those papers but needed to fully address the user goal. The brainstorming was 1 http://students.cis.uab.edu/tairasr/clones/literature/
46
VISSOFT 2015, Bremen, Germany
TABLE I M APPING U SER G OALS TO I NFORMATION N EEDS ( THE UNIQUE IDENTIFIERS OF THE FORM Ni REFER TO THE INFORMATION NEEDS OF LISTED IN TABLE II) Comprehension N1, N1a, N1b, N2, N3, N4, N4a, N4b, N6, N6a, N6b, N7, N8, N8a, Program Comprehension (PC) N10, N11, N11a, N15, N16, N17, N19, N20 Design Recovery (DR) N16 Domain Analysis (DA) N10, N11, N11a Defect Management Bug Detection (BD) N8, N8a, N15, N22 N1, N1a, N1b, N6a, N10, N18a, Finding Duplicated Bugs (DB) N18b Quality Assessment and Improvement N1, N1a, N1b, N2N3, N4, N4a, Quality Assessment (QA) N4b, N6, N9, N21, N24, N23 N20, N23, N23a, N23b, N23c, Quality Improvement (QI) N24 Productivity Measurement (PM) N5 N23, N23a, N23b, N23cN27, Refactoring (Rf) N28, N29 N1, N1a, N6a, N8, N8a, N8b, Code Compaction (CoC) N8c, N23, N23b, N23c Merging (Mg) N10, N11, N11a, N11b, N11c
Knowing clones during Program Comprehension is helpful to avoid redundant reading of code, and to transfer knowledge from one piece of code to its clones. By finding repeated patterns of clones, we can identify design-level similarities during Design Recovery. Clones that occur across systems indicate commonalities of the systems in the domain, and are helpful in Domain Analysis [10]. Bug Detection refers to detecting errors when cloning code (e.g., inconsistent changes). Finding Duplicated Bugs is required when code was duplicated that contains a defect. Quality Assessment in the context of clones is to get an estimate on how the existing clones affect the overall system quality, and to find hot spots, i.e., parts of a system that contain a larger amount of clones. Quality Improvement encompasses the persistence and removal of clones. By persistence, we mean the documentation and annotation of clones (e.g., whether a clone is considered harmful). Refactoring aims at improving code quality by removing clones. Code Compaction can be viewed as a particular type of refactoring with the goal of reducing the number of code elements to optimize the cost and time for the compilation, running, and storage of a program. Clone detection can help to establish the relationship between pairs of similar units to be merged (Merging). The goal of clone detection in the context of Productivity Measurement is to measure the degree of redundancy in order to have unbiased information for making management decisions derived from program size. Code clones are similar program parts and are naturally suited for becoming reusable components. Sometimes it is the entire system that is cloned serveral times, which calls for migration to a product line (Migrating to Product Lines). Sometimes, a clone is present across a wide range of systems and should be put into a library (Library Candidate Detection). Sometimes, the clone is representing a cross-cutting concern and can be reused as an aspect (Aspect Mining). Origin analysis creates a mapping between historic ancestors and descendants of entities in source code [11]. If the mapping is between versions, it is called Evolutionary Mapping, used in clone-evolution studies as well as in carrying over any information from ancestors to their descendants (e.g., in software quality dashboards). Clone Evolution Analysis uses evolutionary mappings to study how clones change from one version to the next. It can be used to discover the patterns and characteristics displayed by clones during their evolution within a system [12]. Provenance Analysis generally refers not only to the record of origin but also to the ownership of an artifact. If the provenance turns out to be a program with a license incompatible to the context where the copy resides, a potential Copyright Infringement is found. Code Leakage describes the situation where code that should be kept private is copied to a forbidden place. It is a special case of origin analysis where the focus is on the offspring rather than the origin. Inferring File Structure Modifications is required to reestablish a lost change history when it was not preserved in a version control system [13]. Nearest-neighbor clone detection can be used for that.
Re-Use N1, N1a, N1b, N3, N4, N4a, N4b, N6, N6a, N6b, N8, N8a, N10, Migrating to Product Lines (PL) N11, N11a, N12, N13, N14N15, N16, N19, N20, N23, N23b, N23c Library Candidate Detection (LC) N2N6, N7, N9 Aspect Mining (AM) N1, N1a, N1b, N6a, N7, N21 Origin Analysis Evolutionary Mapping (EM) N10, N18, N18b Provenance Analysis (PA) N25 Plagiarism and Copyright N10a, N26 Infringement (PCI) Identifying Code Leakage (CL) N10b Clone Evolution Analysis (CE) N18a, N18b, N18c, N18d, N18e Inferring File Structure N11, N11a Modifications (FSM) Clone Management Assessment and Ranking (AR) N21 Clone Awareness (CA) N6a N1, N1a, N1bN15, N16, N18c, Clone Compensation (CC) N19 Clone Prevention (CP) N20 Malicious Software (MS) N8, N8a, N10
first done individually by the authors of this paper and then jointly continued in the group as a whole to reach a consensus. We do not claim that our list is comprehensive, but it is a good starting point. We invite other researchers to extend this list. The user goals and their mapping onto information needs are described in more detail in our previous paper [2]. We will start with a brief description of the user goals and then continue with the information needs. A. User Goals From the literature, we have identified 25 user goals (Table I) classified into seven groups. We omit two miscellaneous user goals, namely, ontology alignment [8] and web-service similarity detection [9], which use clone detection as an enabling technology. The second column of Table I contains the information needs listed in Table II.
47
Clone Assessment and Ranking assesses and ranks clones with respect to the task at hand. Clone Awareness means to know where the clones of a piece of code to be changed are located so that changes can be applied consistently. The purpose of Clone Compensation is to limit the harmful effect of existing clones that are to be left in the system. For Clone Prevention, code needs to be continuously analyzed to identify the root causes for cloning so that they can be rectified. Matching and relating malware by their common parts through clone detection is helpful for Malicious Software Detection [14]. Similarly, self-mutating malware—a particular form of code obfuscation—can also be identified with clone detection [15].
scales (pc, bc, bm, lc, pcv; note: the abbreviations used here refer to the types of visualization that follow in this section), time series (cev), sequential orders (ebc, civ) and relational data. Relational data can be further distinguished into bipartite data (dp, ccfe), trees (tm, ntv, hdg, csht, cseg, eb, smv), directed acyclic graphs (hd), and arbitrary graphs (wv, cccg, db, dwv, cs, rsp). We will describe the existing types of visualizations along these structures. A. Pie Chart (pc), Bar Chart (bc), and Line Chart (lc) In clone visualization, pie charts are used to represent the proportion of cloned code in relation to the whole file or directory, or the proportion of cloning contained in a directory in relation to the overall cloning present in the system [17] (N4, N8, N8c, N9, N11, N11c). Bar charts are used to compare clones and clone classes according to the selected metrics [17] [16] (N8, N8c, N9). The line chart displays the relationship between two variables, plotted along x and y axes of a grid, as a series of data points connected by straight line segments. It is commonly used to see a trend in data over intervals of time. In clone visualization, it is used to plot various metrics of clone evolution (N18, N18c, N18d, N18e) [18].
B. Information Needs Table II at the end of this paper summarizes the information needs. The last column describes for which user goal the information need arises, using the abbreviations introduced in Table I. More details and the reasoning for this mapping can be found in our previous paper [2]. The groupings of information needs represent different perspectives of coherent needs. Perspective Clone summarizes characteristics of clones themselves, Containing Unit describes aspects of the unit containing the clone, Context relates clones to other elements (embedding code, other clones, artifacts other than code), Evolution gives aspects of the evolution of clones, Conceptual deals with the meaning of the clone, Impact addresses the effects of a clone, and Refactoring summarizes aspects related to removing clones.
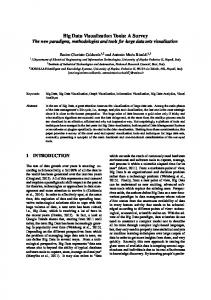
B. Bar Map (bm) Bar map is a visual component of code inspection view that presents the relative positions and sizes of certain important code sections with bars. It can also be used to establish the connection between two code inspection views. For clone visualization, bar maps mark cloned code fragments, either within a source file or between multiple files (N1, N3, N10). It is also used to indicate the range of presented text (N14)(Figure 1).
III. V ISUALIZATIONS AND P ROVIDED I NFORMATION In this section, we discuss various types of existing clone visualizations and the information that each of these visualizations provide. It covers clone visualizations from 1991 until today. We assess them on the kind of information they provide in their pure form. It goes without saying that many of them can be extended to show extra information. For instance, a straightforward extension of tree maps may let a user select elements interactively to see other elements sharing clones with the selection using edges and color highlighting. Similarly, tool tips can be added to visualized elements to give more detailed information on clones, such as metrics on the size, which the visualization alone is not able to convey by its inherent means. We do not consider purely textual representations as visualization, except when enriched by additional visual attributes such as colors. By the same token, we do not consider tables of texts such as tabular forms as visualization. They are popular and useful means to present, for instance, metrics, and allow one to filter and sort data quickly [16]. Yet, they are just a flexible organization of textual data. They offer very little abstraction for large amounts of data and do not support “visual analytics” well. Types of visualizations can be distinguished by the inherent structure of the data they visualize. The clone-information structures we found in the existing literature are quantitative
Fig. 1. Multicolor bar map from Atomiq2
C. Parallel Coordinate View (pcv) It is used to analyze high-dimensional data. The ndimensional space is represented by n parallel and equally spaced vertical lines. A data point is represented by a polyline with vertices on the parallel axes, such that the position of the vertex on the i-th axis corresponds to the i-th coordinate of the point. A parallel coordinate view in Gemini [19] presents various clone class metrics (N2, N3, N23, N23b, N6, N9) , with metrics as axes and clone classes as data points 2 http://getatomiq.com/
48
(Figure 2). It can also be used to compare program units based on different metrics (N4, N14).
F. Code Inspection View (civ) Similar to the visual dif f tools, these views highlight similarities and differences in the source code of two or more files (Figure 4)(N7, N8, N8a, N3). All instances of a clone class may be shown in a single window in an overlaid fashion [23], [24]. They can also be used to compare the same logical fragment across multiple versions (N18, N18a, N18c).
Fig. 2. Clone Class Metric Graph from CCFinder/Gemini3
D. Clone Evolution View (cev) Drawing from the idea of software evolution visualization [20], it shows clone classes for each version of the software and links the clones across versions through edges to show their evolution as clone genealogies. A user can examine the appearance of new clone instances (N18, N18a, N18d) and the modifications in existing ones (N18c). In SoftGUESS clone genealogy browser, nodes indicating clone instances are placed from left to right by version, and clone instances belonging to the same class are placed next to each other vertically (N2, N18a, N18d). Cyclone [18] shows the timeline from top to bottom (Figure 3) and combines all instances of a clone class in a rectangle. Color highlighting is used to show the end of lifetime of a clone class and inconsistent changes (N18c).
Fig. 4. CCFinder/Gemini5 code inspection view
G. Dot Plot (dp) Clone dotplots [24]–[27] show cloning as a matrix, where rows and columns are the entities (lines, files, directories, etc.), while a dot indicates cloning between the corresponding entities. The rows may present entities different from those in the columns (N10). Line-level dotplots show the locations of the clones (N1), size of a clone (N3), differences in abstract form (N8, as gaps or offsets), the number of instances of a clone class (N2), and a visual impression of the degree of redundancy (N4, N5, N6).
Fig. 5. Dotplot of string matching
H. Relative Similarity Plot (rsp)
Fig. 3. Clone evolution view of Cyclone4
Within a clone class, some clone instances could be more similar than others. The relative similarity plot view in VisCad [17](Figure 6) graphically depicts the similarity of clone instances relative to a given instance called the leading node (N8, N8b, N8c). The leading node is drawn at one end of the plot, while other nodes are drawn at a vertical distance from the leading node computed by the selected distance metrics. This view can also be used for similarity visualization of other code elements (N11, N11b, N11c).
E. Enhanced Bar Chart (ebc) Based on the Seesoft visualization [21], it shows files as vertical bars and code lines as thin horizontal colored stripes within bars [16], [22]. For clone visualization, stripes with the same color are clones of each other (N14, N1, N2, N3, N4, N5, N6, N12, N13). To analyze multiple systems or multiple versions, bar charts of the corresponding files can be placed next to each other (N10, N12, N13, N14, N18, N18a, N18b, N18d, N18e).
5 http://www.ccfinder.net/doc/10.2/en/tutorial-gemx.html 6 http://www.cs.usask.ca/∼croy/viscad
3 http://sel.ist.osaka-u.ac.jp/cdtools/old-gemini-e.html 4 http://softwareclones.org/cyclone.php
49
files/lessons/Textual filtering.html
Fig. 6. Similarity plot view in VisCad6 [17]
Fig. 8. Tree map view in ConQAT [31]
I. Clone Class Family Enumeration (ccfe)
K. Navigation Tree View (ntv)
This is part of Rieger’s polymetric views [26], [28]. A clone class family is the group of all clone classes that have instances in the same set of source files. Smaller nodes represent clone class families, whereas larger nodes represent source files. Horizontal placement of clone class families and source files is dependent upon the Lines of Copied Code (LCC) and the Lines Of Code (LOC) metrics (N1, N10) respectively (Figure 7). Clone class families in the top rows link to only a few source files, while the families located at the middle of the view have more contributing source files. Similarly, source files at the bottom of the view are only involved in a single clone class family, whereas files in the middle of the view have more clones (N2).
This is commonly used to present hierarchical data items, where each item can have a number of sub-items. An item can be expanded or collapsed to show or hide sub-items. For clone visualization, navigation tree views are used to present a hierarchical view of various clone-related elements e.g., clone instances, clone classes (N1), source files/classes with clones, and directories or packages where these files/classes are located (N6, N6a, N6b) (Figure 9). Each element is represented with a tree node. Additional clone data can also be displayed as annotations on these nodes (N4, N14).
Fig. 9. Navigation tree view of Atomiq7
L. Hierarchical Dependency Graph (hdg) This view is present in VisCad (Figure 10) to show the distribution of clones across subsystems or directories (N1, N6b, N10) [17]. It represents the directory hierarchy of the system with directory and file nodes arranged along concentric circles such that the root directory is located in the middle and the containment relationship between directories and files is shown with directed edges. To simplify the visualization, a directory is selected as a target node (shown as a diamond shaped node) and all nodes that do not have any cloning relation with the selected directory are filtered (N6b). Node width and height indicate cohesion (clone rate within a node, N4a) and coupling of directories (rate of clone with external nodes, N4b), respectively, while node color indicates the external cloning rate with the target directory (N13). Edge width can also be used to indicate the number of clone classes or clone pairs shared by a pair of directories (N13).
Fig. 7. Clone class families of the system [28]
J. Tree Map (tm) Tree map [29], [30] shows hierarchical data (a tree) as nested rectangles. Each branch of the tree is captured by a rectangle which is further tiled with smaller rectangles to represent subbranches or leaves. The size and color of a rectangle are used to depict different characteristics of tree branches and leaves. For clone visualization, the tree map typically represents the directory or package hierarchy and files or classes as leaves. The size of a rectangle reflects the number of lines of code contained in that element (Figure 8). Color ranges are used to show the clone rate in a leaf (N4). Tree maps let us easily spot the location of clones in the hierarchy (N1) and their dispersion (N6). Extra edges or highlighting can indicate files that share clones (N2).
7 http://www.getatomiq.com/features
50
Fig. 12. Clone System Evolution (CSE) Graph [33] Fig. 10. VisCad Hierarchal Dependency Graph8
M. Clone System Hierarchical Tree (csht) This is part of Jiang’s visualization set [32], [33](Figure 11). The main goal is to show the spread of cloning in a system superimposed on the directory tree structure of the system with internal nodes representing directories and leaf nodes representing files (N1, N6, N4, N10). The width of the directory nodes shows the number of duplicated lines, whereas the height is proportional to the number of clone instances (N3). External cloning from a node is represented by the thickness of the edge coming out of that node (N4b).
Fig. 13. SoftGUESS Encapsulation Browser [34]
P. System Model View (smv) One of Rieger’s polymetric views [28], it shows the system directory structure by using a tree (N1a), where leaf nodes represent files and internal nodes represent directories (Figure 14). The height of the leaf node shows the external duplication of the file (N4b), while the width is proportional to its internal duplication (N4a). Edges between leaf nodes represent the amount of cloning between the two files (N12). It can also be used to present cloning in the inheritance hierarchy (N1b).
Fig. 11. CSH Tree of Linux Kernel [33]
N. Clone System Evolution Graph (cseg) Also from Jiang’s visualization set [33], it displays the evolution of clones over time (Figure 12). Like csht, the cloning information is shown in a directory tree. Colors are used to represent the amount of changes to the clones in a given subsystem (N18, N18a). Subsystems under the same parent directory are sorted on the basis of these colors (N18d).
Fig. 14. System model view [28]
Q. Hasse Diagram (hd)
O. Encapsulation Browser (eb)
It represents a partially ordered set in the form of a directed acyclic graph. Nodes related by the partial order are connected with directed edges. Johnson [35] uses a Hasse diagram to represent cloning between files, where the nodes represent files or common code between a set of files (N12) Figure 15. Larger files (N14) or larger cloned code fragments (N3) are placed towards the bottom, whereas smaller pieces of code are placed towards the top.
This visualization from SoftGUESS [34] presents a tree indicating the hierarchical containment of clone instances into methods, classes, and packages (N1, N2, N6, N6a, N6b, N10) (Figure 13). Colors are used to differentiate between different clone classes. 8 http://www.cs.usask.ca/∼croy/viscad files/lessons/Hierarchical Dependency Graph.html
51
Fig. 15. Hasse diagram [35]
R. Wheel View (wv)
Fig. 17. Clone Cohesion and Coupling Graph [32]
This view is based on the spline model to visualize hierarchical entities and their relationships [36], [37]. Entities represented as nested segments are placed in concentric rings and joined with bundled curves representing the associations. Outer rings represent higher-level entities. A wheel view for cloning represents the hierarchical structure of a system together with internal and external clones found in leaves (files or classes) (Figure 16; N1, N2, N3, N6) [38], [39]. The size of the segment is proportional to the amount of the cloned code in the entity (N4) and the thickness of the curve is proportional to the amount of cloning between the two connected entities. Evolutionary clone information can also be shown (N18, N18a, N18b, N18d, N18e, N10, N12, N13, N14).
(N1a) or calls to cloned methods (N16). Nodes are positioned in a force-directed layout. Nodes can be colored or sized based on different cloning properties (N8, N8c).
Fig. 18. Dependency Browser [34]
U. Duplication Web View (dwv) This Rieger’s polymetric view [26], [28] shows all files in the system as nodes arranged in a circle and connected with each other as edges based on shared clones (N12) (Figure 19). Node width represents internal duplication (N4a), while edge thickness represents the extent of cloning between the nodes. Fig. 16. SolidSDD Wheel view [39]
S. Clone Cohesion and Coupling Graph (cccg) Part of Jiang’s visualization set [32], [33](Figure 17), it shows cloning within the subsystems (cohesion) (N4a) and across subsystems (N12, N13) (coupling). Rectangles represent subsystems whereas diamonds represent super clones – an aggregation of all clone classes between the same subsystems (N10). An edge between a rectangle and a diamond represents a containment relationship (N1a). Number of cloned lines in a subsystem is represented by the rectangle width, whereas the rectangle height represents the number of clone classes. A diamond’s width is similarly calculated. Subsystems having more clones with each other are positioned closer to each other. Node colors are also used to show the intensity of cloning.
Fig. 19. Duplication Web of the system [28]
V. Clone Scatterplot (cs) Another Riegers polymetric view [26], [28]. It consists of nodes and edges representing files and clone connections (Figure 20). Connected nodes represent external duplication between the files (N12) and thickness of the edge represents the extent of sharing of code between files. Small files are located towards left and large files are located towards right (N14). Similarly, files having little duplication are placed at the top of the view while the nodes having more duplication are placed at the bottom (N4). Consequently, Nodes closer to the 45 diagonal contain high amounts of duplication with respect to their size.
T. Dependency Browser (db) Found in SoftGUESS [34], [40] (Figure 18), it consists of square package/class/method (PCM) nodes and circular clone nodes, connected with dependency edges showing containment
52
common subsequence or Levensthein similarity measure comparison can be sufficient. For tree-based representations, a comparison of syntactic categories in terms of syntax subtrees can be determined with the Levensthein distance for trees [42]. The Code Inspection view would then need to be enhanced to show the syntactic categories of the differences. Visualization for comparing program dependency graphs, which can cope with reordered statements, is an interesting challenge. Showing differences in terms of graphs would be a natural choice. For easy comparison, the graph would need to be normalized to suppress spurious differences due to semantically equivalent reordering. Those graphs could be overlaid and the real differences could be highlighted. Here it would be worthwhile to look into recent ideas for dynamic graphs in information visualization [43]. Another challenge for all these difference viewers is the simultaneous comparison of more than two cloned fragments. Similar visualizations for differences can be used for N22 to show the clones with their inconsistencies. N15 would additionally require to show differences between each clone instance and its context (e.g., different data flow). To show N16, visualizations based on source code slicing, control and data flow graph slicing can be used. For N17, a simple tabular view mapping could be sufficient. N23c and N24 (for quality aspects such as performance, correctness, etc.) can be shown by visualizations for quantitative scales. For a small set of owners, N25 can be displayed with colors on any clone visualization not using colors for showing other cloning information. N21 is highly task-specific. More concrete definitions of meaningfulness may be mapped onto existing visualizations. N26 belongs to category (i) and a simple option is a textual description of the clone copyright notice. As also highlighted by Zibran [44], none of the existing clone visualizations shows the inheritance structure or the runtime interaction of the program units, which are essential for assessing refactoring opportunities (N27). Some ideas for incorporating this information can be borrowed from RBC Crawler9 . The code inspection view also needs to be enhanced in a number of ways to facilitate refactoring10 (N28). The Rewrite Impact View by Broeksema and Telea [45] is an effort to visualize the impact of refactoring across a code base (N29). If expressed by metrics, this can also be visualized by classical visualizations for quantitative scales. The overall conclusion is that many of the information needs are already covered or could easily be covered by existing types of visualization. Yet, there are some—as noted above–where additional research is needed. We hope that other researchers in software visualization and clones will address these in their future work. We strongly believe that suitable visualizations must be developed in close partnership with real users managing clones. The design of useful visualization must start with a clear vision of what information needs developers have in their particular task. We hope that our framework of
Fig. 20. Clone Scatterplot [28]
IV. C ONCLUSIONS Clone visualization is a subfield of software visualization, which in turn is a subfield of information visualization. Hence, it comes to no surprise that most types of clone visualization can be traced back to types of visualization widely used in information visualization. Quantiative clone data are visualized by classical statistical graphics such as pie and bar charts (bm, pcv, lc, pc). Clone evolution is depicted through time series charts (cev). Bipartite binary relations are shown as two-dimensional matrices (dp, bc) or maps (ccfe), tree-like relations are drawn as treemaps (tm) or graphs (ntv, hdg, csht, cseg, eb, smv), acyclic relations are depicted by Hasse diagrams (hd), and other possibly cyclic relations as arbitrary graphs (wv, cccg, db, dwv, cs). Arguably, only the enhancement of trees and graphs with quantitative data based on polymetric views [41] and the visualization of source code—a form of sequential orders (ebc, civ)—are means that may be considered invented in software visualization rather than in the more general field of information visualization. And here, too, clone visualization can hardly claim to have innovated these types of visualization. For instance, the enhanced bar chart (ebc) builds upon the idea of Seesoft and the code inspection view (civ) on general source-code diff views. The innovation in clone visualization is, hence, not to be searched in the types of visualization used, but rather the adaption of existing types for the purpose of comprehending software clones. It is the mapping of clone data onto visual attributes. Table II summarizes which of the identified information needs are answered by which type of visualization proposed in the literature. Analyzing the gaps present in Table II leads to three possibilites: (i) the information refers to abstract concepts that cannot be visualized or where visualization makes no sense (e.g., N19, N20), (ii) the information can be incorporated into existing visualizations with simple extensions (e.g., N23a, N23c), or (iii) the information requires exploration of new visualizations (e.g., N27, N28). Digging further into the information needs with no associated visualization in Table II one by one, the following extensions can be explored. Some of the extensions we list should be straight forward, others are rather mid-term or long-term research goals. N10a and N10b can be easily supported in any visualization showing N10. Visualization for N11a and N15 would depend upon the type of code representation being compared. In case of text or token sequences, the classical diff with either longest
9 http://scg.unibe.ch/wiki/projects/archive/rbcrawler 10 https://www.devexpress.com/Products/CodeRush/refactor
53
pro.xml
goals and information needs will help them to position, guide, and assess their research towards more user-oriented clone visualization. We do not claim that the framework is complete and, hence, invite others to extend it.
[22] R. Tairas, J. Gray, and I. Baxter, “Visualization of clone detection results,” in Proceedings of the 2006 OOPSLA Workshop on Eclipse Technology eXchange, 2006, pp. 50–54. [23] T. Kamiya, S. Kusumoto, and K. Inoue, “CCFinder: a multilinguistic token-based code clone detection system for large scale source code,” IEEE Trans. Softw. Eng., vol. 28, no. 7, pp. 654–670, 2002. [24] S. Livieri, Y. Higo, M. Matushita, and K. Inoue, “Very-large scale code clone analysis and visualization of open source programs using distributed CCFinder: D-CCFinder,” in International Conference on Software Engineering, 2007, pp. 106–115. [25] J. Helfman, “Dotplot patterns: a literal look at pattern languages,” TAPOS, vol. 2, no. 1, pp. 31–41, 1996. [26] M. Rieger, “Effective clone detection without language barriers,” Ph.D. dissertation, University of Bern, 2005. [27] J. R. Cordy, “Exploring large-scale system similarity using incremental clone detection and live scatterplots,” in International Conference on Program Comprehension, 2011, pp. 151–160. [28] M. Rieger, S. Ducasse, and M. Lanza, “Insights into system-wide code duplication,” in Working Conference on Reverse Engineering, 2004, pp. 100–109. [29] B. Johnson and B. Shneiderman, “Tree-maps: A space-filling approach to the visualization of hierarchical information structures,” in IEEE Conference on Visualization, 1991, pp. 284–291. [30] H. L¨u and J. Fogarty, “Cascaded treemaps: Examining the visibility and stability of structure in treemaps,” in Proceedings of Graphics Interface. Canadian Information Processing Society, 2008, pp. 259–266. [31] F. Deißenb¨ock, “Continuous quality control of long lived software systems.” Ph.D. dissertation, Technical University Munich, 2009. [32] Z. M. Jiang, A. E. Hassan, and R. C. Holt, “Visualizing clone cohesion and coupling,” in Asia Pacific Software Engineering Conference, 2006, pp. 467–476. [33] Z. M. Jiang, “Visualizing and understanding code duplication in large software systems,” Master’s Thesis, University of Waterloo, 2006. [34] E. Adar and M. Kim, “Softguess: Visualization and exploration of code clones in context,” in International Conference on Software Engineering, vol. 7, 2007, pp. 762–766. [35] J. H. Johnson, “Visualizing textual redundancy in legacy source,” in Conference of the Centre for Advanced Studies on Collaborative research. IBM Press, 1994, p. 32. [36] D. Holten, “Hierarchical edge bundles: Visualization of adjacency relations in hierarchical data,” IEEE Transactions on Visualization and Computer Graphics, vol. 12, no. 5, pp. 741–748, 2006. [37] D. H. R. Holten, “Visualization of graphs and trees for software analysis,” Ph.D. dissertation, Technical University of Delft, 2009. [38] B. Hauptmann, V. Bauer, and M. Junker, “Using edge bundle views for clone visualization,” in Proceedings of the International Workshop on Software Clones, 2012, pp. 86–87. [39] L. Voinea and A. C. Telea, “Visual clone analysis with SolidSDD,” in Working Conference on Software Visualization, 2014, pp. 79–82. [40] R. K. Saha, C. K. Roy, and K. A. Schneider, “Visualizing the evolution of code clones,” in Proceedings of the International Workshop on Software Clones. ACM, 2011, pp. 71–72. [41] M. Lanza and S. Ducasse, “Polymetric views—a lightweight visual approach to reverse engineering,” IEEE Trans. Softw. Eng., vol. 29, no. 9, pp. 782–795, Sep. 2003. [42] P. Bille, “A survey on tree edit distance and related problems,” Theoretical Computer Science, vol. 337, no. 1–3, p. 217239, 2005. [43] S. Rufiange and M. McGuffin, “Diffani: Visualizing dynamic graphs with a hybrid of difference maps and animation,” IEEE Transactions on Visualization and Computer Graphics, vol. 19, no. 12, pp. 2556–2565, Dec. 2013. [44] M. F. Zibran, “Analysis and visualization for clone refactoring,” in Proceedings of the International Workshop on Software Clones. IEEE, 2015, pp. 47–48. [45] B. Broeksema and A. Telea, “Visual support for porting large code bases,” in Working Conference on Software Visualization, 2011, pp. 1–8.
R EFERENCES [1] J. I. Maletic, A. Marcus, and M. L. Collard, “A task oriented view of software visualization,” in Working Conference on Software Visualization. IEEE Computer Society Press, 2002, pp. 32–40. [2] H. A. Basit, M. Hammad, S. Jarzabek, and R. Koschke, “What do we need to know about clones? deriving information needs from user goals,” in Proceedings of the International Workshop on Software Clones. IEEE, 2015, pp. 51–57. [3] R. Koschke, “Survey of research on software clones,” in Duplication, Redundancy, and Similarity in Software, ser. Dagstuhl Seminar Proceedings, no. 06301, 2006. [4] C. K. Roy, M. F. Zibran, and R. Koschke, “The vision of software clone management: Past, present and the future,” in IEEE Conference on Software Maintenance, Reengineering and Reverse Engineering (CSMRWCRE), 2014 Software Evolution Week, 2014, pp. 18–33. [5] C. K. Roy, J. R. Cordy, and R. Koschke, “Comparison and evaluation of code clone detection techniques and tools: A qualitative approach,” Journal of Science of Computer Programming, vol. 74, no. 7, pp. 470– 495, May 2009. [6] D. Rattana, R. Bhatiab, and M. Singh, “Software clone detection: A systematic review,” Information and Software Technology, vol. 55, no. 7, pp. 1165–1199, Jul. 2013. [7] R. Koschke, I. Baxter, M. Conradt, and J. R. Cordy, “Software clone management towards industrial application,” in Dagstuhl Seminar: Software Clone Management Towards Industrial Application, 2012. [8] P. Geesaman, J. Cordy, and A. Zouaq, “Ontology alignment using bestmatch clone detection,” in Proceedings of the International Workshop on Software Clones, 2013. [9] D. Martin and J. R. Cordy, “Analyzing web service similarity using contextual clones,” in Proceedings of the International Workshop on Software Clones. ACM, 2011, pp. 41–46. [10] Y. S. Ma and D. K. Woo, “Applying a code clone detection method to domain analysis of device drivers,” in Asia-Pacific Software Engineering Conference, 2007, pp. 254–261. [11] M. Godfrey and Q. Tu, “Tracking structural evolution using origin analysis,” in International Workshop on Principles of Software Evolution, 2002, pp. 117–119. [12] J. R. Pate, R. Tairas, and N. A. Kraft, “Clone evolution: a systematic review,” Journal of Software: Evolution and Process, vol. 25, no. 3, pp. 261–283, 2013. [13] T. Lavoie, F. Khomh, E. Merlo, and Y. Zou, “Inferring repository file structure modifications using nearest-neighbor clone detection,” in Working Conference on Reverse Engineering, 2012, pp. 325–334. [14] A. Walenstein and A. Lakhotia, “The software similarity problem in malware analysis,” in Duplication, Redundancy, and Similarity in Software, ser. Dagstuhl Seminar Proceedings, no. 06301, 2006. [15] D. Bruschi, L. Martignoni, and M. Monga, “Using code normalization for fighting self-mutating malware,” in Proceedings of the International Symposium on Secure Software Engineering, 2006, pp. 37–44. [16] Y. Zhang, H. A. Basit, S. Jarzabek, D. Anh, and M. Low, “Querybased filtering and graphical view generation for clone analysis,” in Proceedings of the International Conference on Software Maintenance, 2008, pp. 376–385. [17] M. Asaduzzaman, C. K. Roy, and K. Schneider, “VisCad: Flexible code clone analysis support for NiCad,” in Proceedings of the International Workshop on Software Clones, 2011. [18] J. Harder and N. G¨ode, “Efficiently handling clone data: RCF and Cyclone,” in Proceedings of the International Workshop on Software Clones, 2011, pp. 81–82. [19] Y. Ueda, Y. Higo, T. Kamiya, S. Kusumoto, and K. Inoue, “Gemini: Code clone analysis tool,” in Proceedings of the International Symposium on Empirical Software Engineering, vol. 2, 2002, pp. 31–32. [20] S.-L. Voinea, “Software evolution visualization,” Ph.D. dissertation, Technical University of Eindhoven, 2007. [21] S. G. Eick, J. L. Steffen, and E. E. Sumner Jr, “Seesoft—A tool for visualizing line oriented software statistics,” IEEE Trans. Softw. Eng., vol. 18, no. 11, pp. 957–968, 1992.
54
TABLE II M APPING OF I NFORMATION N EEDS ONTO V ISUALIZATIONS (P ROGRAM U NIT = PACKAGE , F ILE , D IRECTORY, ETC .) No N1 · N1a · N1b N2 N3 N4 · N4a · N4b N5 N6 · N6a · N6b N7 N8 · N8a · N8b · N8c N9 N10 · N10a · N10b N11 · N11a · N11b · N11c N12 N13 N14 N15 N16 N17 N18 · N18a · N18b · N18c · N18d · N18e N19 N20 N21 N22 N23 · N23a · N23b · N23c N24 N25 N26 N27 N28 N29
Information Needs
Visualizations Clone Perspective Where are the clones in a given program unit (possibly distinguished by their clone types)? → bm, ebc, dp, ccfe, tm, ntv, hdg, csht, ebwv Where are the clones located in the system directory structure? → smv, cccg, db Where are the clones located in the system inheritance structure? → smv What is the cardinality of a clone class? → pcv, cev, ebc, dp, ccfe, tm, eb, wv What is the size of the clone? → bm, pcv, ebc, civ, dp, csht, hd, wv What is the clone rate of a given program unit? → pc, pcv, ebc, dp, tm, ntv, csht, wv, cs What is the internal clone rate? → hdg, smv, cccg, dwv What is the external clone rate? → hdg, csht, smv What is the volume of a clone (the total sum over the size of all instances of a clone class)? → ebc, dp What is the dispersion (i.e., scattering in different units) of a given clone class? → pcv, ebc, dp, tm, ntv, csht, eb, wv Where are the clones of a given clone class located within a given program unit? → ntv, eb Where are the clones of a given clone class located across program units? → ntv, hdg, eb What type of syntactic structures are contained in a clone? → civ What are the differences among the instances of a clone? → pc, bc, civ, dp, rsp, db What are the differences in terms of the underlying representation of code (textual, tokens, syntax, semantic)? → civ What are the differences in terms of a given similarity measure (e.g., Latent Dirichlet Allocation)? → rsp What are the differences in terms of given code metrics (e.g., the length of the clone)? → pc, bc, rsp, db What are the differences of clone classes in terms of a given set of clone-class metrics? → pc, bc, pcv Containing Unit Perspective Which clones exist across program units? → bm, ebc, ccfe, hdg, csht, eb, wv, cccg Which clones exist across program units with incompatible copyrights? → as above Which clones of a private unit exist in forbidden program units? → as above What are the differences of program units containing clones? → pc, rsp What are the differences between program units in terms of their underlying representation? → as above What are the differences between those program units according to a similarity measure? → rsp What are the differences between those program units according to other selected code metrics? → pc, rsp How much code of one program unit is cloned in another program unit? → ebc, smv, hd, wv, cccg, dwv, cs How much code of one program unit is cloned across a particular given group of program units? → ebc, hdg, wv, cccg What is the size of the program unit containing clones? → pcv, ebc, ntv, hd, wv, cs Context Perspective What are the differences in the context of clones? → as above How are the clones related to each other (e.g., data is passed between clones)? → db How are clones in code related to clones in other formal and non-formal system artifacts? → as above Evolution Perspective How did clones evolve? → lc,cev, ebc, civ, cseg, wv Which clones are present across versions of the evolving system and which clones disappeared? → cev, ebc, civ, cseg, wv What is the location of a clone in different system versions? → ebc, wv How has a clone changed from one version to another? → lc, cev, civ What is the overall trend of cloning across versions? → lc, cev, ebc, cseg, wv What is the spread of cloning across versions? → lc, ebc, wv Conceptual Perspective What is the higher-level abstraction/concept behind the clones or clone classes? → as above What is the reason for the clones? → as above Which are the meaningful clones for a particular task at hand? → as above Impact Perspective Where are (inconsistent) type-3 clones that may hint at defects? → as above What is the benefit of removing/refactoring a clone? → pcv How much code can be eliminated when a clone is removed? → as above How much code can be eliminated when a clone class is removed? → as above What is the reduction of maintenance effort? → as above What are the effects of a clone onto quality? → as above Who is the owner of original and copied code? → as above What is the copyright of the copied code? → as above Refactoring Perspective Which clones can be refactored by a given refactoring? → as above How can a given clone be refactored? → as above What are the costs and risks of applying a given refactoring on this clone? → as above
55