the same time, the automation of measurements, the networking of sen- sors, the ... active visualization provides a new generation of tools and techniques ..... visualizations are the social networks that aim at revealing relationships among.
Interactive Visualization - A Survey Dominique Brodbeck1 , Riccardo Mazza2 , and Denis Lalanne3 1
University of Applied Sciences Northwestern Switzerland, 2 Universit` a della Svizzera Italiana 3 University of Fribourg
Abstract. Advances in computer science and technology have led to unprecedented new possibilities in science, engineering, and business. At the same time, the automation of measurements, the networking of sensors, the digitization of processes, and large-scale computer simulations produce a deluge of data. The amount of new data grows faster than our ability to analyze and comprehend it. The maturing field of interactive visualization provides a new generation of tools and techniques that promise to contribute to a solution of this problem. In this chapter we present a survey of the field. The two complementary aspects of scientific visualization and information visualization are introduced, and a description of typical applications and research directions provided. The survey is rounded off by a look at the activities in the various fields of interactive visualization in Switzerland.
1
The Keyhole Effect
What began with the painting of rock walls in a damp cave, and in the mean time found its preliminary climax in the epic expanses of the Internet, is the expression of our urge to collect, analyze, and communicate observations about the environment, with the purpose of gaining new insights. The systematic collection of data started in the 17th and 18th century with the utilitarization of science, and the associated transformation from a tooloriented to a technology-oriented culture. At the same time, people also started to collect data outside of the natural sciences, in order to analyze them statistically. Examples are the constitution of citizens in large cities, trade balances, transport risks, etc. The development of data recording, processing, and transmission technologies has played a crucial role in this development. The digitization of measurements and observations, and their processing with the help of electronic machines allows to efficiently record and collect data in huge data bases. There is hardly a company or organization that has not automated and digitized their business processes. Buzz words like Data Warehousing, E-commerce, and Customer Relationship Management are witness to this. While we have made great advances in collecting and managing data, the question remains how we can get something back out of these huge reservoirs. How can we turn data into information, and eventually knowledge that is useful?
2
The interfaces to these data collections therefore come into focus. In his book ”Interface Culture” [1], Steve Johnson compares their future role to those of the cathedrals in the middle ages. Their function was, among others, to make the infinity of heaven tangible and understandable to humans. The exponentially growing amounts of data and information lead to the existence of similarly large and incomprehensible data spaces and information worlds. They will only become accessible if we have appropriate interfaces and tools. The interfaces to these data bases and information collections have largely remained the same since the invention of the computer terminal: text and numbers in tabular form, maybe a pie chart here and there. The mouse allows us to not have to type in commands anymore but instead to click on buttons labeled with those commands. Overlapping windows allow us to perform multiple of such tasks in parallel. But the principle remains the same: we see limited aspects in a static and sequential way. Traditional data base interfaces for example require users to be able to precisely formulate a query, and then present a linear list of results - mostly too many, sometimes none and often the wrong ones. Users have no way of knowing if the results are only outliers, or if there are other similar objects, and how the result will change if the query is just modified slightly. Anyone who has ever looked for an apartment on the Internet that is close to the station, in a middle price range, but not too small, except if the price is according or there is a parking space, knows the problem. You feel like you peek inside a warehouse through the keyhole. You only see limited excerpts, you can not change perspective, and in order to compare two objects you have to switch between two views. If you want to access an object you must shout precise instructions through the closed door and wait, until they are handed over. In short, you stay outside with locked hands.
2
A New Approach: Interactive Visualization
A new generation of tools and techniques promises to contribute to a solution to these problems. Two concepts play a key role: visualization and interactivity. 2.1
Visualization
Current information systems and computer programs make only little use of the human perceptual capabilities. Visual perception in particular has an enormous potential to efficiently detect patterns, trends, outliers, and clusters. We are able to recall, recognize and scan images quickly and precisely, and we can detect subtle changes in color, shape, movement and texture. The bandwidth for the communication of information is much higher for the visual channel than for any of our other senses. Visual structures are perceived directly, and don’t have to be first decoded symbolically, as is the case with numbers and letters. Visual representation transforms a cognitive problem into a perceptual task, which is drastically more efficient.
3
2.2
Interactivity
Traditional systems work in batch mode: first the search query is completely specified, then the query is sent to the system. The system executes the query and finally shows the results. Highly interactive systems on the contrary work incrementally and reversibly. Every change is immediately sent to the system and a dynamic feedback is generated. Changes can be easily reverted. These systems work after the principle of ”direct manipulation”: relevant objects and processes are visually represented and can be manipulated directly with the mouse. The manipulations take the place of a complex syntax, results are immediately visible. For a review and categorization of interaction techniques see [2]. 2.3
Interactive Visualization Systems
Interactive visualization systems combine visualization with interactivity. They provide the overview and embed details within. The highly interactive way of working encourages exploration and allows users to experience the data spaces. Ben Shneiderman from the Human-Computer Interaction Laboratory (HCIL) at the University of Maryland [3] appropriately coined the ”Visual Information Seeking Mantra”: Overview first, zoom and filter, then details-on-demand. Visual tools that support our thought processes have existed for a long time of course. Statistical graphics for example, date back to the 18th century. Well known concepts, such as the use of length and area to represent quantity, time series, scatter plots and multi-variate diagrams, were all invented during the period of 1750 to 1800. The economist William Playfair in particular, developed and improved these techniques (1759-1823), Among others, he published the first known bar chart in 1785. These developments have continued into the present days with exponents such as Jacques Bertin and Edward Tufte who developed theories about the visual display of quantitative information. So what is new about interactive visualization? The use of computers creates a new media, where graphical objects are not static anymore, but can be interactively manipulated and can change dynamically. Because this new medium is computer-based, it is easily accessible and at low cost. The reason why interactive visualization has emerged as a discipline in the past few years is twofold. On one hand, personal computers have reached a level of performance that allow the use of graphics intensive software. Standard screens have a resolution of 1 million pixels and enough color depth to display graphical objects in good quality. The digitization of business processes on the other hand, as well as the automation of measurements with increasing sensor bandwidth, leads to large amounts of data that serves as raw material for the gain of information and knowledge. The Internet exponentiates the situation by connecting all these sources in a huge network.
4
The collision of these two developments acts as a catalyst for the emergence of interactive visualization systems. The field has now reached a level of maturity where we see commercial products and companies built around the idea of interactive visualization, and courses being taught at universities. In science and technology, the trend was picked up first some 20 years ago, with the visualization of scientific data from disciplines such as physics, astronomy, or medicine. About ten years later the trend spread into the world of business and administration, where the data is mostly of abstract non-geometric nature. This has lead to two distinct fields, scientific visualization and information visualization. The distinction is partly historical and somewhat arbitrary, and the boundaries start to blur in areas such as bioinformatics, where the data is scientific but still abstract, or in geographic information systems where abstract processes are visualized in relation to space. The next two sections will sketch out these two fields, in order to provide an overview of the state of the art.
3
Scientific Visualization
The establishment of the field of scientific visualization can be traced back to a report of the U.S. National Science Foundation in 1987 [4]. The report was entitled ”Visualization in Scientific Computing”, and positioned visualization as a new scientific instrument that could accelerate progress in science. At that time, many supercomputer centers were created that gave scientists access to large computing resources, but at the same time scientists had no adequate means to examine the results and steer the computations. Since then, scientific visualization has broadened somewhat and is now generally considered to be the use of computer graphics and imaging technology as a tool to comprehend potentially huge amounts of data obtained by simulation or physical measurement. Since simulations and measurements in science and engineering are typically done on natural phenomena, this implies that the data is spatial in nature, possibly with a temporal component. 3.1
The Visualization Pipeline
More technically speaking, visualization can be seen as a pipeline that transforms raw data into images that can be interpreted by the human perceptual system. Thus, representation and transformation are the two central concepts in scientific visualization. The pipeline begins when the data is generated or captured, and transformed into a representation that is amenable for further processing [5]. Scientific data is typically represented as three components: geometry, topology, and attributes. Geometry defines the discrete points in space (nodes) at which the physical continuum - either computed or measured - is sampled. Topology defines the structure (cells) of how these points are related, so that the data can be interpolated between the points. Typical topologies are structured grids (e.g. scanned imaging data), but topologies can also consist of unstructured
5
points related by heterogeneous cell types (e.g. weather stations at irregular positions). Attributes finally, describe the actual values that were computed or measured at the points of the geometry. Attributes can be in the form of scalars (e.g. temperature), vectors (e.g. velocity), or tensors (e.g. stress). The next step in the pipeline is the data enrichment transformation, where data is interpolated, filtered, smoothed, merged, rotated, etc. The result is derived data that is now ready to be transformed, by mapping it to displayable objects whose shape, dimensions, and color represent the enriched data. The result of the mapping transformation are 2D and 3D graphical primitives (e.g. lines, polygons). The final step is the rendering transformation, whereby a displayable image is produced, using appropriate rendering techniques (e.g. surface, volume) and parameters (e.g. lighting, perspective). Each of the three transformation steps is repeated iteratively, driven by user input and interaction. All these transformations are realized as algorithms. Some algorithms can be classified as structural, i.e. they transform one or several components of the data. Scaling or rotating for example changes the geometry of a dataset. The creation of isosurfaces or the sampling of unstructured points onto a regular grid change the topology of a dataset. Deriving the magnitude from a vector attribute changes the dimensionality of the attribute of a dataset. Other algorithms are better classified by the type of attribute data that they work on. Scalar algorithms for example map scalar values to colors, or create contour lines for a constant value. Vector algorithms for example create streamlines or oriented glyphs to visualize vector fields. Another important type of algorithms is related to the problem of representing dense 3D volumes, and providing the possibility for seeing inside them. Volume rendering and slicing algorithms belong to this class. Optimizing these algorithms for performance and accuracy so that they can be applied efficiently to large and multi-dimensional datasets, forms an important part of scientific visualization research [6]. 3.2
Applications
Scientific visualization is applied in all the fields where the physical world is sensed, and where physical phenomena are modeled or simulated. Typical applications can therefore be found in fields such as medicine, biochemistry, the Geosciences, the space sciences, or Physics and engineering. Medical applications are driven by the fact that an increasing number of spatial and non-invasive imaging techniques (e.g. magnetic resonance imaging, computed tomography) have become available. They are routinely used for diagnostic applications, or to plan and guide surgery. Worth noting is the Visible Human, a project run by the U.S. National Library of Medicine (NLM). It is an effort to create a detailed data set of cross-sectional photographs of the human body, in order to facilitate anatomy visualization applications [7]. Biochemistry studies the structure and function of cellular components. Many of these are large and complex molecules (e.g. proteins, nucleic acids). Visual-
6
Fig. 1. Visualization of a human head from medical imaging data. Slicing, isosurface, and contouring algorithms are used to show the inside structures of the volumetric dataset.
7
ization helps with understanding the three-dimensional structure and dynamic behavior of these molecules, and there are many specialized molecular visualization software tools available to support research on molecular structures and drug design.
Fig. 2. Visualization of a large molecule. Surface and volume rendering techniques are used in combination to show different aspects of the three-dimensional molecule structure.
A prominent application of visualization in the Geosciences are the results from climate modeling, be it in the profane form of weather forecasts on TV, all the way to sophisticated simulations of complex climatic phenomena, or timeresolved remote sensing data. Geologist are searching for natural resources by using visualizations of otherwise invisible geologic structures. Another large area of application lies in the fields of Physics and engineering, where computational fluid dynamics can simulate the flow of fluids around objects (e.g. airplanes), or finite element simulations can compute physical processes such as stress and elasticity in three-dimensional objects. In industrial design and architecture finally, the data and problems are not necessarily scientific in nature, but the same visualization techniques are successfully used to see the unseen.
8
Fig. 3. Visualization of sea surface temperature anomalies (colors), with red being warmer than normal and blue being colder than normal, and sea surface height anomalies as exaggerated heights; visualization by NASA/Goddard Space Flight Center, Scientific Visualization Studio.
3.3
Research Directions
Even though Moore’s law is still in effect and continually increases computing power, the amounts of data that are collected and produced are growing even faster. Increasing algorithm efficiency and optimizing resources will therefore continue to be important. Relevant areas of research include parallelization of algorithms, multi-resolution modeling to represent complex detailed 3D objects adaptively at different levels-of-detail, or the development of strategies for moving and replicating data on the network based on access patterns for visualizations and interactions shared by multiple users. On the side of representation, there is inherently no big need for inventing completely new visual metaphors, such as is more the case in the visualization of abstract data as described in the next section on information visualization. However, the focus in scientific visualization has so far been on photo-realistic rendering of surfaces and volumes. As datasets get larger, there is an increasing need for effectively conveying the most important visual information. This can be achieved by visual abstraction techniques that are inspired by traditional technical and medical illustrations. Research in illustrative rendering explores how these techniques can be applied to scientific visualization.
9
4
Information Visualization
When we have to deal with data that have mostly a non-geometric nature, such as people, files, or stocks, information visualization found its natural place. Information visualization (or infovis) is a relatively new field of research that make use of visual representations that take advantage of humans’ notable perceptual ability of vision systems for visually exploring data at various levels of abstraction. This allows people to understand essential facts of the data, to quickly detect patterns, trends, outliers, clusters, and to gain insights. The term “information visualization” was coined by the researchers of Xerox PARC at the end of the 1980s to distinguish a new discipline, historically considered as a sector of Human–Computer Interaction. A number of definitions have been proposed to define the scope of this discipline. The most widely adopted is the one defined in the classic Readings on Information Visualization by Card et al. [8]: Information visualization is the use of computer-supported, interactive, visual representations of abstract data to amplify cognition. This definition has some keywords that are fundamental for the understanding of this discipline: thanks to the widespread availability of increasingly powerful and less expensive computers, combined with the advances in computersupported graphics, visual representations can be interactive, which means that people can manipulate visualization in real time, e.g. zooming in on a relevant item, filtering out unnecessary items, or update a graphical display in a fraction of a second. The term abstract data is used to distinguish between data that has a physical correspondence and is closely related to mathematical structures and models (which is object of study for scientific visualization) and abstract data that does not necessarily have a spatial dimension and can be generated, calculated or found in many diverse ways. For example, data of soccer matches in the last championship, or data revealed by instruments for environmental pollution tests. Finally the ultimate goal of visual representation is to improve the cognitive process that generates information from the data that we are presented with, precisely through visual representation of this data, making use of the perceptual abilities of the human visual system. Card et al. [8] propose six major ways in which visualizations can amplify cognition: 1. by increasing the working memory and processing resources available to users to solving problems; 2. by reducing the search for information, by representing large amount of data in a small space; 3. by using visual representations to detect structural relationships on data, such as patterns on data; 4. by deducing new information through processes of perceptual inference; 5. by using perceptual perception mechanisms for monitoring a high number of events, such as in dashboards;
10
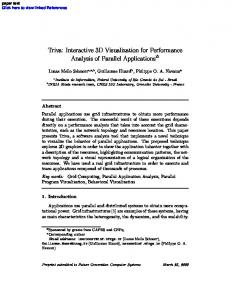
Fig. 4. Visual representation of the march of Napoleon’s army in the Russian campaign of 1812, produced by Charles J. Minard.
6. by encoding information in a manipulable medium that allows the dynamic and interactive exploration of a space of parameter values, or by including and excluding some data from the visualization. Information visualization applications are particularly suitable in presentation and exploration tasks. These will be discussed in next sections. 4.1
Presentation
Visuals sometimes are useful when we want to communicate an idea, a concept, or an event. Information visualization might help us to visually represent concepts that, if expressed verbally, we would find difficult to explain clearly to a listener. When we have data with which we need to illustrate concepts, ideas, and properties intrinsic to that data, the use of visual representations offers us a valid communication tool. The main problem is designing a visual representation that faithfully reproduces the information codified in the data and, meets the specific requirements of the users, and facilitates the users in their tasks. Edward Tufte maintains that “excellence in statistical graphics consists of complex ideas communicated with clarity, precision, and efficiency” [9]. We can adopt this guideline in information visualization as well, and may affirm that excellence in communicating with information visualization consists in giving the reader as much data as can be processed quickly, using as little space as possible, and with the least cognitive effort. Let’s look at the visual representation illustrated in Fig. 4. It deals with a map created by Charles Joseph Minard, a French engineer, in 1869. The map
11
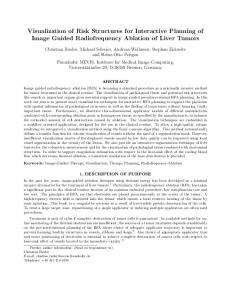
Fig. 5. Gapminder World Chart compares countries by income and health; image from www.gapminder.org reproduced with copy permission.
was conceived to illustrate the number of losses suffered by Napoleon’s army during the disastrous march toward Moscow in 1812. The thick band shows the route taken by the troupes, from the Polish border to Moscow, and the width of this track represents the number of soldiers present at each point of the journey. The number of losses suffered by the army is evident at a glance. Of the 422,000 soldiers who set off from the Polish border, only 100,000 arrived in Moscow. Napoleon’s retreat during the freezing Russian winter is represented by the dark line, linked to a graph that reports the harsh temperatures that further decimated the already-exhausted army. Some rivers, in which numerous soldiers lost their lives attempting to cross, are also indicated. This visual is a superb example of the concept of excellence expressed by Tufte, who, not without good reason, defined it as “the best statistical graphic ever drawn” [9]. Another example is depicted in Fig. 5. It is an example of a scatterplot from Gapminder [10] that shows data from the United Nations Statistics Division4 and aims to compare three indicators: under-five year mortality rate per 1000 live births, gross national income per capita (US $ by exchange rate) and total population. The continent to which each nation belongs is mapped to the color of the graphical element. The main purpose of the data is to produce a graphical presentations that displays the magnitude of health (measured through the 4
http://unstats.un.org
12
under-five year mortality rate) and wealth disparities in the contemporary world. One immediately notices an almost linear correlation between the wealth and the state of health: The state of health improves with an increase in the wealth of the population. An interesting insight comes from the analysis of the richest nations. In particular, USA has worse health conditions than most of the European countries and, surprisingly, Singapore is the most healthy country. There are also some outliers; some evident cases are represented by Malaysia and Cuba, whose population has an excellent level of health (even higher than that of the United States), despite the fact that the income is in the middle range. Other interesting information is drawn from the color of the circles. For example, the Sub-Saharan Africa nations are almost all grouped in the lower left-hand corner of the graph, indicating the state of extreme poverty and the terrible health levels in these unfortunate nations. 4.2
Exploration
Information visualization is best applied in those tasks that require the exploration of a large dataset with the aim of identifying properties, relationships, regularities, or patterns. Often people want to have a look at a dataset without having a specific goal in mind. By visually examining the data, people may learn more about it, discover new facts, and gain new insight. Thanks to the perceptual ability of vision, information visualization systems may help in identifying, properties, relationships, regularities, or patterns. Jacques Bertin defines it as “the visual means of resolving logical problems” [11]. Interaction in particular does facilitate the exploratory tasks, or as it is being said, it helps in discovering the unexpected [12]: by adjusting the input data, or manipulating the view generated, people can then identify interesting facts that could remain hidden in a static view. As Ben Shneiderman wrote in the foreword of Chen (2004), “visualizations are especially potent in promoting the intuition and insights that lead to breakthroughs in understanding the relevant connections and salient features” [13]. An interesting aspect of the application Gapminder World, depicted as a static chart in Fig. 5, is the possibility for the user to manipulate the indicators of development mapped onto the axes (users can choose among more than a hundred indicators, such as energy consumption, technology adoption, infrastructure, education, etc.), and watch the graph change over time by using the slider to change years of data statistics. Users can also select one or more countries from the list, and track a selected country when an animation plays. For example, Figure 6 represents a screenshot of the interactive application of Gapminder World. In this case, we are interested in discovering how the fertility of the population changed over the years. In particular, we put in relation the income per capita and the number of children per woman. We also track the changes that happened to Singapore (that had the lowest children dying before age 5, as we have seen in Fig. 5) and the United States. Each bubble represents one year. Here we can see the evolution for these two nations from 1950 to 2006. In particular, we can see Singapore’s dramatic decrease of births since the
13
Fig. 6. Gapminder World is an interactive application that compares countries by income and fertility in 2006, and tracks variations over years for Singapore and the United States; visualization from Gapminder World, powered by Trendalyzer from www.gapminder.org.
1950s, as well as in the United States, but only until 1976, when the birth rate inverted the tendency. Also we can notice that China’s income and fertility in 2006 (represented by the largest red bubble) matches with those of Singapore in 1976. 4.3
Research directions
Social visualization is one of the emerging subsets of information visualization that is acquiring more and more interest with the increasing availability of networked environments that connect people. Newsgroups, blogs, social network sites (such as Facebook or LinkedIn) are some examples of services that bring together large groups of people, and collect huge quantities of data that may make “difficult to understand the environment of this data and to lose oneself in the midst of the crowds” [14]. Social visualization aims to visually represent data that concerns people to make interaction patterns and connections salient. Judith Donath, as far back as 1999, carried out some experiments at MIT about visualizing on-line conversations [15]. On that occasion, she coined the first definition of social visualization as the “visualization of social information for social
14
purposes” [15]. The key distinction of this type of visualization is that social relationships of people, the groups an the patterns they form, are the most relevant aspects that should emerge from the visualizations. Examples of social visualizations are the social networks that aim at revealing relationships among various individuals, and to determine qualitative aspects such as leadership or informal structure. In practical applications, they might depict newsgroup activities, email patterns, conversations, social networks structures, etc. with the aim of improving our understanding of the community (also the dynamics, how it evolved during the time) and of extracting the social network structure embedded in the collection of conversations or contacts in blogs and social network sites. Information visualization has currently several other research directions: the problem of multidimensional data to be represented in 2-dimensional screen space, or the problem of visualizing millions of items in a single view, just to cite a few of them. Probably the most important goal is to bring the advantages and latest developments of research to practical, realistic settings to address timely problems. Several visualization tools have been developed recently, but little effort has been made to evaluate the effectiveness and utility of the tools in realistic conditions with users. Very few works perform a usability study or an empirical evaluation on what they have proposed [16]. There has been a noticeable lack of involving the actual users in the design and evaluation of information visualization tools. Most visualization projects focus on the development of innovative visualizations or computing techniques rather than address the users’ needs and usage aspects. This is reflected by the fact the most of the projects have remained as research prototype, without any follow up, and have rarely been deployed in real-life systems. There is the need to develop new evaluative methodologies specific for information visualization, as most of the existing evaluation studies rely on empirical methodologies derived from HCI, that might not be applicable to information visualization. For instance, a key point on visualization is to understand whether users can comprehend the meaning of the underlying data encoded with graphical elements and properties. This involves understanding perceptual-cognitive tasks [17], which is very hard to judge, if compared to classic HCI evaluation metrologies such as task completion time or heuristics.
5
The Swiss Perspective
There are various research groups and companies in Switzerland working in the domains of visualization. In this section we present the most active ones in the fields of information visualization, knowledge visualization and in scientific visualization. This presentation does not intend to be exhaustive, but a snapshot of representative Swiss activities in these fields. Later in the section, we briefly present recent and representative projects in Switzerland and finally introduce the visualization projects presented in details in chapters of this book.
15
5.1
Information Visualization
In the field of information visualization, research in Switzerland is tackling diverse aspects such as software visualization and education, monitoring and decision making in security, preferences elicitation in electronic catalogues, critiques based system and constraint programming, and visual analytics for humanitarian data. The REVEAL (Reverse Engineering, Visualization, Evolution Analysis Lab) research group at the University of Lugano is involved in in software reengineering, reverse engineering, and software evolution with an emphasis on software visualization and metrics. Its leader is also the creator of CodeCrawler, a language independent software visualization tool [19]. Still at the University of Lugano, the faculty of Communication Sciences is developing projects in information visualization (empirical evaluations, personalization) in the field of student modeling and external graphical representations in distance education [20]. At the University of Fribourg, the DIVA group has extended its research activities towards multimodal interaction and information visualization [21, 22], with several projects on information visualization. In particular, they recently started the SNF project Humanitics, ”Humanitics: Visual Analytics for All”, which goal is to develop visual analytics tools for public organizations to enhance collaborative knowledge discovery, information exchange and communication. This project is a collaboration with the United Nations in Geneva, which manipulates and reports numerous data and information concerning world-wide health, illicit drug trade, environment and global climate change, diseases, energy, conflict, and humanitarian development concerns. The UN urgently needs authoring tools to analyse these data and cross correlate them in a visual way, not only to improve visual understanding, but also for analysts to produce meaningful visualizations to present their findings. Further, in the framework of the EC FP7, the University of Fribourg participates to the coordination action VISMASTER, composed of 26 partners, which aims at defining the European Visual Analytics Research Roadmap, and setting the stage for larger follow-up Visual Analytics research initiatives in Europe. The Human Computer Interaction Group, at the Swiss Federal Institute of Technology in Lausanne, is concerned with the human factors of computing systems. The research group examines issues in the common area of human-machine interaction, artificial intelligence, cognitive science, and information visualization. In particular, the group is well known for its mixed initiative approach to online product search [23]. At the United Nations Office at Geneva, the Centre for Advanced Visual Analytics (CAVA) is dedicated to supporting humanitarian and development organizations in applying innovative methods of analysis and presentation of information. The Centre offers services, tools, and training based on the disciplines of information visualization and visual analytics. Finally, Macrofocus GmbH, located in Zurich, develops interactive visualization systems that enable faster and better-informed decisions, and support the
16
generation and communication of knowledge. InfoScope is their general-purpose interactive visualization tool to access, explore, and communicate large and complex multi-dimensional datasets [24]. Macrofocus develops other products for hierarchical data and surveys, and other interactive visual tools for budgets, projects, products, documents and other structured data sets. 5.2
Geographic Information Systems
In the field of geographic information systems, which combines information visualization and scientific visualization techniques, the Geographic Information Analysis & Visualization (GIVA) and Geographic Information Systems (GIS) groups at the GIScience Center of the Department of Geography at the University of Zurich have a well established expertise in the full range of scientific projects from those contributing to fundamental theory in GIScience through applied projects in the social and natural sciences to technology transfer working directly with industrial partners [25]. While the GIS division concentrates on spatial theory, algorithms and tool developments including application of computational methods for representing spatio-temporal phenomena, the GIVA group emphasizes on basic research questions within the domain of perceptual and cognitive principles of geovisual analytics. Specific research domains include geovisual analytics display design (2-4D displays) and empirical evaluations (i.e., with eye tracking studies), mobile geovisualization design and evaluation, spatialization, cognitive and perceptual aspects of visual analytics and spatial inference making, spatiotemporal analysis of moving objects, geographic information retrieval, and scaling issues and multi-representation databases. 5.3
Scientific Visualization
In the field of scientific visualization, there are many active groups in Switzerland and it would be hard building an exhaustive list. For instance, the Computer Graphics Laboratory, ETH Zurich, is devoted to the design of fundamental methods, algorithms and systems for computer graphics, geometric modeling, physics-based animation, image acquisition and generation, display, scientific visualization, and multimodal learning [26]. Another active group at the ETHZ is the Computer Vision Laboratory, which works on the computer-based interpretation of 2D and 3D image data sets from conventional and non-conventional image sources. The computer vision lab performs research in the fields of medical image analysis and visualization, object recognition, gesture analysis, tracking, and scene understanding and modeling [27]. At the department of Informatics of the University of Zurich, the Visualization and MultiMedia Lab (VMML) covers also a wide range of topics in real-time 3D computer graphics, simulation, interactive large-scale scientific visualization and multimedia technology [28]. Finally, it is worth mentioning the Swiss National Supercomputing Centre (CSCS) develops and promotes technical and scientific services for the Swiss research community in the fields of high-performance computing. One of the related goals of the CSCS is to provide researchers with advanced visualization
17
expertise in fields such as molecular dynamics, material sciences, computational fluid dynamics, structural mechanics, etc. 5.4
Knowledge Visualization
In the field of knowledge visualization, the Competence Center Knowledge Visualization at the Institute for Media and Communications Management, as well as the affiliated vasp datatecture GmbH, a company that focuses in visualizing business strategy and processes, propose guidelines and principles derived from their professional practice and previous research on how architects successfully use complementary visualizations to transfer and create knowledge among individuals from different social, cultural, and educational backgrounds [29]. The faculty of Communication of the University of Lugano is also conducting research in this new field and in particular on knowledge management, knowledge visualization, and knowledge communication [30]. 5.5
Visualization in the MMI program
Chapters 7, 8 and 9 of this book present projects related to information and scientific visualization domains. While the paper 7 manipulates abstract information and as such follows the standard definition of information visualization, the two other papers tackle HCI issues related with browsing and interaction in scientific visualizations. The chapter entitled ”Evospaces: Multi-dimensional Navigation Spaces for Software Evolution”, approaches software visualization through an original angle, representing abstract information with realistic metaphors (e.g. a city map), in order to capture rapidly the architecture, history or morphology. Furthermore, this metaphoric approach transports social aspects facilitating inter-communication between people, facilitating the collaborative development of a software, and to some extent to the creation of a city. The following chapter, entitled ”HOVISSE - A medical Virtual Reality Research Project”, could have been presented also in the multimodal interfaces section, since it uses haptic interfaces as a return path, to help the medical practitioners ”feel” the virtual world in which they are immersed. Finally, the BATICS project presents a language and a methodology for prototyping 3D user interfaces for controlling complex systems. As such, it explores the possibility to build 3D graphical user interface authoring tools, in the domain of complex systems control. Although the project tackles software engineering issues, this contribution is very valuable for those who want to build novel 3D user interfaces in the field of scientific visualization.
6
Summary and Outlook
Interactive visualization has matured, as witnessed by the fact that application papers start to be accepted at conferences, commercial tools are being offered on the market, and the field is widening its focus.
18
Visual Analytics (VA) for example is a new approach that combines visualization and automated data analysis techniques. It has been defined as the science of analytical reasoning facilitated by interactive visual interfaces [31, 32]. The novelty of the approach, as opposed to other data analysis domains, is to adopt a holistic view where information visualization, data analysis, and human factors all work together to build something that is greater than the sum of the parts. For instance, in visual analytics it is recognized that data mining algorithms alone are not enough. Without expressive visualizations and interfaces it is hard to achieve the necessary flexibility to understand results, generate new hypotheses, and test them on the fly in a natural interactive environment. Similarly, it is recognized that given the limited power of graphics displays, and the intrinsic limitations of human perception and reasoning capabilities, it is infeasible to consider visualization alone an effective solution to the analysis of complex and large data sets. A specific visual analytics conference, named IEEE Symposium on Visual Analytics Science and Technology, has also been created in 2006 to promote research in this domain. Another trend is that visualization is moving off the desktop, on to devices that have widely different form factors and are used in different contexts than a single user in an office with a standard desktop monitor. Megapixel displays, in the form of tiled monitors or entire rear-projected walls, are becoming more popular in an attempt to visualize the increasingly large datasets at full resolution, for example from terascale scientific simulations [33]. Large display sizes not only increase the number of available pixels, but also enable new forms of presentation and collaboration. At the other end of the spectrum, smartphones are now equipped with highquality touch-sensitive displays that provide excellent platforms for visualization of information in mobile contexts. Or, visualization disappears completely into the environment in an approach called ambient visualization, where everyday objects such as lamps or wall-hung art become dynamic information displays. Visualization is not in the center of the attention, but takes place in the periphery. Ambient visualizations can be aimed at personal use to create awareness of some source of information [34], or they are designed for public spaces, for example bus schedules [35]. The idea is to localize time-critical or otherwise important information in the space where it is actually needed, and provide it in a way that it can be quickly grasped, even from a distance. This creates new design challenges that differ from those used to design traditional focused-use desktop systems. For example, since these displays are highly visible, one of the design concerns is to balance aesthetics and utility. Recently, a new report for the U.S. National Science Foundation and the U.S. National Institutes of Health has been put together by luminaries of the field [36], to evaluate the progress of the maturing field of visualization. The report concludes:
19
Visualization is indispensable to the solution of complex problems in every sector, from traditional medical, science and engineering domains to such key areas as financial markets, national security, and public health. One problem however is the fact that as techniques mature, there is an increasing need to push them out into the applications, but the necessary domain knowledge is typically missing in the visualization community. On the other hand, due to the multidisciplinary nature of the field, it is often difficult to obtain the necessary focused funding for core visualization research, of which the report highlights the following: Characterizing how and why visualizations work, systematically exploring the design space of visual representations, developing new interaction approaches, and exploiting the possibilities of novel display hardware will be particularly important areas of emphasis.
References 1. Johnson, S.: Interface culture. Harper, New York, (1997) 2. Yi, J. S., Kang, Y. a., Stasko, J., Jacko, J.: Toward a deeper understanding of the role of interaction in information visualization. IEEE Transactions on Visualization and Computer Graphics, 13, 6, 1224–1231 (2007) 3. Shneiderman, B.: Designing the user interface. Addison-Wesley, (1998) 4. McCormick, B., DeFanti, T.A., Brown, M.D.: Visualization in scientific computing. In Computer Graphics, volume 21. ACM Press, (1987) 5. Schroeder, W., Martin, K., Lorensen, B.: The Visualization Toolkit: An ObjectOriented Approach to 3D Graphics, 4th Edition. Kitware, Inc., Clifton Park, NY, (2006) 6. Johnson, Ch., Hansen, Ch.: Visualization Handbook. Academic Press, Inc., Orlando, FL, USA, (2004) 7. Spitzer, V., Whitlock, D.: Atlas of the Visible Human Male: Reverse Engineering of the Human Body. Jones and Bartlett Publishers, Inc., USA, (1998) 8. Card, S., Mackinlay, J., Shneiderman, B.: Readings in information visualization. Morgan Stanley Publishers, San Francisco, (1999) 9. Tufte, E.: The visual display of quantitative information. Graphics Press, Cheshire, Connecticut, (1983) 10. Rosling, H., Rosling, A., Rosling, O.: New software brings statistics beyond the eye. In Statistics, Knowledge and Policy: Key Indicators to Inform Decision Making, OECD Publishing, Paris, France, 522–530 (2006) 11. Bertin J.: Graphics and graphic information processing. Walter de Gruyter, Berlin, (1981) 12. Cook, K., Earnshaw R., Stasko. J.: Discovering the unexpected. IEEE Computer Graphics and Applications, 27, 5, 15–19 (2007) 13. Chaomei, Ch.: Information visualization: Beyond the horizon. Springer (2nd ed.), (2004) 14. Karahalios, K. G., Vigas, F. B.: Social visualization: exploring text, audio, and video interaction. In CHI ’06 Extended Abstracts on Human Factors in Computing Systems CHI ’06, ACM, New York, NY, 1667–1670 (2006)
20 15. Donath, J., Karahalios, K., Viegas, F. B.: Visualizing conversation. Proceedings of the 32nd Annual Hawaii International Conference on System Sciences, HICSS-32, 2, (1999) 16. Plaisant, C.: The challenge of information visualization evaluation. Proceedings of the Working Conference on Advanced Visual Interfaces (AVI04). 109–116 (2004) 17. Chen, Ch.: Top 10 unsolved information visualization problems. IEEE Computer Graphics and Applications, 25, 4, 12–16 (2005) 18. Spence, R.: Information visualisation, Design for interaction. Pearson Education Ltd, (2007) 19. Lanza, M., Ducasse, S.: Codecrawler-an extensible and language independent 2d and 3d software visualization tool. Tools for Software Maintenance and Reengineering, RCOST/Software Technology Series, 74–94 (2005) 20. Mazza, R., Dimitrova, V.: Visualising student tracking data to support instructors in web-based distance education. Proceedings of the 13th International World Wide Web Conference on Alternate Track Papers & Posters, ACM New York, NY, USA, 154–161 (2004) 21. Bertini, E., Hertzog, P., Lalanne, D.: SpiralView: Towards Security Policies Assessment through Visual Correlation of Network Resources with Evolution of Alarms. IEEE Symposium on Visual Analytics Science and Technology, VAST 2007, 139– 146 (2007) 22. Lalanne, D., Bertini, E., Hertzog, P., Bados, P.: Visual Analysis of Corporate Network Intelligence: Abstracting and Reasoning on Yesterdays for Acting Today. Proceedings of the Workshop on Visualization for Computer Security, VizSec 2007, Book Series, Mathematics and Visualization, Goodall, John R.; Conti, Gregory; Ma, Kwan-Liu (Eds.), 115–130 (2008) 23. Pu, P.,Faltings, B.: Enriching buyers’ experiences: the SmartClient approach. Proceedings of the SIGCHI Conference on Human Factors in Computing Systems, ACM New York, NY, USA, 289–296 (2000) 24. Brodbeck, D., Girardin, L.: Design study: Using multiple coordinated views to analyze geo-referenced high-dimensional datasets. Proceedings of International Conference on Coordinated and Multiple Views in Exploratory Visualization 2003, 104–111 (2003) 25. Skupin, A., Fabrikant, S. I.: Spatialization methods: A cartographic research agenda for non-geographic information visualization. Cartography and Geographic Information Science, 30, 2, 99–119 (2003) 26. Pfister, H., Zwicker, M., van Baar, J., Gross, M.: Surfels: Surface elements as rendering primitives. Proceedings of the 27th Annual Conference on Computer Graphics and Interactive Techniques, ACM Press/Addison-Wesley Publishing Co., New York, NY, USA, 335–342 (2000) 27. Harders, M., Wildermuth, S., Szkely, G.: New paradigms for interactive 3D volume segmentation. The Journal of Visualization and Computer Animation, 13, 1, 85-95 (2002) 28. Pajarola, R.,Sainz, M.,Guidotti, P.: Confetti: Object-Space Point Blending and Splatting. IEEE Transactions on Visualization and Computer Graphics, 10, 5, 598–608 (2004) 29. Burkhard, R. A.: Towards a framework and a model for knowledge visualization: Synergies between information and knowledge visualization. Lecture Notes in Computer Science, Springer, 3426, 238 (2005) 30. Eppler, M.J.: Facilitating knowledge communication through joint interactive visualization. Journal of Universal Computer Science, 10, 6, 683–690 (2004)
21 31. Thomas, J. J., Cook, K. A.: Illuminating the path: The research and development agenda for visual analytics. IEEE CS Press, (2005) 32. Thomas, J. J., Cook, K. A.: A visual analytics agenda. IEEE Computer Graphics and Applications, IEEE Computer Society, 10–13 (2006) 33. Schikore, D. R., Fischer, R. A., Frank, R., Gaunt, R., Hobson, J., Whitlock, B.: High-resolution multiprojector display walls. IEEE Comput. Graph. Appl. 20, 4, 38–44 (2000) 34. Miller, T., Stasko, J.: Artistically conveying information with the InfoCanvas. In Proceedings of AVI 2002, 43–50 (2002) 35. Skog, T., Ljungblad, S., Holmquist, L.E.: Between aesthetics and utility: Designing ambient information visualization. In Proceedings of the IEEE Symposium on Information Visualization, 239–240 (2003) 36. Munzner, T., Johnson, C., Moorhead, R., Pfister, H., Rheingans, P., Yoo, T.S.: NIH-NSF Visualization research challenges report. IEEE Press, (2006)