Technology Analysis & Strategic Management, Vol. 11, No. 4, 1999
A Taxonomy of Industries Based on Knowledge Flow Structure
YONG-TAE PARK & MOON-SOO KIM
A BSTRACT With the advent of the knowledge-based economy, the inter-industrial ow of technological knowledge is reckoned as the principal determinant of national competitiveness. The mode of knowledge ows, however, is intractably complex. Taking it as a network, this paper aims at providing an inductive taxonomy of industries based on the knowledge ow structure and thus identifying the user–supplier relationship among industries in terms of knowledge diffusion. Some proxy indexes are developed rst to measure the knowledge ows, then the interactive mechanism among industries is investigated by the network analysis and eventually a taxonomy of industries is presented according to the characteristics of respective industries. The taxonomic approach highlights the importance of inter-industrial knowledge management system that facilitates knowledge ows across industries based on the idiosyncratic features of respective industries. Introduction With the advent of the knowledge-based economy, the notion of national systems of innovation becomes highlighted in the arena of policy practice and innovation research.1 The notion premises that technological knowledge be created, accumulated and disseminated through the interactive learning among principal actors in national system. In particular, the ow of technological knowledge across industries is reckoned as the principal determinant of national competitiveness. The mode of knowledge ows across industries, however, is intractably complex. It collectively constitutes a network in which various nodes release, absorb or intermediate technological knowledge. In dealing with diverse objects with multiple dimensionality, taxonomic approaches are often adopted to construct a building block for ensuing analyses. Among others, the inter-industrial knowledge linkage accounts for an important dimension of classi cation. Let alone the formal standard industry classi cation(SIC), probably the most well-known classi cation scheme is due to Pavitt.2 He proposes a taxonomy in which rms are clustered in terms of sources of technology, types of user, means of appropriation and rm size to form such distinct categories as supplier-dominated, scale-intensive, specialized-suppliers and science-based industries. Malerba3 dichotomizes rms into basic component and system industry and system application industry according to competitive edges, organizational strategy and government policy. Yong-Tae Park is an Assistant Professor at the Department of Industrial Engineering, School of Engineering, Seoul National University, San 56–1, Shillim-Dong, Kwanak-Gu, Seoul 151–742, Korea; Tel: 82–2–880–8358; Fax: 82–2–889–8560; E-mail:pk
[email protected] l . Moon-Soo Kim is a senior researcher at the Electronic and Telecommunications Research Institute (ETRI), Taejon, Korea. The authors thank the editor and anonymous referees for valuable comments that helped to improve this article. ISSN 1465-399 0 online/ISSN 0953-7325 /99/040541-09
Ó
1999 Taylor & Francis Ltd.
542
Y.-T. Park & M.-S. Kim
In fact, these schemes represent the empiricism of such conceptual notions as paradigm,4 trajectory5 or guidepost6 that contrast the sector-speci c pattern of innovation across industries. The validity and utility of these schemes, albeit meaningful, is limited in that they may highlight the idiosyncratic features of respective industries but may not identify the interactive relationship among industries. In the knowledgebased economy, it is more important to understand the inter-industry linkage structure among industries, rather than to understand the individual characteristics of respective industries. Along this line, this paper aims at providing an inductive taxonomy of industries based on the knowledge ow structure and thus identifying the user–supplier relationship among industries in terms of knowledge diffusion. Intuitively, in the course of economic development and industrial sophistication, some industries may generate (out ow) knowledge whereas others may use (in ow) or intermediate (in-between) knowledge. We will rst develop some proxy indexes that can measure the knowledge ows, then investigate the interactive mechanism among industries by the network analysis and eventually present a taxonomy of industries according to the characteristics of respective industries. Types of Knowledge Flow and Network Analysis Measuring Knowledge
We measure the knowledge, as a proxy, by the number of researchers. That is, it is assumed that the more researchers in an industry, the larger technological knowledge in it. This knowledge measure is represented as knowledge matrix H , whose diagonal hii denotes total amount of knowledge in ith industry and off-diagonal hij is zero. Two Major Types of Knowledge Flow
By and large, the ow of knowledge takes place through two major channels, disembodied and embodied one. The former is the process whereby technological knowledge spreads through human mobility and research spillovers across industries. Due to intrinsic dif culty of measurement, we use the technological similarity matrix S, as a proxy, to measure the inter-industrial disembodied knowledge ow. The matrix is de ned as follows whose element sij is measured in a similar way to Jaffe7 S5
[sij] where, sij 5 Ï
Fi FTj (FiFTi )(FjF Tj )
Row vector Fi indicates the number of researchers with their academic elds (30 majors with subscript k) and 3-degree types (PhD, master, bachelor with subscript l ) in i th industry: Fi 5
[ fikl ]
Instead of arbitrarily assigning different weights, all degree types are weighted equally. Combining H and S , the disembodied knowledge ow matrix K D is constructed: KD 5
H 3
S5
[k dij]
The embodied channel, on the other hand, is the process whereby knowledge is disseminated through the purchase of machinery, equipment and components incorporating new technology. In this process, some industries act as suppliers or sellers of
Taxonomy of Industries
543
intermediate and capital goods whereas other industries act as users or buyers, both constituting a technology diffusion network. The embodied knowledge ows across industries are measured, again as a proxy, based on the coef cients of the Leontief inverse.8 The coef cient embraces both direct ow (from industry i to industry j ) and indirect ow (from industry i to industry j via industry k). Thus, a transformation matrix T is constructed where X means diagonal matrix of industrial output, [I 2 A d] 2 1 denotes domestic Leontief inverse and D indicates diagonal matrix of nal demand: T5
[I 2
X2
A d] 2
1
1
D
Combining H and T , the embodied knowledge ow matrix K E is obtained: KE 5
H 3
T5
[k eij]
The proxy measures proposed here are subject to some limitations since the inter-industrial distribution of technical personnel and the values in the input–output table may encompass other factors than technological knowledge embodiment. Granting that, they are considered to be comprehensive and representative enough to re ect the knowledge ows across industries and similar measures were often employed by previous research.9 Network Analysis
In general, the interactive relationship among actors can be portrayed as a network.10 Network analysis, a quantitative technique derived from graph theory, facilitates the analysis of interactions (edges) between entities (nodes). The above knowledge matrix K can be easily converted into the network G v (N , L, V) where N , L, V indicate industries, inter-industrial ow relations and inter-industrial ow amount, respectively. However, the graph becomes intractably complex as the number of nodes increases. Hence, excluding negligible relations from further analysis, G V is transformed into a dichotomized graph G D by using cut-off values: Gv Þ
G D(N , L D),
where, L D 5 and,
{l dij}
l dij 5
1 for vij .
cutoff
l 5
0 for vij #
cutoff, "
d ij
i, j 5
1,2, … g
Then, the overall connectivity of network is measured based on the density of network: D5
ld g( g 2
1)
, where l d 5
O O i
l dij j
Here, g means the total number of nodes (industries), denominator indicates the maximum number of connections between nodes and numerator denotes the actual number of connections. Therefore the inter-industrial linkage of network increases as density increases. Empirical Analysis Empirical Data
The set of empirical data covers manufacturing sector of Korea during 1980s. The reference period is of particular importance in the chronology of Korea in that industrial base reached the critical mass to embark on indigenous private R&D. Hence, it is
544
Y.-T. Park & M.-S. Kim Table 1. The selected list of 34 manufacturing industries Number 1 2 3 4 5
Industry
Number
Industry
18 19 20 21 22
Ferrous Metals Nonferrous Metals Fabricated Metal Products Boilers and Turbines Special Industrial Machinery
6 7
Food and Beverages Textile Wood and Furniture Paper and Printing Industrial Organic and Inorganic Chemicals Dyes and Paint Agricultural Chemicals
23 24
8 9
Pharmaceuticals Toiletry and Cleansers
25 26
10
Other Chemical Products (explosives, adhesives)
27
11
Petroleum Extraction and Re ning Mining
28
Rubber Products Plastic Products Porcelain and Earthenware Glass Products
30 31 32
Cement, Stone and Clay Products
34
Fabrication Machinery Computer and Of ce Equipment Other Machinery Industrial Electrical Equipment Video, Audio and Telecommunication Equipment Household Electrical Equipment Semi-Conductor and Electronic Components Other Electrical Equipment Shipbuilding Motor Vehicles and Equipment Other Transportation Equipment Precision Equipment (measuring and medical instruments, photo equipment, and timepieces)
12 13 14 15 16 17
29
33
assessed that both disembodied and embodied ow channels were constructed and operated during 1980s to form a genuine inter-industrial knowledge network. For the disembodied knowledge ow matrices, the annuals, from 1982 to 1991, of the Korea Industrial Technology Association (KITA) are used.11 The database includes R&D workforce of private rms with their academic elds and degree types. For the embodied knowledge ow matrices, the input–output tables of the Korea Bank during the same period are adopted.12 In total, 34 manufacturing industries are included, as displayed in Table 1. Taxonomy of Industries General Trend
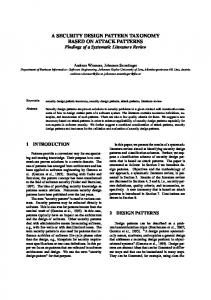
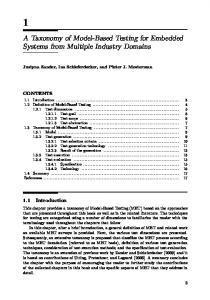
The overall connectivity among industries can be measured by the degree of density. As exhibited in Figure 1, density of disembodied network has steadily increased irrespective of cutoff values throughout 1980s. The case of embodied knowledge network shows similar pattern of evolution. As portrayed in Figure 2, there appeared a sharp increase from 1983 to 1987, followed by gradual growth afterwards. This fact con rms the hypothetical rule of evolution that the connectivity among industries be strengthened over time to form a more structured network, as industries require both internal knowledge and external knowledge during the course of develop-
Taxonomy of Industries
545
Figure 1. Density of disembodied knowledge ow. ment. The result also provides the validity and feasibility of classi cation since taxonomic clusters become discernible as the density increases. Inow–Outow Position Map
As the overall connectivity of network is enhanced, inter-industrial linkages become more visible. The visibility, however, depends on the cut-off value adopted. Thus, instead of selecting a particular cut-off value, we simply measure the knowledge ow amounts of each industry for both disembodied and embodied cases. Then, taking the industry averages as center lines, each industry can be located in a two-dimensional map either
Figure 2. Density of embodied knowledge ow.
546
Y.-T. Park & M.-S. Kim
Figure 3. Knowledge in ow position map. as high (above average) or low (below average). To illustrate, if a particular industry absorbs more disembodied knowledge than the overall average, it is classi ed as ‘high’ in terms of disembodied-in ow dimension. By doing so, the following in ow–out ow position maps, Figure 3 and 4, can be created. Note that some outlying industries are not plotted in the maps. Taxonomy of Industries
In order to apply a statistical clustering algorithm, the dissimilarities of industries in the position matrix are required to be quanti ed. However, it is very dif cult to identify the exact address of respective industries by numerical description. Thus, taxonomic clusters are contrasted in a qualitative manner. For each cluster, af liated industries are assessed in a qualitative scale, either high or low depending on the relative level of knowledge in ow or out ow amounts. By doing so, we end up with the following ten clusters: The industries in this sector are characterized by high degree of out ow in terms of both disembodied and embodied knowledge and, 1. Both outow and disembodied-inow sector.
Taxonomy of Industries
547
Figure 4. Knowledge out ow position map.
simultaneously, high degree of disembodied knowledge in ow. The af liated industries include chemicals (5), industrial electrical equipment (26) and precision equipment (34).
The industries in this sector are characterized by high degree of in ow with respect to both disembodied and embodied knowledge and, simultaneously, high degree of disembodied knowledge out ow. The af liated industries include household electrical equipment (28), semi-conductor and electronic components (29) and motor vehicles and equipment (32). 2. Both inow and disembodied-outow sector.
The industries in this sector are characterized by high degree of in ow in terms of both disembodied and embodied knowledge but low degree of knowledge out ow. Hence, this sector mainly absorbs knowledge from external industries without providing internal knowledge to other sectors. Such industries as fabricated metal products (20) and other machinery (25) belong to this sector. 3. Both inow and no-outow sector.
548
Y.-T. Park & M.-S. Kim
The industries in this sector are characterized by high degree of disembodied knowledge ow, both in ow and out ow, but low degree of embodied knowledge ow. The af liated industries include special industrial machinery (22) and telecommunications equipment (27). 4. Disembodied-ow sector.
The industries in this sector are characterized by high degree of out ow in terms of disembodied knowledge and high degree of in ow with respect to embodied knowledge. The textile industry (2) belongs to this category. 5. Disembodied-outow and embodied-inow sector.
The industries in this sector are characterized by high degree of out ow in terms of embodied knowledge. Other knowledge ows, however, are not active. The af liated industries include dyes and paint (6), explosives and adhesives (10), rubber products (13) and glass products (16). 6. Embodied-outow sector.
The industries in this sector are characterized by high degree of disembodied knowledge out ow. However, other knowledge ows are not notable. The af liated industries include pharmaceuticals (8), plastic products (14), nonferrous metals (19), fabrication machine (23), computers and of ce equipment (24), other electrical equipment (30) and other transportation equipment (33). 7. Disembodied-outow sector.
The industries in this sector are characterized by high degree of disembodied knowledge in ow. The af liated industries include boilers and turbines (21) and shipbuilding (31). 8. Disembodied-inow sector.
The industries in this sector are characterized by high degree of embodied knowledge in ow. The food and beverage industry (1) corresponds to this category. 9. Embodied-inow sector.
The industries in this sector are disconnected or very loosely connected with other industries in terms of knowledge ow. Such industries as wood and furniture (3), paper and printing (4), agricultural chemicals (7), toiletry and cleansers (9), petroleum extraction and re ning (11), mining (12), porcelain and earthenware (15), cement and stone and clay products (17) and ferrous metal (18) are included in this category. 10. Knowledge-isolated sector.
Conclusion The emerging economic and social paradigm rests on the two underlying notions of knowledge and network. Inter-industrial linkages are expanded and intensi ed due to technological knowledge ows, both disembodied and embodied, and the interconnected structure as a whole forms a complex network. The analysis of this network is a necessary but dif cult task. In the spirit of exploration, we adopt the network theory and develop a new taxonomic framework of industries based on the role of respective industries in terms of knowledge ows. The taxonomy is distinct from conventional ones in that it highlights the idiosyncratic features of respective industries not only from the sectorspeci c view but also from network-related view. This dual perspective is the main advantage of the new taxonomy over the existing classi cations. Various industries are located on the in ow–out ow and disembodied–embodied position maps and ten
Taxonomy of Industries
549
discernable clusters are identi ed according to the relative standings on the maps. Each cluster, then, represents distinctive position in the inter-industrial knowledge network. The taxonomy renders some important policy implications. First, it is required to monitor the changing trend of knowledge ows across industries and construct the optimal structure of national knowledge systems accordingly. The structural changes then should be dynamically addressed in industrial policy. Educational institutes and labor market also should be maneuverable enough to respond to the changing trend. Second, industry-speci c policy measures should be applied depending on the nature of respective industries. Some industries may need to reinforce productive capacity whereas others need to enhance absorptive capability. Intermediary sectors need to be armed with facilitating and catalyzing vehicles. This paper is rather seminal and subject to some limitations. First, the taxonomy proposed here per se is period-speci c. It merely re ects an evolutionary snapshot of the reference period, and thus must be interpreted so. The clusters may be reshuf ed if different periods are adopted. Second, in the similar vein, the taxonomy is countryspeci c. It depends on the development stage and industrial structure of a particular country. Third, the proxy measures employed may re ect other factors than technological knowledge ow. These limitations, however, by no means hamper the validity and utility of the research since the purpose of this paper is not to provide a generic taxonomic scheme but to suggest an analytical framework that is universally applicable regardless of speci c pro les. Notes and References 1.
2. 3. 4.
5. 6. 7. 8. 9.
10.
11. 12.
B-A. Lundvall, National Systems of Innovation—Towards a Theory of Innovation and Interactive Learning (London, Pinter, 1992); R. Nelson (Ed.), National Innovation System (Oxford, Oxford University Press, 1993). K. Pavitt, ‘Sectoral Patterns of Technical Change: Towards a Taxonomy and a Theory’, Research Policy , 13 , 1984, pp. 343–373. F. Malerba, ‘The Organization of the Innovative Process’, in: N. Rosenberg, R. Landau & D. Mowery (Eds), Technology and the Wealth of Nations (Stanford University Press, 1992). T. Kuhn, The Structure of Scienti c Revolutions (Chicago, University of Chicago Press, 1970); G. Dosi, ‘Technological Paradigms and Technological Trajectories: A Suggested Interpretation of the Determinants and Directions of Technical Change’, Research Policy, 2 (3), 1982, pp. 147–162; C. Freeman & C. Perez, ‘Structural Crises of Adjustment: Business Cycles and Investment Behavior’, in: G. Dosi (Ed), Technical Change and Economic Theory (London, Printer, 1988). Dosi, ibid. D. Sahal, ‘Technological Guideposts and Innovation Avenues’, Research Policy, 14 , 1985, pp. 61–82. A Jaffe, ‘Technological Opportunity and Spillovers of R&D: Evidence from Firms’ Patents, Por ts, and Market Value’, American Economic Review , 76 (55), 1986, pp. 984–1001. P. Mohnen, ‘R&D Externality and Productivity Growth’, STI Review , 7, 1996, pp. 39–66. Ibid. ; R. Leoncini, M. Maggioni & S. Montressor, ‘Intersectorial Innovation Flows and National Technological System Network Analysis for Comparing Italy and Germany’, Research Policy, 25 , 1996 pp. 415–430; A. Goto & K. Suzuki, ‘R&D Capital, Rate of Return on R&D Investment and Spillover of R&D in Japanese Manufacturing Industries’, The Review of Economics and Statistics, 71 (4), 1989, pp. 555–564. L. Gelsing, ‘Innovation and the Development of Industrial Networks’, in: B-A. Lundvall (Ed.), National Systems of Innovation-Towards a Theory of Innovation and Interactive Learning (London, Pinter, 1992). Korea Industrial Technology Association, Survey on Industrial Technological Development of Korea (Annuals from 1982 to 1991). Korea Bank, (1983, 1987, 1990).