ROPEC 2015 - Computer Vision and Scene Understanding
A Texture Based Image Processing Algorithm for Nanoparticles Analysis Diego S. Benitez Universidad San Francisco de Quito USFQ Colegio de Ciencias e Ingenierfas "El Politecnico" Campus Cumbaya, Casilla Postal 17-1200-841 Quito, Ecuador
[email protected]
Alexis Debut, Luis Cumbal Centro de Nanociencia y Nanotecnologia Universidad de las Fuerzas Armadas ESPE Av. Gral. Rumifiahui sin, P.o. BOX 171-5-231B, Sangolqui, Ecuador {apdebut, Ihcumbal}@espe.edu.ec
Abstract-This paper describes an algorithm based on the two-dimensional characterizing
Hurst texture
operator and
for
detecting
distribution
edges
information
and in
nanoparticle images obtained using a Transmission Electron Microscope. Results using this technique are shown for several types of nanoparticles
including nearly spherical and more
irregularly shaped nanoparticles. The results obtained suggest good performance; with further refinements the algorithm may provide a useful tool for nanoparticle research.
Keywords- Texture Analysis; Hurst-operator; Edge-detection; Nanoparticles; Image processing
I.
INTRODUCTION
Nanoparticle research is nowadays an area of intense scientific research, due to a wide variety of potential applications including: biomedical, optical, and in the electronic field. Using nanotechnology, it is possible to manipulate the size, morphology and composition of a particle to produce materials of different properties. However, in order to understand nanoparticles properties, it is necessary to know their size, shape and distribution for the adequate interpretation of experimental results [1]. Although, there are commercially available or free software packages, for example Digimizer [2], that allow users to manually track and measure nanoparticles on an individual basis, an automated method is still needed for accurate and robust estimation of particle measure and distribution, especially for images containing thousands of individual nanoparticles. To measure the size or the roughness of a nanoparticle, it is necessary to first identify its edges correctly. Furthermore, the edge detector to use must be able to detect weak edges and should have good noise immunity. In this paper, we describe a new image-processing algorithm, based on the local two dimensional Hurst operator, to improve image quality and better define the edges of the nanoparticle for later size measurement. Despite the fact that several image processing techniques are available for detecting edges in gray scale images, like for example: mask based gradient operators (e.g. Sobel operator), Gaussian and Laplacian operators, direction sensitivity methods, etc. [3], nevertheless, these methods often result in some drawback like the broken edges which leads to loss of information [4]. Furthermore, these techniques may not work properly for nanoparticie analysis, essentially because the majority of images obtained by Transmission Electron Microscopy (TEM) usually have poor contrast, mainly coming
from imperfections in the material of the structure used for supporting the nanoparticle sample. Therefore, the edge detector to use should be able to detect weak edges. Additionally, since in many cases several materials can be forming the nanoparticle, a texture sensitive detector, capable of characterize the surface roughness [5], may help with the correct identification of each structure and to assist with the separation of the components. In the past, a two-dimensional range-based neighborhood operator based on a "local Hurst operator", an efficient method for computing the fractal dimension on surfaces [5], has been implemented and successfully used for mammograms analysis in [6] and [7], this operator extracts both the edge and texture information from an image in one operation. The algorithm presented in this paper is an improved version of an early algorithm for image segmentation and analysis previously presented in [8]. II.
IMAGE PROCESSING ALGORITHM
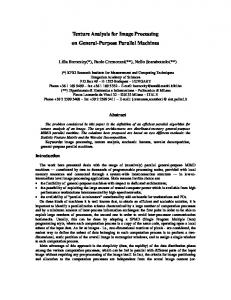
Fig. 1 shows the block diagram of the image-processing algorithm implemented. First, a de-noising stage is applied to the original image to improve quality. Noise reduction can be achieved by either using a smoothing median filter as described in [8] or by employing wavelet transforms for de-noising [9] as in this improved version of the algorithm. Thresholding is then applied to the image, the optimal threshold value for the image was found using a moment-preserving method [10] since as mentioned before nanoparticles images usually have poor contrast. Isolated pixels (small particles) are then eliminated from the image using a particle detection algorithm; the default number of pixels used to determine membership is 8 pixels.
Interpolation Intercept Image
Fig. 1.
Block diagram of the image-processing algorithm.
Work financially supported by Universidad de las Fuerzas Armadas ESPE under Research Grant No. 2014-PIT-013. 978-1-4673-7121-6/15/$31.00 ©2015 IEEE
ROPEC 2015 - Computer Vision and Scene Understanding
The image obtained is then processed using the two dimensional Hurst operator as follows: 1. 2. 3.
4.
First, an octagonal neighborhood of radius x-pixels is defined, as illustrated in Fig. 2. Then, this neighborhood is centered on each pixel of the image The set of pixels with the same Euclidean distance "d' from the center pixel are identified and labeled in the neighborhood For each set of pixels with the same Euclidean distance, i.e. with the same label, the difference between maximum and minimum pixel values (range "r") is computed.
5.
These values of r are then plotted against their corresponding Euclidean distance to the center pixel in a logarithmic scale, as illustrated in Fig. 3
6.
A straight line is then fitted to the data, then the slope of the line "m", the y-axis intercept "c" and the square of the correlation coefficient "n2" are then found and associated to the center pixel, giving as result new 2 "m", "c" and "n " images.
Russ [9] associated the slope of the line "m" as directly related to the fractal dimension of the profile. Whereas, Chandrasekhar et al. [6, 7], on other hand, associated the y axis intercept "c" and the square of the correlation coefficient 2 "n " as statistical/fractal descriptors. The process described above, was applied to the images after de-noising in in two stages: first the inverse image was obtained and then a modified radial-symmetric smoothing filter was applied, by adding the mean value "/l" for each set of pixels "k" located at the same Euclidean distance for each set of pixels and associate this value to the central point in order to construct an average mean image.
Fig. 2. Example of an octagonal neighborhood with 4 pixels of radio and 9 pixels of diameter. Pixels are label according with their Euclidean distance in relation to the central pixel "x" in the neighborhood.
1.5
u-
g.u 121..1
.91.0 0.90.8-
correlation coefficient 'Intercept"e"
un?'
u+-----.-----.-----.----.-----.----a o� 02 0.3 0;' o� Log distance Fig. 3. Example of a straight line fitted to the 10 points corresponding to the neighborhood of radius 4 of Fig 1. =
The two-dimensional operator was then applied to the average mean image to generate new m, c and n2 images. The resulting images were then scaled for visualization. To avoid edge effects, only those pixels whose neighborhood lies entirely within the image should be transformed. Finally, an edge detection algorithm based on the Hilbert transform, was applied to the resulting c image to locate the borders of the nanoparticle.
m. EXPERIMENTAnON AND RESULTS A. Experimental Setup
Several nanoparticle samples were prepared at the Centro de Nanociencia y Nanotecnologia of Universidad de las Fuerzas Armadas ESPE using a modified method [12] originally developed by He and Zhao [13]. Tn our experiment these nanoparticles are composed of zerovalent or iron sulfide and carboximethyl cellulose (CMC). Tmages were digitalized using a FET Tecnai Spirit Twin TEM operated at 80kV, as illustrated in Fig. 4.
Fig. 4. Images were recorded digitally with a FEr Tecnai Spirit Twin Electron Transmission Microscopy (TEM) operated at 80kY.
ROPEC 2015 - Computer Vision and Scene Understanding
Resulting Images
�" I
.
/
L
Fig. 5.
Edge Raw Images
.:.
Applying the Bidimentional Hurst Operator
Detection Algorithm (Hilbert Transform)
Preparation of nanoparticie sample for use with the TEM.
B. Sample Preparation
As illustrated in Fig. 5, the support film was prepared using a 2% polyvinyl formval solution stabilized with carbon. One or two droplets of nanoparticles were deposited on the support film and then the excess of liquid was simply absorbed with a filter paper. Particle size was measured manually using the TEM image software and compared with a light scattering method, both giving approximately a 26nm average size [12]. C. Results and Discusion
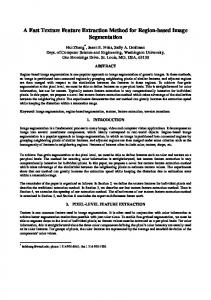
Several nanoparticles images samples were processed using the new image-processing algorithm in order to determine its performance. Fig. 6 shows the resulting images obtained before and after image processing. Images are shown in 1024xl 024 pixel resolution obtained after scaling the resulting images for visibility. As seen in Fig. 6 a good improvement in image quality has been obtained for each case. Depending of the image, the information content has been enhanced; the original structures of the particle are now clearly visible and discernible. Furthermore, after the final stage, edges of the particle are well defined, having now a clear separation between the background and the particle. Therefore, a more precise and reliable size measurement can be performed in a next step.
Fig. 6. Example of images obtained after processing different nanoparticles samples. Raw and processed images are shown in I024x1024 pixel resolution. Tmages A, B, and C represent the resulting slope (m), correlation coetllcient (112), and intercept (c) images respectively. An octagonal neighborhood with 4 pixels of radio was used for the operator.Tmages 1.1, 2.1 y 3.1 were obtained "COO after applying a Hilbert-based edge detector to the corresponding intercept images. Resulting images were scaled for visibility.
In Fe zerovalent image (1) in Fig.6 for example, an internal structure inside the nanoparticles that is included within the CMC can be observed. The algorithm allows a clear separation of the CMC from the nanoparticles, which is not so easy to observe with existing commercial software. This information is relevant for nanoparticles analysis. It gives us information about the development of the both components of the particle related to time. In the FeS image (3) in Fig. 6 the algorithm allows to distinguish between particle and CMC component represented by the edge. The robustness of the algorithm is illustrated by the images corresponding to the FeS, Image (2) in Fig. 6, which has a more complex nanoparticle structure. It is important to notice that some false edges that are also observed outside the nanoparticles in images A, B, and C of Fig. 6, in all cases, these are mostly due to the non homogeneity of the density of the formvar film used as a support for the observation of the particles, this non-uniformity density induces small changes of absorption of electrons during the generation of the image and consequently produces contrast variations that has to be considered as background noise and must be further investigated and treated in forthcoming work.
The algorithm also works with biological images obtained by TEM, as illustrated by Fig. 8 where the images of crystals produced by Bacillus thuringiensis bacteria and a cell of Tamarillo (Solanum Betaceum) where processed with the proposed algorithm to enhance their borders and information content.
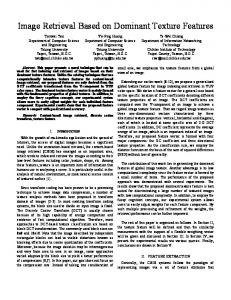
The algorithm also proved to be effective when analyzing images of nanoparticles deposited over other type of substrate, as illustrated on Fig. 7. In this figure, the original images and the intercept image "coo are shown as examples of the image improvement obtained by using the algorithm with images obtained with a 10nm carbon film instead of the standard 2% polyvinyl formval. The images on Fig.7 correspond to iron (TIT) phosphate (FeP04) with and without the CMC structure, respectively.
Finally, it is worth mentioning that the algorithm was relatively easy to implement using modern software tools (such as Matlab or LabVTEW), further developments of the system will include the automated measurement of the nanoparticle size, measurement of its roughness and separation of structures of interest.
ROPEC 2015 - Computer Vision and Scene Understanding
Raw Image
IV.
Image after processing
CONCLUSION
An improved new method for image enhancement of nanoparticles obtained from Electron Transmission Microscopy has been developed. Experimental results show that the method is not only robust and repeatable, but it can also accommodate several types of nanoparticles including both nearly spherical and more irregularly shaped nanoparticles of different sizes and configurations. The results obtained suggest that this image processing technique may provide a very useful tool for nanoparticle research, especially for highlighting details related to internal structures. Additionally, to our knowledge, this is the first intent to automate the analysis of nanoparticles images obtained by Transmission Electron Microscopy. Next, steps will include analyzing and reducing the errors associated with the formvar film, automated extracting of the nanoparticle contour and the automated measurement of its diameter, area and roughness. Additionally, we want to explore the performance of the algorithm with images of nanoparticles obtained with other types of microscopes such as Scanning Electron Microscope (SEM) and Atomic Force Microscope (AFM).
ACKNOWLEDGMENT FeP04 with CMC aerobias-FC-3 Fig. 7. Example of images obtained after processing different nanoparticles samples deposited over 10nm carbon film substrate. Raw and processed images are shown in 1024xl024 pixel resolution. The processed images correspond to the intercept "c" images obtained after applying the proposed algorithm. An octagonal neighborhood with 4 pixels of radio was used for the operator. Resulting images were scaled for visibility.
Raw Image
Image after
The authors wish to express their gratitude to Universidad de las Fuerzas Armadas ESPE for its financial support to this work under Research Grant 2014-PIT-013 and to the "Prometeo Program" of the National Secretary of Education, Science, Technology and Innovation of the Ecuadorian Government (SENESCYT).
REFERENCES [I]
Y. P. Sun, X.Q. Li, W.x. Zhang, and H. P. Wang, "A method for the preparation of stable dispersion of zero-valent iron nanoparticles," Colloids and Surfaces A: Physicochen. Eng. Aspects, Vol. 308, pp. 6066,2007.
[2]
P.F. Alvarez Monsalve, Y.A. Granadillo Moran, L.e. Diaz Chacon, and O. I. Herrera, "Empleo del Analisis de Imagenes Obtenidas pro Microscopia Electronica de Barrido (MEB) para la Determinacion de la Esfericidad en las Particulas de PVC," Acta Microscopica, Vol. 20, No. 2,pp. 141-146,2011.
[3]
W. K. Pratt, Digital Image Processing: Piks ScientifIc Inside, Fourth Edition, John Wiley & Sons, Inc, 2007.
[4]
S. Singh, "Microscopic Image Analysis of Nanoparticles by Edge Detection Using Ant Colony Optimization ", OSR Journal of Computer Engineering, Vol. II, No. 3, pp. 84-89,2013.
[5]
I.e. Russ, The Image Processing Handbook, Sixth Edition, CRC Press, 2011.
[6]
R. Chandrasekhar and Y. Attikiouzel, "New range-based neighborhood operator for extracting edge and texture information from mammograms for subsequent image segmentation and analysis,"TEE Proc-Sci. Meas. Technol., Vol. 147, pp. 408-413, 2000.
[7]
R.Chandrasekhar, Y. Attikiouzel and C.J. S. deSilva, "Texture analysis of mammograms using the two-dimensional Hurst operator," Proceedings of the 13th International Conference on Digital Signal (DSP 97), Vol.1, pp. 97-100,1997.
[8]
D. Benitez, A. Debut, S. Guerra, "Analysis ofTmages of Nanoparticles Obtained by Electron Transmission Microscopy Using the Two Dimensional Hurst Operator," Proceedings of the TEEE 2012 Andean Region International Conference (ANDESCON), pp. 195-198, 2012.
processing
Fig. 8. Example of images obtained after processing different biological samples with the algorithm. Raw and processed images are shown in 1024xl024 pixel resolution. Processed images correspond to the intercept "c" image after applying the proposed algorithm. An octagonal neighborhood with 4 pixels of radio was used for the operator. Resulting images were scaled for visibility.
ROPEC 2015 Computer Vision and Scene Understanding -
[9]
S. Mallat, A Wavelet Tour of Signal Processing, Third Edition: The Sparse Way, Elsevier, 2009.
[10] W.H. Tsai, "Moment-preserving Thresholding: A new Approach," Computer Vision, Graphics and Image Processing, Vol. 29, pp. 377-393, 1985. [11] J.e. Russ, "Processing images with a local Hurst operator to reveal textural differences," J. Comput. Assist. Microsc., Vol. 2, No, 4, pp. 249-257, 1990.
[12] L. Cumbal and C. Robalino, "Reducci6n de arseniatos, cromatos y nitratos presentes en aguas sinteticas usando nanoparticulas de hierro elemental," 7th Science and Technology Congress, June 2012 [7mo. Congreso de Ciencia y Tecnologia ". Luis Cumbal, Junio 2012]. [13] F. He and D. Zhao, "Preparation and characterization of a new class of starch-stabilized bimetallic nanoparticies for degradation of chlorinated hydrocarbons in water," Environ. Sci. Techn., Vol. 39, No. 9, pp. 33143320,2005.