classification framework based on nuclei shape matching and texture analysis is proposed for ... to machine learning algorithms are exploited. A novel hybrid.
(IJACSA) International Journal of Advanced Computer Science and Applications, Vol. 8, No. 4, 2017
A Two Phase Hybrid Classifier based on Structure Similarities and Textural Features for Accurate Meningioma Classification Kiran Fatima, Hammad Majeed Department of Computer Science National University of Computer and Emerging Sciences Islamabad, Pakistan Abstract—Meningioma subtype classification is a complex pattern classification problem of digital pathology due to heterogeneity issues of tumor texture, low inter-class and high intra-class texture variations of tumor samples, and architectural variations of cellular components. The basic aim is the achievement of significantly high classification results for all the subtypes of meningioma while dealing with inherent complexity and texture variations. The ultimate goal is to mimic the prognosis decision of expert pathologists and assist newer pathologists in making right and quick decisions. In this paper, a novel hybrid classification framework based on nuclei shape matching and texture analysis is proposed for classification of four subtypes of grade-I benign meningioma. Meningothelial and fibroblastic subtypes are classified on basis of nuclei shape matching through skeletons and shock graphs while an optimized texture-based evolutionary framework is designed for the classification of transitional and psammomatous subtypes. Classifier-based evolutionary feature selection is performed using Genetic Algorithm (GA) in combination with Support Vector Machine (SVM) to select the optimal combination of higher-order statistical features extracted from morphologically processed RGB color channel images. The proposed hybrid classifier employed leave-one-patient-out 5-fold cross validation and achieved an overall 95.63% mean classification accuracy. Keywords—Meningioma; Computer-Aided Diagnosis; Brain Tumour Classification; Cell Segmentation; Shape Analysis; Texture Analysis
I.
I NTRODUCTION
Now-a-days, Computer-Aided Diagnosis (CAD) is in wide practice in clinical work for the detection and prognosis of various types of abnormalities. For this, medical images acquired in various tests by utilizing diverse imaging modalities are used. CAD has emerged as one of the key research areas in medical imaging, diagnostic pathology and radiology. Histologic textures of tumor specimens being real-world textures are quite complex and different from synthetic textures that are captured in the controlled circumstances. The correct prognosis of tumors requires the expertise of a trained pathologist and is a time consuming task. The variability in the opinion of different pathologists and the variation in the opinion of a single pathologist at different timings may also be observed in the prognosis decision of a tumor specimen [1]. Due to these reasons, adaptive approaches and quantitative methods for computer-aided diagnosis are needed to assist histopathologists for correct diagnosis and prognosis of tumors.
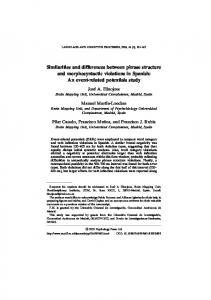
The CAD is highly desired to reduce the workload on pathologists by focusing on benign areas so that the pathologists can concentrate on the more difficult malignant cases [2]. Meningioma refers to a group of tumors or neoplasms, which arise from the defensive layers of the brain and the spinal cord named meninges. Meningiomas comprise 34% of all primary brain neoplasms and appear mainly in middle-aged patients with a higher prevalence among females. The World Health Organization (WHO) classification of tumors of the Central Nervous System categorized the meningioma tumor into three main grades (I: Benign, II: Atypical, III: Malignant) [3]. Almost 92% cases of meningioma tumor are diagnosed as benign, 6% cases are characterized as atypical while the remaining 2% are malignant. The WHO classification recognized nine histological variants of benign meningioma based on cytologic structure and morphologic features. The four most frequently occurring variants of grade-I meningioma are: Meningothelial - Mn (63%), Fibroblastic - Fb (13%), Transitional - Tr (19%) and Psammomatous - Ps (2%) [4]. Benign lesions have low proliferative potential and are curable through surgical resection. Unlike other benign tumors elsewhere in the human body, they may cause serious problems and even death of the patient depending on the size and location of their origin [3]. The digitized histology images of four major subtypes of benign meningioma are shown in Fig. 1. The pathologists scan histology samples under the microscope in order to discriminate different subtypes or grades on account of a diverse range of morphological characteristics. The meningioma images have high morphological variations between the images of same subtype while low variations in the underlying morphology of two different subtypes. The different subtypes of meningioma possess morphological characteristics including compact meningothelial whorls, collagen matrix, round or oval meningothelial cells, and psammoma bodies. Most of the meningioma subtypes from the same grade possess all these features with slight differences. Therefore, classification of a test image on account of these features is quite complex and challenging. Mn and Fb images are mostly misclassified due to considerable morphometric similarity with Tr subtype and vice versa. Similarly, nuclei of Ps images have a great similarity with Mn nuclei. Therefore, due to such similar morphological and textural characteristics, images from different subtypes of meningioma are misclassified. In addition, the overlapped nuclei, non-crisp object contours, architectural variations of
www.ijacsa.thesai.org
455 | P a g e
(IJACSA) International Journal of Advanced Computer Science and Applications, Vol. 8, No. 4, 2017 cellular components, and heterogeneous or dynamic nature of tissue textures induce ambiguity in the pattern recognition procedures. These issues need to be resolved for the precise classification of real-world multi-class meningioma textures. In this paper, the classification of histology images of benign meningioma into four major subtypes is performed. For this, structural and textural analysis techniques in addition to machine learning algorithms are exploited. A novel hybrid classification framework based on nuclei shape matching and image-level texture analysis is proposed to deal with inherent tumor textures complexity. The nuclei shape matching is performed by computing nuclei skeletons and analyzing skeletal graphs. The image-level texture analysis is performed by extracting higher-order statistical features from morphologically processed RGB color channels. An optimal feature subset is selected through a classifier-based evolutionary feature selection scheme which employed Genetic Algorithm in combination with Support Vector Machine. The selected optimal feature set is used for classification. An extensive analysis of a number of classifiers is performed and the best one is implied for meningioma subtypes classification. The remaining sections of this paper are arranged as follows. The overview of the previous work regarding meningiomas classification is given in Section II. The detailed description of the proposed framework is presented in Section III. The experimental setup and results are presented in Section IV. The discussion on results is given in Section V. The final outcomes and an overview of the future research are given in Section VI. II.
L ITERATURE R EVIEW
In past decade, the use of pathological whole-slide images is highly investigated in many areas for automated diagnosis and classification of cancers. The cancer classification techniques can be grouped into two classes based on features extraction methods: 1) The techniques which perform structure or nuclei segmentation and make shape analysis at nuclear level. These techniques exploit geometrical or statistical texture features for confining histological characteristics of nuclei [5], [6], [7]. 2) The techniques which perform the texture analysis at image level and scan the texture patterns globally to confine the inherent spatial characteristics [8], [9], [10], [11]. The performance of these techniques mainly depend on the intrinsic complexity and nature of the problem. A few of the meningioma classification techniques [5], [6], [7] reported in literature performed the morphometric analysis at nuclear level to explore local regions. Wirjadi et al. [5] explored a base of grey-scale and colored image features to classify normal and meningioma tumorous cells. Representative feature space is created from 6 histology images. Strange et al. [6] exploited morphology features to capture pathological characteristics for classification of meningioma images through random forest classifier. Zeng et al. [7] explored unsupervised color segmentation and shape features. Ten shape features including area, perimeter and major/minor axis length are computed and classified through k-Nearest Neighbor (kNN) classifier. The meningioma classification techniques proposed in [10], [8], [12] employed the wavelet transform to perform multi-
resolution analysis of meningioma textures at image level. It is beneficial to examine these images at multiple scales in order to capture the minor inherent texture variations. On the other hand, the computation of wavelet packet transform and best basis selection is computationally expensive, because with each wavelet level, the number of coefficients increases exponentially. Lessmann et al. [12] employed the discrete wavelet and color transforms to extract features for the clustering of meningioma subtypes. Unsupervised self organizing map is employed to visualize and explore the wavelet-based feature space. Qureshi et al. [8] proposed an Adaptive Discriminant Wavelet Packet Transform (ADWPT) technique. Grey-level cooccurrence matrix (GLCM) features extracted from the most stable subbands are classified through SVM classifier with 88% accuracy. 5-fold cross validation is performed by using one patient data for testing and data of remaining four patients from each subtype for training. Al-Kadi performed meningioma classification employing wavelet packets and Fractal Dimensions (FD) on blue color channel image. FD signatures from selected wavelet subbands are used for classification through kNN, naive Bayesian, and SVM classifier [10]. In another work [9], Al-Kadi explored various texture measures across blue color channel to classify meningioma subtypes through Bayesian classifier. The combination of Gaussian Markov random field and Run-Length Matrix (RLM) features selected by correlation thresholding performed better than other texture measures. Majeed et al. [11] proposed an abstract feature based evolutionary framework for meningioma classification. Abstract features are created by identifying linkages among basic RLM features and combining them into a high-level optimal feature set. Fatima et al. proposed a novel hybrid technique for improving meningioma classification based on Texture features and Shape Analysis (TSA) [13]. The skeletons and shock graphs are computed for segmented nuclei to represent and match their basic shapes. Mn and Fb subtypes are classified with good accuracy through nuclei shape matching. For Tr and Ps subtypes, GLCM texture features are extracted and classified through multi-layer perceptron with 92.50% accuracy. The shape and texture cues are important for classification as the meningioma dataset have morphometric variations for two subtypes and highly discriminating global texture for the other subtypes. However, in this work, features were extracted only from grey-scale image. The size of train and test database was also small. The classification of an individual nuclei was performed on account of one most similar nucleus. The test image was classified based on majority voting. All the reported meningioma classification techniques are either limited to grey-scale or a single color channel for feature extraction. While, for classification of a true colour RGB image, all the channels are imperative based on colour information contained in each channel. In some scenarios, their significance can be ranked but their individual role cannot be ignored. The meningioma classification techniques discussed above either performed nuclear level analysis or image level analysis to capture underlying texture variations. Mn and Fb subtypes have notable differences in shape of majority of nuclei while, Tr and Ps subtypes have clear image level textural differences. Therefore, to capture such type of pattern variations no classification technique exploited structural characteristics at nuclear level and textural characteristics at image
www.ijacsa.thesai.org
456 | P a g e
(IJACSA) International Journal of Advanced Computer Science and Applications, Vol. 8, No. 4, 2017
(a)
Fig. 1.
(b)
(c)
Four Subtypes of benign meningioma. From (a-d) are RGB images of Meningothelial, Fibroblastic, Transitional and Psammomatous subtypes.
level in a hybrid manner to solve multi-class classification problem of meningioma. In this paper, a hybrid classification framework is proposed for improved multi-class classification of meningioma. The hybrid framework addressed some of the limitations of previous works, including (1) use of nuclear-level (shape) and imagelevel (texture) features to take advantage of both simultaneously; (2) use of three RGB color channels to capture texture variations; (3) selection of kernel function of SVM based on train data classification accuracy. The main contributions of the proposed work are: 1) 2) 3) 4) 5)
III.
(d)
Use of improved segmentation procedure to get wellsegmented nuclei with less possible noise to compute true representative skeletons and shock graphs Use of hybrid classification measure, voting and confidence averaging for test image classification Development of train database of reasonable size to represent maximum data variations with less computational cost Quantification of image level higher-order texture features from three RGB color channels to exploit color information contained in each channel An extensive analysis of classifiers and implication of the best one for meningioma classification
T HE P ROPOSED M ENINGIOMA C LASSIFICATION F RAMEWORK
In this paper, an optimized hybrid framework is proposed for classification of digitized histology samples of grade-I benign meningioma into four major subtypes. The proposed classification framework comprises two main phases. In phaseI, the meningioma images are classified on account of structural information of cell nuclei into Mn and Fb subtypes with a reliance greater than an empirically defined threshold α. In phase-II, meningioma test images from phase-I; that is, either of Tr and Ps subtypes or have labels of Mn and Fb subtypes with reliance less than threshold α are classified as Tr and Ps subtypes on account of intrinsic textural characteristics. The detailed architecture of the proposed classification framework is given in Fig. 2.
A. Phase I: Classification Based on Structural Geometry The structural geometry offers important clues for recognition of objects, although, in many scenarios the precise extraction, characterization, and representation of objects is a quite complicated task. In meningioma histology images, the cell nuclei are the most prominent objects and seem valuable for the recognition of tumor samples. Therefore, the histology images of meningioma are processed to take benefit of nuclei structural information for correct classification. In phase I, following major steps are performed: 1). The colored meningioma images are converted to grey-scale and kmeans clustering is performed. The morphological operations are performed to remove irregularities. 2). The meningioma nuclei are extorted from segmented images in order to perform structural analysis. 3). The skeletons are formed for extracted nuclei bearing precise boundaries to acquire true estimation of nuclei basic structure. 4). The skeletons are processed to form skeletal or shock graphs. 5). The shock graphs of a test and a train nuclei are compared through a graph matching algorithm to find resemblance of two nuclei. The steps of phase I have been explained in detail in the following subsections. 1) Nuclei Segmentation and Extraction: For the segmentation and extraction of cell nuclei, colored RGB images of meningioma variants are converted to grey-scale. k-means clustering [14] is performed to partition images into primary cellular components on account of pixel values. The images are partitioned into two clusters representing nuclei (bluish region) and background (pink colored cytoplasmic region and a little white region of fat). After getting a clustered image, the morphological operations [15] of closing and holes filling are performed to refine uneven nuclei contours and to fill holes present in nuclei structures. For this, a flat disk-shaped structuring element is used with radius R = 3. Watershed algorithm [15] is applied to split merged and overlapped nuclei. For this, distance transform of binary image is calculated based on Euclidean distance metric. A signed distance map is then used as input to the watershed algorithm. Image erosion is performed to make boundaries smooth and wipe out noisy pixels. For this, disk-shaped structuring element is used with radius R = 2. An area filter of 200 − 1200 pixels is applied to remove segmented objects of very small or large size. The border pixels are also removed to clear misleading objects.
www.ijacsa.thesai.org
457 | P a g e
(IJACSA) International Journal of Advanced Computer Science and Applications, Vol. 8, No. 4, 2017 Phase I
Meningioma Image Dataset Grey-Scale Conversion
K-Means Clustering
Morphological Processing
Watershed Transform
Classification (Voting & Confidence Averaging)
Nuclei Shape Matching
Skeletons & Shock Graphs Computation
Nuclei Extraction
Meningothelial
Yes
Class = Mn OR Fb AND Confidence > Threshold
Output Class Fibroblastic Phase II
No
RGB Decomposition
Morphological Processing
Texture Feature Extraction (RLM ) Transitional
Feature Selection (GA-SVM) Heading
Fig. 2.
Classification (SVM) Psammomatous
Proposed hybrid framework for meningioma subtype classification
The segmented images are processed to extract wellsegmented nuclei for structural analysis. Morphological features are used for nuclei filtering based on size and shape. Four morphological features (area, perimeter, eccentricity and solidity) are computed for segmented nuclei. For all the features, quartiles are formed using feature values of all the nuclei present. Two most dense quarters with maximum nuclei count are identified. The nuclei common to dense quarters of all the features are selected. These nuclei are used for skeletonization and shock graph computation. The steps performed for nuclei segmentation and extraction are shown in Fig. 3. 2) Skeletons and Shock Graphs Computation: The structural analysis techniques for the recognition of objects based on skeletons and shock graphs are proposed in [16], [17], [18]. The concept of skeleton was first introduced by H. Blum in 1973 [19] and served as a tool for shape analysis and recognition. A skeleton is defined as a smallest possible set of points or lines equidistant to the object boundaries that completely represent the basic shape of a binary object. Accordingly, skeletonization is the reduction of foreground pixels in a binary image to a minimum collection of connected pixels in order to maximally preserve the basic shape of an object. The skeletons are computed through different skeletonization techniques which use distance maps to identify ridges, calculate Voronoi diagrams and use morphological operators. A skeletal or shock graph [20] offers a dynamic representation of a skeleton with connected path of flow. A shock graph is a hierarchical, Directed Acyclic Graph (DAG) representing the decomposition of a 2-D object boundary into primary components named shocks. The skeletonization of extracted nuclei is performed for
the recognition of meningioma samples exploiting structural information. For all the nuclei extracted from each training and testing image, the skeletons are computed employing distance transform (DT) based skeletonization technique proposed in [21]. An augmented Fast Marching Method (FMM) is used to compute DT for evolution of nuclei boundaries on regular path with constant speed. The binary images of cell nuclei for four meningioma subtypes and their respective skeletons are shown in Fig. 4. A shock graph gives better illustration of the shape of a binary object as compared to a skeleton. Therefore, after computation of skeletons for all the extracted nuclei of training and testing images, shock graphs proposed in [20] are formed to further process these skeletons for shape analysis. All the graph edges corresponding to the boundary noise are pruned to deal with noise raised due to segmentation errors. 3) Nuclei Shape Matching: The acyclic shock graphs are converted to shock trees by removing cyclic vertices using shock graph recognition grammar [22]. To perform subtrees matching in polynomial time, shock graphs are converted to finite and unique rooted trees. A comparison is made between two shock trees with the help of a tree matching algorithm in order to discover an optimal set of matching nodes. The information about two key terms is incorporated in algorithm for matching two shock trees. 1). Topological similarity of the subtrees rooted at each vertex. 2). Similarity between the shock geometry encoded at each node. In order to measure the similarity between two nodes or vertices u and v, a low dimensional curve through their respective shock trajectories is interpolated, and assigned a cost
www.ijacsa.thesai.org
458 | P a g e
(IJACSA) International Journal of Advanced Computer Science and Applications, Vol. 8, No. 4, 2017
(a)
(b)
(c)
(d)
Fig. 3. Segmentation and extraction of meningioma nuclei. (a). colored image, (b). after k-means clustering for k=2, (c). after morphological operations and watershed transform, (d). final segmented image with extracted nuclei.
(a)
(b)
(c)
(d)
Fig. 4. The cell nuclei and the skeletons for four meningioma subtypes. From (a) to (d) are meningothelial, fibroblastic, transitional and psammomatous nuclei and their respective skeletons.
C(u, v) to an affine transformation that aligns one interpolated curve with the other. C(u, v) is termed as topological distance or shock distance (weight) between u and v. The depth-first search is applied in adaptive fashion to match the subtrees which effectively recomputes the branches at each node by choosing the next branch to descend in a best-first manner. The tree matching algorithm determines the minimum weight matching between two shock trees to find subtrees which are maximally similar in terms of their topological structure and geometry of their root nodes. For detailed theory on shock graphs, tree matching algorithms, and graphs recognition grammar, a reader may consult [20], [22]. 4) Nuclei Classification: For nuclei classification, a train database having nuclei extracted from the segmented images of train set is created. The train database is divided into two partitions: train1 database having 75% data and test1 database having 25% data. All the nuclei from train1 and test1 database are processed to form skeletons and shock graphs (trees). The shock trees of all the extracted nuclei from the test image are matched to the shock trees of nuclei present in train database by using the tree matching algorithm.
To classify a single test nucleus from test1 database, k most similar nuclei to test nucleus are identified from train1 database. The value of k is determined in the range {1, . . . , 100} through cross validation. The class label of a test nucleus is assigned with majority vote from the k train nuclei with confidence CN being the normalized frequency of class as given in equation 1. CN =
c . k
(1)
Where CN is the confidence of an individual test nucleus in the range [0-1]. k is the total count of most similar train nuclei used for comparison. For each nucleus, c is the count of majority vote (i.e. count of k most similar train nuclei having the assigned class label). If there are more class labels with same value of c then one class label is selected at random. All the extracted nuclei of a meningioma test image are therefore labeled through majority vote of k similar train nuclei. To classify a test image, class label is assigned by considering two measures, majority voting and confidence averaging of its labeled nuclei. The voting of all the test nuclei based
www.ijacsa.thesai.org
459 | P a g e
(IJACSA) International Journal of Advanced Computer Science and Applications, Vol. 8, No. 4, 2017 on class label is performed and a confidence value CClass , that is mean of confidence values of the nuclei belonging to a particular class is calculated as given in equation 2. CClass =
f X CN n . f n=1
(2)
Where f is the frequency of a particular class determined on account of voting of nuclei from a test image. CN n is the confidence value of a particular test nucleus. In order to assign a class label to a test image, two scenarios are followed: •
If a particular class has the highest number of votes with the highest CClass value, then assign the label of that class to test image.
•
If one class has the highest number of votes but some other class has the highest CClass value, then class label is assigned by performing the following steps. 1) Sort all the classes based on CClass value 2) Select the class with the highest CClass value till the class with the highest number of votes 3) Retain the selected class having atleast 25% votes, otherwise discard the class 4) Keep the count of nuclei nc for the class with the lowest number of votes 5) Sort all the nuclei of each selected class based on CN values and retain top nc nuclei 6) Calculate CClass value for each class by using equation 2 7) Assign class label to the test image with the highest CClass value
If classification results obtained for test1 database are satisfactory for all the classes of a dataset, then the classification framework is based on phase-I. In case of meningioma dataset, the classification results obtained for test1 database for Mn and Fb subtypes are good, while for Tr and Ps subtypes are unsatisfactory. This emphasized the need of a hybrid framework which not only focuses on local structural characteristics but also considers global texture for improved classification of weakly classified subtypes. In order to identify test samples for classification through phase II, the comparison is made on basis of CClass value. The class label is declared correct for test samples that are classified as Mn and Fb with CClass value greater than an empirically specified threshold α=0.5. On the other hand, the remaining test samples that are labeled as Tr or Ps or as Mn or Fb with a confidence less than threshold α are classified through phase II based on intrinsic texture. The value of threshold α is determined in the range [0-1] through cross validation on training data. The obtained value of α confirms the assignment of class label by considering more than 50% votes. B. Phase II: Classification Based on Intrinsic Texture In this phase, the meningioma test images that were labeled in phase I as either Tr and Ps subtypes or as either Mn and Fb subtypes with CClass value less than threshold α are recognized on the basis of their inherent textural patterns. The statistical texture features are computed at different orientations to
get significant textural correlations and used for classification. In phase II, the main steps performed are as follows: 1) input RGB images are decomposed into constituent color channels and grey-scale morphological operations are performed; 2) the statistical RLM features are extracted from three color channels; 3) an optimal feature subset is selected through a classifier based evolutionary feature selection scheme; and 4) finally, the selected optimal feature subset is used for recognition of unknown test samples through SVM classifier. 1) Pre-processing: All the input images are decomposed into R, G, B color components. The basic grey-scale morphological operations [15] are executed on each color channel image to highlight the basic textural trends and to eradicate superfluous details. The Morphological gradient (Mg ) – the difference between dilation and erosion of an input image – is computed to pre-process meningioma images by using equation 3. Mg = (I(x, y) ⊕ s(x, y)) − (I(x, y) s(x, y))
(3)
Where I(x, y) is a grey-scale image and s is a structuring element determined empirically to be a square of 5x5 pixels of ones. The red color channel images for two meningioma subtypes (Tr and Ps) and their corresponding morphological processed images are shown in Fig. 5.
(a)
(b)
Fig. 5. Pre-processing of meningioma subtypes images. From (a-b) are red color channel images (top ones) of Transitional, and Psammomatous subtypes and their corresponding morphological processed images (bottom ones).
2) Feature Extraction: Grey-level run-length matrices basically quantize image regions in runs of pixels and compute histograms of grey-level run-lengths in various orientations. Four run-length matrices are computed at orientations (0◦ , 45◦ , 90◦ , and 135◦ ) using 256 grey-levels for three R, G, B color channel images. Eleven statistical textural features are calculated from computed run-length matrices [23]. These features include: Short Run Emphasis (SRE), Long Run Emphasis (LRE), GreyLevel Non-uniformity (GLN), Run Length Non-uniformity (RLN), Run Percentage (RP), Low Grey-Level Run Emphasis (LGLRE), High Grey-Level Run Emphasis (HGLRE), Short Run Low Grey-Level Emphasis (SRLGLE), Short Run High Grey-Level Emphasis (SRHGLE), Long Run Low Grey-Level
www.ijacsa.thesai.org
460 | P a g e
(IJACSA) International Journal of Advanced Computer Science and Applications, Vol. 8, No. 4, 2017 Emphasis (LRLGLE), Long Run High Grey-Level Emphasis (LRHGLE). 3) Evolutionary Feature Selection Scheme: In the proposed framework, an evolution-based optimization search technique is employed which used classification accuracy as criterion for optimal feature selection. The Genetic Algorithm (GA) in combination with Support Vector Machine (SVM) is used to select the most relevant subset of features that improves classification accuracy on training data for Tr and Ps subtypes. There is no minimum or maximum limit on number of selected features from GA. Therefore, a heuristic search is performed in space of subsets of features where the quality of a candidate feature subset is evaluated through SVM classifier. Three kernel functions of SVM (linear, Gaussian RBF and quadratic) are explored and three optimal feature subsets are obtained. a) Chromosome Design: A GA individual called chromosome is used to signify a feature subset from the space of all possible feature subsets. A random population of 150 chromosomes is created where each chromosome is represented through a binary string which possess a set of active or inactive genes. Active genes indexes represent the features which will contribute in the classification process. The length of each chromosome is 132, where 44 genes are reserved for features from each red, green and blue color channels respectively. The interpretation of chromosome for the red color channel is shown in Fig. 6. Each feature has four indexes reserved for it. These correspond to the four orientations that are 0◦ , 45◦ , 90◦ and 135◦ . The genes with ”1” represent active features and ”0” represent inactive features. b) Fitness Function: Fitness of each chromosome is a measure of its goodness on classification problem. To compute this, active genes in the chromosome are employed for classification and resultant average accuracy is used as fitness of the chromosome. The fitness of each individual is evaluated through SVM classifier. The primary task of fitness function is to guide the system towards selecting the most effective features. The classification accuracy ACC is the number of meningioma samples (instances) correctly classified (true positives plus true negatives) from all the classified samples and is calculated by using equation 4.
ACC =
ICC × 100 IT C
(4)
Where ICC is the number of instances correctly classified and IT C is the total number of instances classified. c) Individual Selection: The most fit individuals are selected for genetic operations through the tournament selection operator. A set having seven most fit individuals is selected to have a contest for individual selection. d) Recombination Operators: The genetic information is exchanged between a couple of selected chromosomes by using one point crossover operator with a suitably higher crossover rate i.e. 0.8. A uniform mutation operator is used to introduce diverse individuals by flipping binary gene values of the selected chromosomes with 0.01 probability.
e) Termination Criteria: Each run of GA is terminated when there is no improvement in fitness value for a specified number of generations. The best individual at the end of one run is hired to survive as individual in the initial population of next run. Therefore, the optimization process of GA is proceeded in the form of cascaded runs; that is, the most fit individual of the final generation of one run is seeded to the next run for incorporation as individual in the initial random population. The best individual of last run is selected as the final feature subset. A sufficient number of cascaded runs are performed for the efficient exploration of search space and avoidance of getting local optimal solution. 4) Classification of Meningioma Textures: Three kernel functions (linear, RBF and quadratic) of SVM and associated selected feature subsets are compared based on training accuracy. The kernel function and the feature subset with the highest accuracy are selected for recognition of unseen test samples. Therefore, SVM classifier with the selected kernel function is employed for classification of unseen meningioma textures. The optimal values for SVM parameters are found through grid-search method using cross validation and values with the highest cross validation accuracy are selected. The value for γ; that is, width of Gaussian function for RBF SVM, is found in the range {2−3 , ..., 24 } and value of cost parameter C is found in the range {2−3 , . . . , 221 }. For estimation of separating hyperplane, Least Squares (LS) [24] method is used. IV.
E XPERIMENTAL S ETUP AND R ESULTS
A. Meningioma Dataset The dataset used in this research is anonymized and deidentified. The diagnostic meningioma tumor samples are attained from the neurosurgical resections at the Bethel Department of Neurosurgery, Bielefeld, Germany. The routinely formalin-fixed, paraffin-embedded, Hematoxylin and Eosin (H&E) stained histological slides are examined on a Zeiss Axioskop2 plus microscope having a Zeiss Achroplan 40x/0.65 lens. Zeiss AxioVision 3.1 software and a Zeiss AxioCam HRc digital color camera (Carl Zeiss AG, Oberkochen, Germany) is utilized to capture 24 bit, true color RGB pictures in TIF format. For each subtype, histology data of five patients is collected and for each patient, four digital images having dimensions of 1300x1030 pixels are captured. First, all the digitized histology images are truncated to 1024x1024 pixels, then each truncated image is further partitioned into four images of 512x512 pixels having non-overlapping visual content. Hence, 16 images are attained for each patient and 80 images for each subtype. After processing, the final database comprises 320 images in total. B. Classification Results Meningioma dataset contains images of four subtypes, where each subtype have data of five different patients. Leaveone-patient-out cross validation strategy is applied by utilizing four patients of each subtype for training and one unseen patient (16 images) for evaluation. In this manner, five different folds are performed for fair evaluation of unseen test patients of four subtypes. In each fold, the dataset having data of 20 patients is divided into two sets: train set having data of 16 patients (4 patients per subtype) and test set having data of 4 patients (1 patient per subtype).
www.ijacsa.thesai.org
461 | P a g e
(IJACSA) International Journal of Advanced Computer Science and Applications, Vol. 8, No. 4, 2017 Orientations On/Off ? 0 45 90 135 0 45 90 135 0 45 90 135 0 45 90 135 0 45 90 135 0 45 90 135 0 45 90 135 0 45 90 135 0 45 90 135 0 45 90 135 0 45 90 135
0 0 0 1
0 0 0 0 0 1 0 0 0 0 1 1 0 0 0 0 0 0 0 0
1
5
2
3
SRE
4
6
7
LRE
8
0 0 0 1 0 0 0 0
0 0 1 0 0 0 0 1
0 0 0 0
9 10 11 12 13 14 15 16 17 18 19 20 21 22 23 24 25 26 27 28 29 30 31 32 33 34 35 36 37 38 39 40 41 42 43 44
GLN
RLN
RP
LGLRE
SRLGLE
HGLRE
LRLGLE
SRHGLE
LRHGLE
Indexes
Fig. 6. Proposed chromosome structure for red color channel. Each feature is assigned four indexes corresponding to four directions, 0◦ , 45◦ , 90◦ and 135◦ . The values within the boxes show the selection or otherwise of the corresponding feature.
In phase I, five different training databases having nuclei extracted from training images are created excluding all the test images to perform five folds. From training data of four subtypes, 1024 meningioma nuclei are added to each database with an equal share of 256 nuclei from each subtype. 64 nuclei are collected from each patient with active contribution from each image. The increase in size of train database after a reasonable figure has no positive impact on classification results but negative impact on problem in terms of increased computational cost. To draw and match skeletons and shock graphs, an object recognition application named Shape Matcher 5 [25] is used. For evaluation of unseen meningioma samples, all the nuclei from a test image are compared with the entire training database to find relative similarity with each nuclei. The class label for test image is assigned based on voting and confidence averaging of all the test nuclei. The Mn subtype is classified with 93.75% accuracy. Likewise, the Fb, Tr and Ps subtypes are classified with 90%, 68.25% and 66.75% accuracy respectively. The classification results achieved through phase I revealed that the images belonging to Mn and Fb subtypes are classified with significantly high accuracy while the images from Tr and Ps subtypes with comparatively low accuracy. Therefore, it is perceived that the structural analysis of meningioma nuclei is a competent approach to discriminate Mn and Fb subtypes while it remained unable to perform well in case of Tr and Ps subtypes. In phase II, the linear SVM with the optimal feature sets achieved an overall test accuracy of 99.38% over five folds. Tr subtype has 100% and Ps subtype has 98.75% accuracy. It is observed that there is a significant improvement in classification accuracy achieved through texture analysis at image-level for both the Tr and Ps subtypes as compared to nuclei shape matching. The classification results achieved through the proposed hybrid classifier for four subtypes of meningioma in five folds are presented in Table I. The overall classification accuracy obtained for four subtypes of meningioma averaged over five folds is 95.63%. The mean accuracy of 93.75% is achieved for Mn, 90% for Fb, 100% for Tr and 98.75% for Ps. The proposed hybrid classification framework achieved high accuracy; that is, 90% or more for all the subtypes of meningioma. 1) Performance Comparison of Classifiers: The performance of various classifiers is investigated by classifying the feature set with all the features (132 features) through a diverse group of classifiers widely used in medical imaging applications including RBF SVM, linear SVM, Multilayer Perceptron (MLP), Random Forest, Naive Bayes and k-NN.
TABLE I. C LASSIFICATION R ESULTS FOR F OUR M ENINGIOMA S UBTYPES USING THE P ROPOSED H YBRID C LASSIFIER IN F IVE F OLDS . AccM n , AccF b , AccT r AND AccP s – ACCURACY OF M n, F b, T r AND P s R ESPECTIVELY. AccOverall = M EAN C LASSIFICATION A ACCURACY AVERAGED OVER F OUR S UBTYPES FOR A PARTICULAR F OLD . Avg = AVERAGE ACCURACY FOR F IVE F OLDS P hase1
F old#
P hase2
Hybrid
AccM n
AccF b
AccT r
AccP s
AccOverall
100 100 87.50 100 81.25 93.75
93.75 87.50 87.50 93.75 87.50 90
100 100 100 100 100 100
100 100 100 100 93.75 98.75
98.44 96.88 93.75 98.44 90.63 95.63
1 2 3 4 5 Avg
The classification result obtained through different classifiers is presented in Table II. The result showed that linear SVM outperformed other classifiers for both T r and P s subtypes while, quadratic SVM classified the P s subtype with high accuracy. TABLE II. C LASSIFICATION R ESULTS (ACCURACY (%)) O BTAINED T HROUGH D IFFERENT C LASSIFIERS BY USING C OMPLETE F EATURE S ET (132 F EATURES ). Fo IS THE C OUNT OF THE F EATURES U SED . AccT r AND AccP s ARE % ACCURACY OF T r AND P s S UBTYPES . AccOverall IS THE M EAN ACCURACY OF T WO M ENINGIOMA S UBTYPES ) Classif ier
Fo
AccT r
AccP s
AccOverall
SV MLinear SV MRBF SV MQuadratic M LP Random F orrest N a¨ıve Bayes KN N
132 132 132 132 132 132 132
88.75 78.75 78.75 68.75 58.75 58.75 48.75
96.25 83.75 96.25 96.25 92.5 83.75 97.5
92.50 81.25 87.50 82.50 75.63 71.25 73.13
Table III shows the parameter values used by each classifier. TABLE III.
Classifier
VALUES OF THE PARAMETERS USED C LASSIFIERS
BY
D IFFERENT
Parameter Name
Parameter Value
SVM
RBF Kernel’s Gamma γ Cost parameter C
γ ∈ {2−3 , . . . , 24 } C ∈ {2−3 , . . . , 221 }
MLP
Hidden Layers Neurons in Hidden Layer Learning Rate Momentum
1 4 (no. of classes) 0.3 0.2
N o. of Trees
10
N o. of Neighbors
1
Random Forest kNN
2) Performance Comparison of Meningioma Classification Techniques: The proposed framework was compared with the
www.ijacsa.thesai.org
462 | P a g e
(IJACSA) International Journal of Advanced Computer Science and Applications, Vol. 8, No. 4, 2017 recently published best techniques for the classification of meningioma dataset. The classification results are presented in Table IV. ADWPT [8] and TSA [13] techniques have performed 5-folds (leave-one-patient-out) cross validation for experimentation which is comparable with the proposed framework. The tabular statistics show that the proposed framework has shown considerable improvement in the highest overall classification accuracy along with the highest accuracy for all the subtypes of meningioma. TABLE IV. C OMPARISON OF C LASSIFICATION R ESULTS AVERAGED OVER 5-F OLDS . AccM n , AccF b , AccT r AND AccP s – ACCURACY OF M n, F b, T r AND P s R ESPECTIVELY. AccOverall = C LASSIFICATION ACCURACY AVERAGED OVER F OUR S UBTYPES OF M ENINGIOMA ACHIEVED BY ADWPT, TSA AND P ROPOSED F RAMEWORK Technique
AccM n
AccF b
AccT r
AccP s
AccOverall
ADWPT [8] TSA [13] Proposed
89 93.75 93.75
80 90 90
85 95 100
97 91.25 98.75
88 92.50 95.63
V.
nucleus based on similarity, there will be great chance of misclassification. Accordingly, when the class label for a test image will be decided based on nuclei voting only, the image will be labeled as Fb instead of Ps. Most of the meningioma classification techniques cited in Section II performed the texture analysis at image level for all the subtypes. Two subtypes of meningioma (Mn and Fb) have considerable structural differences, while the other two subtypes (Tr and Ps) have noteworthy textural variations. In this paper, the hybrid framework is proposed to capture both types of characteristics (local shape contours and global texture) for improved meningioma classification. The proposed hybrid framework presented the highest classification results in comparison with other meningioma classification techniques. If a histology dataset has some visual differences in nuclei shapes of all the subtypes, then phase-I is expected to present good classification results. If a dataset has subtypes with both types of structural and textural variations as in meningioma dataset, then hybrid framework seems a good option for classification.
D ISCUSSION
VI.
The meningioma nuclei and their respective skeletons with noteworthy characteristics are expected to offer significant contribution for the classification of meningioma variants. The histology images of meningioma subtypes shown in Fig. 1. have a clear visual representation of nuclei shapes owned by different subtypes. The nuclei for Mn subtype are usually round or oval shaped. The nuclei for Fb subtype are rod or spindle shaped and appear as thin thread like structures. If the visual structural analysis of Mn and Fb subtypes is performed on account of nuclei shapes and their respective skeletons, they show quite different nuclei and consequently their skeletons. The Tr subtype is also known as a hybrid or mixed subtype having characteristics of both Mn and Fb subtypes. The nuclei of Tr subtype are round, oval, rod-like or spindle shaped. Therefore, the Tr nuclei skeletons have a considerable similarity with skeletons of Mn or Fb nuclei. All the images of Ps subtype have a large number of psammoma bodies and relatively a small number of cell nuclei. In most of the cases, the nuclei are very small in size. For images of some Ps patients the nuclei look like very thin fibers or thread-like structures, while in some images of other patients, the nuclei are round or oval just like Mn nuclei. Again, some images have majority of small sized nuclei showing characteristics of Tr subtype. Therefore, the Ps nuclei and their skeletons show a mixed pattern of similarity to other subtypes besides some different and true Ps representatives. The morphological features of meningioma nuclei and their respective skeletons provides a valid reason for low classification accuracy achieved for Tr and Ps subtypes. The images from Tr and Ps subtypes for test1 database are weakly classified owing to insufficient or small number of true representative nuclei. There are large variations in the nuclei contours appearing in different images of Tr and Ps subtypes. In case of Ps subtype, insufficient number of nuclei present in most of the segmented images and over-split or irregularshaped nuclei also provided a reason for misclassification. If a test trial is performed to evaluate a Ps patient with images having thread-like nuclei, then the nuclei of test images will show greater similarity to Fb train nuclei as compared to Ps. In this case, when the class label will be assigned to an individual
C ONCLUSION
Meningioma subtype classification is a real-world multiclass classification problem of digital pathology. It is a quite complex pattern classification problem due to heterogeneity issues of tumor texture, low inter-class and high intra-class texture variations of tumor samples, and architectural variations of cellular components. In this paper, a novel hybrid framework based on nuclear level shape and image level texture analysis is proposed for the histology classification of benign meningioma subtypes. The basic aim of the proposed hybrid framework is the achievement of promising classification results for all the subtypes of meningioma while dealing with the inherent complexity and texture variations. The ultimate goal is to mimic the prognosis decision of expert pathologists and assist newer pathologists or others in making the right and quick decisions. The proposed framework comprises two main phases: Shape analysis of nuclei through matching of skeletons and shock graphs and texture analysis through extraction of higher-order texture features from RGB color channels. The proposed hybrid framework efficiently captured shape and texture variations and classified meningioma subtypes with 95.63% accuracy. In the future, other texture measures and methods for optimal feature subset selection may be explored. The alternate methods to improve the quality of segmentation may also be investigated. ACKNOWLEDGMENT The authors would like to thank Dr. Nasir M. Rajpoot, Associate Professor, Department of Computer Science, University of Warwick, United Kingdom for the provision of meningioma dataset of the Institute of Neuropathology, Bielefeld, Germany. R EFERENCES [1]
C. Wang, H. Y. Durra, Y. Huang, and V. Manucha, “Interobserver reproducibility study of the histological patterns of primary lung adenocarcinoma with emphasis on a more complex glandular pattern distinct from the typical acinar pattern,” International journal of surgical pathology, vol. 22, no. 2, pp. 149–155, 2014. [2] M. Gurcan, L. Boucheron, A. Can, A. Madabhushi, N. Rajpoot, and B. Yener, “Histopathological image analysis: A review,” Biomedical Engineering, IEEE Reviews in, vol. 2, pp. 147–171, 2009.
www.ijacsa.thesai.org
463 | P a g e
(IJACSA) International Journal of Advanced Computer Science and Applications, Vol. 8, No. 4, 2017
[3]
[4] [5]
[6]
[7]
[8]
[9]
[10]
[11]
[12]
[13]
[14] [15] [16]
[17]
[18]
[19] [20]
[21]
[22]
[23] [24]
D. N. Louis, H. Ohgaki, O. D. Wiestler, W. K. Cavenee, P. C. Burger, A. Jouvet, B. W. Scheithauer, and P. Kleihues, “The 2007 who classification of tumours of the central nervous system,” Acta neuropathologica, vol. 114, no. 2, pp. 97–109, 2007. J. Lee, Meningiomas: diagnosis, treatment, and outcome. Springer, 2009. O. Wirjadi, T. Breuel, W. Feiden, and Y. Kim, “Automated feature selection for the classification of meningioma cell nuclei,” Bildverarbeitung f¨ur die Medizin 2006, pp. 76–80, 2006. H. Strange and R. Zwiggelaar, “Meningioma subtype classification using morphology features and random forests,” in SPIE Medical Imaging. International Society for Optics and Photonics, 2013, pp. 86 760S–86 760S. Z. Zeng, Z. Tong, Z. Han, Y. Zhang, and R. Zwiggelaar, “The classification of meningioma subtypes based on the color segmentation and shape features,” in Frontier and Future Development of Information Technology in Medicine and Education. Springer, 2014, pp. 2669– 2674. H. Qureshi, N. Rajpoot, T. Nattkemper, and V. Hans, “A robust adaptive wavelet-based method for classification of meningioma histology images,” In Proceedings MICCAI’2009 Workshop on Optical Tissue Image Analysis in Microscopy, Histology, and Endoscopy (OPTIMHisE), 2009. O. Al-Kadi, “Texture measures combination for improved meningioma classification of histopathological images,” Pattern recognition, vol. 43, no. 6, pp. 2043–2053, 2010. O. S. Al-Kadi, “A multiresolution clinical decision support system based on fractal model design for classification of histological brain tumours,” Computerized Medical Imaging and Graphics, 2014. H. Majeed and K. Fatima, “Synergies between texture features: an abstract feature based framework for meningioma subtypes classification,” Pattern Analysis and Applications, pp. 1–17, 2017. B. Lessmann, T. Nattkemper, V. Hans, A. Degenhard et al., “A method for linking computed image features to histological semantics in neuropathology,” Journal of biomedical informatics, vol. 40, no. 6, pp. 631–641, 2007. K. Fatima, A. Arooj, and H. Majeed, “A new texture and shape based technique for improving meningioma classification,” Microscopy research and technique, vol. 77, no. 11, pp. 862–873, 2014. J. T. Tou and R. C. Gonzalez, “Pattern recognition principles,” Applied mathematics and computation, no. 7, 1974. R. C. Gonzalez and E. Richard, “Woods, digital image processing,” ed: Prentice Hall Press, ISBN 0-201-18075-8, 2002. N. D. Cornea, D. Silver, X. Yuan, and R. Balasubramanian, “Computing hierarchical curve-skeletons of 3d objects,” The Visual Computer, vol. 21, no. 11, pp. 945–955, 2005. X. Bai and L. J. Latecki, “Path similarity skeleton graph matching,” Pattern Analysis and Machine Intelligence, IEEE Transactions on, vol. 30, no. 7, pp. 1282–1292, 2008. S. Hingway and M. Bhurchandi, “An improved shock graph for an improved object recognition,” Cyber Journals: Multidisciplinary Journals in Science and Technology: Journal of Selected Areas in Software Engineering (JSSE), May Edition, 2011. H. Blum, “Biological shape and visual science (part i),” Journal of theoretical Biology, vol. 38, no. 2, pp. 205–287, 1973. K. Siddiqi, A. Shokoufandeh, S. J. Dickinson, and S. W. Zucker, “Shock graphs and shape matching,” International Journal of Computer Vision, vol. 35, no. 1, pp. 13–32, 1999. A. Telea and J. J. Van Wijk, “An augmented fast marching method for computing skeletons and centerlines,” in Proceedings of the symposium on Data Visualisation 2002. Eurographics Association, 2002, pp. 251– ff. K. Siddiqi and B. B. Kimia, “A shock grammar for recognition,” in Computer Vision and Pattern Recognition, 1996. Proceedings CVPR’96, 1996 IEEE Computer Society Conference on. IEEE, 1996, pp. 507– 513. X. Tang, “Texture information in run-length matrices,” Image Processing, IEEE Transactions on, vol. 7, no. 11, pp. 1602–1609, 1998. J. Suykens and J. Vandewalle, “Least squares support vector machine classifiers,” Neural processing letters, vol. 9, no. 3, pp. 293–300, 1999.
[25]
“Shapematcher 5: A shape indexer and matcher for object recognition,” http://www.cs.toronto.edu/ dmac/ShapeMatcher/, last accessed April, 11 2014.
www.ijacsa.thesai.org
464 | P a g e