2010 Digital Image Computing: Techniques and Applications
A Two-Stage Correlation Method for Stereoscopic Depth Estimation Nils Einecke and Julian Eggert Honda Research Institute Europe Offenbach, Germany
[email protected],
[email protected]
sampling-insensitive calculation [11]. However, comparisons [12] have shown that despite these countermeasures, SAD and SSD are inferior to other matching costs that account directly for changes in intensity. One of the standard matching costs that accounts for changes in intensity is the normalized cross-correlation (NCC). It allows for a bias and a linear gain of pixel intensities. Furthermore, NCC is optimal for compensating Gaussian noise and the correlation values are constrained to the interval of [-1,1], which eases the selection of a threshold for rejecting bad matches. The main disadvantage of NCC is the strong fattening effect compared to other matching costs. Two other important cost functions are rank and census transform [13]. The main idea of the rank transform is to replace each pixel intensity with its rank among a certain neighborhood. This removes most of the lighting changes that can occur between images and decreases the fattening compared to the other cost functions. The actual rank transform is only a preprocessing of the stereo images, which is usually followed by a stereo computation with SAD or SSD. In a comparison of six cost functions in [12], rank transform was shown to be the best cost function for correlation-based stereo with respect to several radiometric changes. The census transform is an extension of the rank transform which does not replace the pixels with their rank but rather with a binary fingerprint that encodes which pixels of the neighborhood are smaller than the anchor pixel. The matching cost here is the hamming distance between two such finger prints. In this paper, we show that the fattening effect of NCC arises from its sensitivity to high contrasts and propose a new two-stage correlation that reduces this sensitivity. In the first stage a normalized cross-correlation is computed followed by a summation of the correlation coefficients in the second stage. We demonstrate that this summed normalized crosscorrelation (SNCC) dramatically improves the results of traditional stereo algorithms compared to plain NCC and also the powerful rank transform.
Abstract—The computation of stereoscopic depth is an important field of computer vision. Although a large variety of algorithms has been developed, the traditional correlationbased versions of these algorithms are prevalent. This is mainly due to easy implementation and handling but also to the linear computational complexity, as compared to more elaborated algorithms based on diffusion processes, graph-cut or bilateral filtering. In this paper, we introduce a new two-stage matching cost for the traditional approach: the summed normalized cross-correlation (SNCC). This new cost function performs a normalized cross-correlation in the first stage and aggregates the correlation values in a second stage. We show that this new measure can be implemented efficiently and that it leads to a substantial improvement of the performance of the traditional stereo approach because it is less sensitive to high contrast outliers. Keywords-stereoscopic depth; cost function; reduced fattening
I. I NTRODUCTION
AND
R ELATED W ORK
Stereo processing is one of the most intensively researched areas in computer vision. Over the last three decades a large amount of different approaches have been developed. Current state-of-the-art approaches are based on belief propagation [1], [2], dynamic programming [3], [4], bilateral filtering [5], [6] or graph-cut [7]. However, the traditional correlation-based stereo is still a common tool, especially in real-time systems [8], [9], [10]. One reason for this is the computational efficiency of the traditional approaches because they have a runtime linear in the number of pixels and searched disparities. A major drawback of the traditional stereo approach is that depth discontinuities are not very precise. This effect is usually called fattening. The degree of fattening depends on the matching cost function used for correlating image patches. The most common matching costs for traditional stereo are the sum of absolute difference (SAD) and the sum of squared difference (SSD). These measures assume a constant intensity for corresponding pixels. For this reason they often fail in real-world application due to lighting changes between the two camera views. Common ways of reducing this effect is to apply a Laplacian of Gaussian filter or to subtract the mean intensity in each image prior to the actual stereo computation. Furthermore, SAD and SSD can produce bad correlation values for corresponding pixels. To compensate for this, Birchfield and Tomasi have proposed a 978-0-7695-4271-3/10 $26.00 © 2010 IEEE DOI 10.1109/DICTA.2010.49
II. T WO -S TAGE C ORRELATION In this section, we will discuss why the normalized crosscorrelation (NCC) is more prone to fattening than other 233 227
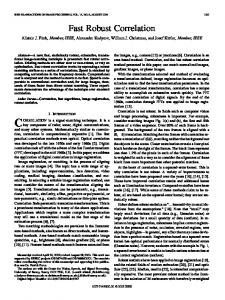
Figure 1. The left image shows the left Venus image altered by a rectangle of very high contrast. From second left to the right, mean and standard deviation normalized images are shown using filter sizes of 9x9, 21x21, 55x55, 149x149. Especially, for the larger filter sizes the suppression of the neighborhood of the high contrast rectangle is clearly observable.
normalization equation (4) to this image using different filter sizes. The resulting images of the filtering are shown in Fig. 1. They demonstrate that the high contrast rectangle suppresses the structure in its surrounding, whose size is defined by the filter size. Due to this suppression effect all patches in the vicinity of a high contrast edge favor the disparity of this edge because it is the dominant structure. Not fitting this structure would lead to a large error or small correlation value. In Fig. 2a a cutout of the left image of the Venus scene is shown. The white rectangle patch (see also Fig. 2e) is correlated with the right image, shown in 2b, for several disparities (shifts). Fig. 2c shows the correlation values for these disparities. This plot shows that the best match is roughly at 13 pixel disparities while the ground truth depth is roughly at 8 pixel disparities (depicted by the vertical line). The patch that corresponds to the peak is depicted as the solid rectangle in Fig. 2b and shown in Fig. 2f. The reason for the wrong match is the large contrast edge between the bright newspaper and the dark background. By comparing Fig. 2e and Fig. 2f it can be directly seen that the matching was dominated by this strong contrast edge. Since the contrast edge itself has the depth of the occluder (newspaper), which is roughly a disparity of 13 pixels, all patches that encompass the border of the newspaper will have the best correlation at 13 pixels disparity. In summary the above observations indicate that the normalized cross-correlation is biased by strong contrasts. This leads to the conclusion that NCC for stereo processing should be used with small filter sizes. However, decreasing the filter size would lead to noisy depth images.
matching costs and why the summed normalized crosscorrelation abates this problem. Furthermore, we show that SNCC can be implemented efficiently using box filters in a similar way like NCC. A. Problem of Normalized Cross-Correlation For two patches from the two camera images I L (left) and I (right) the normalized cross-correlation (NCC) is defined as: P 1 L L R R x′ ∈p(x) (Ix′ − µx )(Ix′ +d − µx+d ) |p(x)| , (1) ρx = R σxL σx+d R
where µx
=
σx
=
X 1 Ix′ , |p(x)| ′ x ∈p(x) v u X u 1 (Ix′ − µx )2 . t |p(x)| ′
(2)
(3)
x ∈p(x)
In the above equations x is the pixel position of the anchor point of the left patch, p(x) is the set of pixel coordinates of the left image patch and p(x + d) is the set of pixel coordinates of the right image patch, i.e. d denotes the disparity between the left and right image patch. As was stated above NCC exhibits a strong fattening of depth discontinuities. It is often stated that the fattening is caused by perspective changes between the stereo images. In contrast, we argue that the fattening is caused by the strong intensity contrasts that usually occur at depth discontinuities. These high contrasts influence the correlation values of all patches that touch such a high contrast. We further argue that this effect arises from the normalization in the correlation equation (1). In each patch p(x) the values are normalized by Ix′ − µx Ixnorm = , where x′ ∈ p(x) . (4) ′ σx
B. Summed Normalized Cross-Correlation To overcome the aforementioned dilemma of NCC filtering, we propose a two-stage filtering. In the first stage NCC is computed according to the correlation equation (1) but using a very small filter size of 3x3 or 5x5. Then in the second stage a summation filter is applied directly on the result of the NCC filtering. This averages the correlation values over the neighborhood of each pixel at each disparity. In doing so, the fine structure of the image is preserved and at the same time the noise in the estimation is reduced. This
Because of this normalization the low contrast structure in the vicinity of a high contrast edge is suppressed. To visualize the suppression, we added a very high contrast rectangle (value 10000) to the left Venus image of the Middlebury stereo benchmark [14]. Then we applied the 228 234
of the target patch. C. Computational Complexity The following pseudocode summarizes the working of SNCC for the traditional stereo processing: (b) Right Venus image
1
1
0.8
0.8
correlation value
correlation value
(a) Left Venus image
0.6
0.4
0.2
0 0
5
10
15
20
(1) µL = boxfilfter(L, 3x3) (2) µR = p boxfilfter(R, 3x3) boxfilfter(L2 , 3x3) − µ2L (3) σL =
p
0.6
boxfilfter(R2 , 3x3) − µ2R (4) σR = (5) ρmax = −1 confidence map in image size (6) D = 0 disparity map in image size
0.4
0.2
SNCC Loop
0 0
5
disparity
10
15
20
(1) ∀ disparities d do boxfilter(L∗Rd , 3x3)−µL µRd (1.1) ρ = σL σR d (1.2) ρ¯ = boxfilter(ρ, averaging filtersize) (1.3) ∀ positions x: if(¯ ρ(x) > ρmax (x)) (1.3.1) ρ(x)max=ρ¯(x) (1.3.2) D(x) = d (2) return D
disparity
(c) NCC correlation
(e) patch in 2a
SNCC Init
(d) SNCC correlation
(f) best NCC match
Here, we exploit the fact that the correlation equation (1) can be reformulated to P 1 L R L R x′ ∈p(x) (Ix′ Ix′ +d ) − µx µx+d |p(x)| . (6) ρx = R σxL σx+d
(g) best SNCC match
Figure 2. a) and b) show a cutout of the left and the right stereo image of the Venus scene. The rectangular patch in a) is correlated with the right image for a set of disparities. c) and d) show the results for NCC and SNCC, respectively. Correspondingly, the best matching patches are depicted in b) by the solid rectangle for NCC and the dashed rectangle for SNCC. The vertical line in c) and d) denotes the ground truth disparity. e-g) Left image patch and best matches of NCC and SNCC in the right image.
means that our new cost function is defined as X 1 ρ¯x = ′ ρx′′ , |p (x)| ′′ ′
This way the mean values can be calculated in advance and need not to be mangled with the image for every disparity shift. In [15] it has already been shown that NCC filtering can be calculated in linear time with respect to the number of pixels n and the number of disparities d, i.e. O(nd). In order to achieve the linear runtime, a fast box filter implementation based on integral image (summation table) is used. However, we use the separated filtering of the box filter and not an integral image. There are three reasons: Firstly, the separated box filtering takes two subtractions, two additions and one division per pixel, while integral images take three additions (two for creating the integral image and one for summation), three subtractions (one for creating the integral image and two for summation) and one division per pixel. Hence, we save one addition and one subtraction per pixel. Secondly and more importantly, the separated filtering is numerically less demanding. The maximum value needed to be stored for an integral image is n · b, where b is the encoding depth (e.g. 8-bit for standard gray valued images). In contrast, in a separable filtering scheme the maximum value is w·b, where w is the number of pixels in a filter window. As usually w ≪ n we save a lot of memory and gain speed. Third, the separable filtering spares one additional buffer (namely the integral image). These characteristics of separable filtering allows for a slightly faster implementation compared to integral images. The extension of the efficient implementation of NCC to SNCC is straightforward, as there is only one additional
(5)
x ∈p (x)
where ρx′′ is defined by the correlation equation (1) and p′ (x) is the set of pixel coordinates of the summation filter. It is important to understand that the summation step in SNCC does not lead to a fattening because the averaging is performed on the cross-correlation values of the NCC stage for each disparity. This is the essence of the improvement of SNCC over NCC. We applied this new matching cost to the patch from Fig. 2a using a 3x3 patch size for the NCC stage. Comparing the resulting correlation values (Fig. 2d) with the results of the standard NCC (Fig. 2c) demonstrates the improvement. With the new SNCC measure the influence of the strong contrast edge is dramatically reduced, though it is still visible by the second peak. The best matching patch for SNCC is depicted by the dashed rectangle in Fig. 2b and shown in Fig. 2g. Comparing the best patch with the template patch (Fig. 2e) reveals that SNCC was not distracted by the high contrast edge of the newspaper but concentrated on finding a good match for most part of the patch. This can be seen for example by the light triangular structure at the top left 229 235
box filter needed for the summation step. Altogether the calculation of the matching cost of one pixel for one disparity takes six multiplications, four additions and five subtractions (not including the precomputation phase). Due to the efficient box filter implementation these numbers of operations are independent of the used filter sizes. Hence, the runtime is O(nd). As mentioned in the introduction, this linear runtime makes traditional stereo approaches very appealing for realtime applications. In contrast, other state-of-the-art algorithms have a less efficient runtime [16] because they are based on non-linear runtime algorithms. Apart from some greedy heuristics the runtime for dynamic programming is O(n2 ). Bilateral filters are not separable, which leads to an overall runtime of O(wnd). Graph-cut is based on the max-flow-min-cut problem which is in the order of O(n2 d2 log(nd)). Practice has shown that the actual runtime is smaller (O(n1.2 d1.3 )) but still non-linear. The only exception is Semi-Global Matching (SGM) [3] whose runtime complexity is also O(nd), however, the number of operations is much larger compared to traditional stereo.
IV. E VALUATION A. Experimental Setup For evaluating our newly proposed cost function, we use the stereo data sets Venus, Tsukuba, Teddy and Cones from the Middlebury benchmark [14]. Fig. 3 displays the left stereo image of the four scenes. We have chosen these scenes because the online table of the Middlebury benchmark enables to compare our results to many other stereo algorithms for different criteria. In the Middlebury benchmark, stereo algorithms are assessed by means of the percentage of bad pixel bp X bp = |Dx − GTx | > δ , (7) x
where D is the disparity map computed by an algorithm, GT is the ground truth disparity, x are the image coordinates of the area of interest and δ the error threshold. The performance assessment of the Middlebury online table encompassed three different areas of interest (all, nonoccluded, discontinuities) and five different error thresholds (0.5, 0.75, 1.0, 1.5, 2.0). For each scene and each of the three areas of interest the creators of the Middlebury benchmark have defined a binary map. We compare our proposed summed normalized crosscorrelation (SNCC) with the standard cost functions sum of absolute differences (SAD), normalized cross-correlation (NCC) and rank transform (RT) [13] using the traditional stereo explained in section III. Please note that we use the same parameters for the stereo algorithm, for all cost functions. Furthermore, the first stage (NCC-stage) of SNCC is always run with a 3x3 filter size, i.e. only the second stage summation area is varied. Similarly, we always use a 11x11 filter for the rank transform, i.e. filter sizes are only varied for the SAD filter applied after the rank transform. We choose an 11x11 filter because this gave the best overall results for RT.
III. T RADITIONAL S TEREO For the evaluations in this paper, we use a traditional stereo implementation that is similar to the approach of Fua [17], which comprises five steps. Firstly, the matching cost is calculated for all pixels and all disparities. From these the best matching is selected (winnertakes all). In a second step follows the interpolation of the disparity to sub-pixel accuracy by fitting a quadratic curve to the matching scores in the neighborhood of the optimum. The third step is a left-right consistency check for detecting occlusions and mismatches, i.e. matches that do not pass the left-right check are considered as wrong. Furthermore, in a fourth step small disparity segments are removed. We consider segments with an area smaller than 200 pixels as invalid. In the final step, invalidated pixels are filled by interpolating from the next left and next right neighbor that have a valid entry. One might argue that comparing stereo cost functions without post-processing would constitute a more direct assessment. However, as was already pointed out in [12], [18], where the same kind of post-processing was used for the assessment of a large set of cost functions, the post-processing reduces the overall error. Without this reduction the large errors impede a fair comparison, while the post-processing increases the discrimination between the costs. Furthermore, we use exactly the same post-processing for all cost functions which renders the gained results comparable. Please note that all four post-processing steps scale linearly with the number of pixels. We restricted the approach to these simple post-processing steps in order to preserve the linear runtime.
B. Experimental Results In the first evaluation, we assess the performance of traditional stereo with the four different cost functions SAD, NCC, RT and SNCC for different filter sizes. Of course, a good cost function should have minimum error for some optimal filter size but in order to generalize well to different scenes the error should degrade gracefully when deviating from this optimum. For all four cost functions we used squared filters of odd sizes from 3x3 to 31x31. Fig. 4 shows the error plots of the four cost functions for an error threshold of 0.5. The first row depicts the results for the non-occluded area of interest, i.e. parts of the scene that are seen in both stereo images. One can observe that SAD and NCC perform similar on Tsukuba but for the other scenes, NCC is better than SAD for small filter sizes. Comparing RT and SNCC with SAD and NCC shows that the former two outperform
230 236
Figure 3.
The left stereo images of the Venus, Tsukuba, Teddy and Cones scene.
15% 10% 5%
5
10
15
20
25
15%
10%
5% 0
30
5
10
window size
25
20%
10% 0
30
5
10
30% 25%
50%
20
25
10
40%
30%
15
20
25
20% 0
30
5
10
window size
60%
30%
20% 0
5
10
15
20
window size
25
40%
30% 0
30
5
10
25
30
30%
5
10
15
20
15
20
25
60%
25
50%
30
window size
15
20
25
30
25
30
20%
5
10
15
20
Cones
40%
window size
30
30%
60%
10
25
window size
SAD NCC RT SNCC
5
20
40%
10% 0
30
50%
30% 0
15
SAD NCC RT SNCC
Teddy 70%
SAD NCC RT SNCC
40%
20% 0
10
window size
bad pixels: disc
40%
50%
5
Cones
50%
Tsukuba 60%
SAD NCC RT SNCC
bad pixels: disc
bad pixels: disc
50%
20
10%
60%
SAD NCC RT SNCC
window size
Venus 60%
15
15%
window size
bad pixels: disc
5
20%
5% 0
30
20% 15% 0
25%
Teddy 70%
SAD NCC RT SNCC
bad pixels: disc
35%
15
30%
SAD NCC RT SNCC
window size
Tsukuba 60%
SAD NCC RT SNCC
bad pixels: disc
bad pixels: disc
40%
20
30%
window size
Venus 45%
15
40%
Cones 35%
SAD NCC RT SNCC
bad pixels: disc
0% 0
20%
Teddy 50%
SAD NCC RT SNCC
bad pixels: nonocc
20%
bad pixels: nonocc
bad pixels: nonocc
Tsukuba 25%
SAD NCC RT SNCC
bad pixels: nonocc
Venus 25%
25
30
50%
SAD NCC RT SNCC
40% 30% 20% 10% 0
5
10
15
20
window size
Figure 4. The performance of the traditional stereo for the non-occluded (nonocc) and depth discontinuity (disc) areas of interest. The plots show the percentage of bad pixels against the patch window size for the proposed two-stage matching SNCC compared to SAD, NCC and RT. The first row shows results obtained for the non-occluded regions. The second row shows results obtained for depth discontinuities. The last row shows again the discontinuity case but this time without any postprocessing. It can be seen that SNCC (red curves) outperforms all the other cost functions considerably.
the latter two for Venus, Teddy and Cones. It strikes that all four cost functions perform similar for Tsukuba. One reason could be that the Tsukuba scene is overall more homogeneous than the other scenes. Therefore, matching costs taking structure into account cannot extract additional information. Another thing to note is the minor difference between the optimal performance of RT and NCC. However, RT degrades much more gracefully with increasing filter size. At first glance this difference in performance for the non-occluded area of interest seems puzzling. However, as was shown in section II-A strong contrast edges can influence their surrounding depending on the filter size. This also explains why NCC has a similar performance to RT for smaller filter sizes but gets worse for larger filter
sizes. RT and SNCC both reduce the influence of high contrast edges on the surrounding and hence degrade much more gracefully beyond their optimal point. Comparing the performance of RT and SNCC reveals that SNCC and RT are similar for scenes with few occlusions (Venus, Tsukuba) but that SNCC is substantially better for scenes with many occlusions (Teddy, Cones). In particular SNCC is much better than NCC which confirms our approach. The observations made for the non-occluded area of interest are even more pronounced for the depth discontinuity area of interest (disc) shown in the second row of Fig. 4. The characteristics for SAD and NCC are similar to the non-occluded area but the performance decreases more rapidly for increasing filter sizes and seems to settle for 231 237
50% SAD NCC RT SNCC
40%
bad pixels: nonocc
bad pixels: nonocc
50%
30%
20%
10% 1/1
1/2
1/3
2/1
2/2
2/3
3/1
3/2
3/3
SAD NCC RT SNCC
40%
30%
20%
10% 1/1
1/2
1/3
2/1
2/2
2/3
3/1
3/2
3x3 left/right image combinations
3x3 left/right image combinations
(a) Different exposure
(b) Different lighting
3/3
Figure 5. The performance of SAD, NCC, RT and SNCC under lighting and exposure changes. i/k denotes that the left image had lighting or exposure i and the right image lighting or exposure k.
the largest filter sizes. Comparing again RT with SNCC shows that SNCC is clearly better at preserving the correct position of depth discontinuities for all scenes. Moreover, SNCC is significantly better than NCC, which confirms our argumentation of section II. The last row of Fig. 4 shows the results for the depth discontinuity area of interest (disc) of the four cost functions without any post-processing. Indeed, the characteristics are quite similar to the post-processing regime. However, as was pointed out above the overall error is increased. In a second evaluation, we investigated to which extend SNCC keeps the illumination invariance properties of NCC. For doing so, we used the Art, Books, Dolls, Laundry, Moebius and Reindeer stereo images [12] of the Middlebury database. These are stereo scenes taken under three different lighting conditions and three different exposures. In accordance to [12], we used all possible combinations of lighting for the left and right image, i.e. nine different lighting pairs for each scene. We did the same for exposure. Fig. 5 shows the result for the nine lighting and nine exposure pairs averaged over all six scenes. It demonstrates that SNCC indeed has the same invariance properties as NCC even though it is working with small filter sizes for the NCCstage. We also submitted the results of our proposed SNCC cost function to the online Middlebury stereo evaluation. For this submission we used a non-square filter as it turned out that for SNCC vertical elongated filters produce slightly better results. The best overall results were achieved with a 5x9 filter for the second stage but the first stage was left untouched with a filter size of 3x3. Table I shows a small snapshot of the online Middlebury benchmark for an error threshold of 0.5 comparing SNCC to some selected stereo algorithms. For a full overview, which features also other error thresholds, please visit [19]. The small numbers next to the percentage of bad pixel indicate the rank among the 87 algorithms that have been in the online table at the time of our submission. For many of the criteria, our approach is among the top ten algorithms. For the Cones scene, our approach yields the best result for the non-occluded area of interest. Usually, the top ranks are held by state-of-the-
Figure 6. From top to bottom these are disparity maps of the Venus, Tsukuba, Teddy and Cones scene. The first column shows the ground truth depth data and the second column the result of the proposed SNCC for traditional stereo. Near pixels are bright and far pixels are dark.
art approaches based on Belief Propagation, Graph Cut, Bilateral Filtering or Dynamic Programming. In contrast our results highlight that by means of SNCC the traditional stereo approach is able to get closer to the performance of state-of-the-art approaches. The only exception is the Tsukuba scene. Although the traditional stereo approach with SNCC has a high ranking for the whole scene and the non-occluded area of interest, it has a very bad rank of 74 for the depth discontinuities. One reason for this might be that the Tsukuba scene is overall more homogeneous than the other test scenes. This means that the normalized cross-correlation in the first stage probably yields low matching values for many parts of the scene. Here approaches based on pixel-intensity matching are advantageous because they can relate depth discontinuities to discontinuities in intensity For a visual comparison, Fig. 6 depicts the disparity maps (right column) that correspond to the SNCC results in Table I together with the ground truth maps (left column). What strikes most are the local artifacts that are mainly due to the 232 238
Table I A
SMALL SNAPSHOT OF THE ONLINE M IDDLEBURY BENCHMARK AT THE TIME OF OUR SUBMISSION . I T GIVES A COMPARISON OF OUR APPROACH TO B ELIEF P ROPAGATION (BP) [2], S EMI -G LOBAL M ATCHING (SGM) [3], FAST B ILATERAL S TEREO (FBS) [6] AND THE A DAPTIVE W EIGHT APPROACH (AW) [5]. T HE NUMBERS DENOTE THE PERCENTAGE OF BAD PIXELS ( PIXELS WHOSE DISPARITY DIFFERS MORE THAN 0.5 FROM THE GROUND TRUTH DATA ) AND THE SUBSCRIPT NUMBERS DENOTE THE RANK AMONG THE 87 ALGORITHMS COMPARED IN THE ONLINE BENCHMARK AT THE TIME OF SUBMISSION .
cost
BP SGM FBS AW SNCC
noocc 1.596 4.5522 5.7126 7.7742 2.359
Venus all 2.347 5.3823 6.6630 8.4043 3.2310
disc 6.945 15.741 14.937 15.842 15.440
noocc 6.214 13.430 21.553 18.137 11.320
Tsukuba all 7.967 14.329 22.454 18.836 12.318
disc 24.564 20.338 22.955 18.624 27.574
Table II COMPARISON OF THE ABSOLUTE RUNTIME FOR THE T EDDY SCENE OF SNCC AND SELECTED ALGORITHMS : S EMI -G LOBAL M ATCHING (SGM), B ELIEF P ROPAGATION (BP), FAST B ILATERAL S TEREO (FBS), G RAPH -C UT (GC) AND THE BILATERAL FILTERING APPROACH A DAPTIVE W EIGHT (AW).
CPU speed 1x3.0 GHz 1x2.8 GHz 1x2.8 GHz 2x2.14 GHz 1x2.8 GHz 2x2.14 GHz
Teddy all 17.310 18.514 23.342 23.944 15.24
disc 22.53 26.112 32.146 34.059 28.624
noocc 4.732 4.934 9.1025 14.049 4.711
Cones all 14.622 12.511 15.829 19.745 11.14
disc 10.71 13.58 18.132 20.640 13.26
a normalized cross-correlation (NCC) with a very small filter in the first stage and that subsequently aggregates the resulting correlation coefficients in the second stage. We motivated theoretically that this two-stage processing should reduce the fattening effect which NCC is usually prone to. These theoretical considerations were confirmed by means of experimental results achieved using Middlebury stereo benchmark scenes. By comparing our proposed SNCC measure with common cost functions for the traditional stereo approach, we could show that SNCC significantly improves the performance and for small error thresholds comes even close to the performance of sophisticated, yet computational much more demanding, state-of-the-art stereo approaches. We showed that SNCC can be implemented very efficiently using box filters. By doing so, stereo maps are computed in O(nd).
A
algorithm SNCC SGM [3] BP [3] FBS [6] GC [3] AW [6]
noocc 7.782 11.011 16.240 17.647 10.69
runtime (sec) 0.14 1.3 4.2 32 55 3226
simple fill-in mechanism we used. This is seen best in the disparity map of the Tsukuba scene. For example, a part of the table leg is smeared to the right. These artifacts could be reduced by using an appearance-based fill-in that takes the original pixel information into account. Nevertheless, the quality of the disparity maps is already very good which again highlights the improvements that can be achieved using SNCC.
Our analysis still misses some important investigations that have to be covered in future work. First, we have to analyze the performance of SNCC in the presence of noise. It has to be investigated how the choice of the filter sizes of the two stages influences the performance for different levels of noise. Second, the number of scenes used for testing was limited. It is of particular interest, if SNCC is really beneficial for challenging real-world scenarios. Last but not least, we focused our comparison only to the fastest cost functions and it would also be interesting how SNCC performs with respect to slower but more powerful cost functions. For example a recent comparison of 15 cost functions [18] has shown that census transform has a better performance than rank transform.
C. Runtime In section II-C, we argued that linear runtime stereo algorithms are best suited for real-time applications and that SNCC can be implemented as such. As we did only a coarse estimation of the theoretical runtimes of the other algorithms, Table II compares the absolute runtimes for the Teddy scene of our SNCC with some selected approaches. Please note that such a comparison, although quite common, is only a very rough one. The problem is that the actual runtime of a piece of code depends among other things on the CPU speed and cache, programming language, hardware architecture and most importantly on the skill of the programmer. Nevertheless, the comparison confirms that stateof-the-art stereo approaches cannot cope with the speed of the traditional stereo approach.
Our future work will cover also other domains of image processing. We want to investigate if the SNCC measure is able to improve the traditional optical flow algorithm as this is closely related to stereo processing. Moreover, the idea behind SNCC could be used in any application that uses NCC and suffers from the fact that NCC fails in the presence of high contrast outliers. For example, visual tracking or object detection could also benefit from this new cost function.
V. S UMMARY In this paper, we proposed the summed normalized crosscorrelation (SNCC), a new cost function for the traditional stereo computation. It is a two-stage approach that performs 233 239
R EFERENCES
[10] H. Hirschm¨uller, P. R. Innocent, and J. M. Garibaldi, “Realtime correlation-based stereo vision with reduced border errors,” International Journal of Computer Vision, vol. 47, no. 1-3, pp. 229–246, 2002.
[1] Q. Yang, L. Wang, R. Yang, H. Stewenius, and D. Nister, “Stereo matching with color-weighted correlation, hierarchical belief propagation, and occlusion handling,” IEEE Transactions on Pattern Analysis and Machine Intelligence, vol. 31, pp. 492–504, 2008.
[11] S. Birchfield and C. Tomasi, “A pixel dissimilarity measure that is insensitive to image sampling,” IEEE Transactions on Pattern Analysis and Machine Intelligence, vol. 20, pp. 401– 406, 1998.
[2] A. Banno and K. Ikeuchi, “Disparity map refinement and 3d surface smoothing via directed anisotropic diffusion,” in 3-D Digital Imaging and Modeling, 2009, pp. 1870–1877.
[12] H. Hirschm¨uller and D. Scharstein, “Evaluation of cost functions for stereo matching,” in IEEE Computer Society Conference on Computer Vision and Pattern Recognition, 2007.
[3] H. Hirschm¨uller, “Accurate and efficient stereo processing by semi-global matching and mutual information,” in IEEE Computer Society Conference on Computer Vision and Pattern Recognition, 2005, pp. II: 807–814.
[13] R. Zabih and J. Woodfill, “Non-parametric local transforms for computing visual correspondence,” in Proceedings of ECCV, 1994, pp. 151–158.
[4] Y. Deng and X. Lin, “A fast line segment based dense stereo algorithm using tree dynamic programming,” in ECCV, 2006, pp. III: 201–212.
[14] D. Scharstein and R. Szeliski, “A taxonomy and evaluation of dense two-frame stereo correspondence algorithms,” International Journal of Computer Vision, vol. 47, no. 1-3, pp. 7–42, April-June 2002.
[5] K.-J. Yoon and I. S. Kweon, “Adaptive support-weight approach for correspondence search,” IEEE Transactions on Pattern Analysis and Machine Intelligence, vol. 28, pp. 650– 656, 2006.
[15] D.-M. Tsai and C.-T. Lin, “Fast normalized cross correlation for defect detection,” Pattern Recognition Letters, vol. 24, no. 15, pp. 2625–2631, 2003.
[6] S. Mattoccia, S. Giardino, and A. Gambini, “Accurate and efficient cost aggregation strategy for stereo correspondence based on approximated joint bilateral filtering,” in ACCV09, 2009, pp. II: 371–380.
[16] M. Z. Brown, D. Burschka, and G. D. Hager, “Advances in computational stereo,” IEEE Transactions on Pattern Analysis and Machine Intelligence, vol. 25, pp. 993–1008, 2003.
[7] V. Kolmogorov and R. Zabih, “Multi-camera scene reconstruction via graph cuts,” in European Conference on Computer Vision, 2002, pp. III: 82–96.
[17] P. Fua, “A parallel stereo algorithm that produces dense depth maps and preserves image features,” Machine Vision and Applications, vol. 6, no. 1, pp. 35–49, 1993.
[8] H. Wersing, S. Kirstein, M. Goetting, H. Brandl, M. Dunn, I. Mikhailova, C. Goerick, J. J. Steil, H. Ritter, and E. Koerner, “Online learning of objects in a biologically motivated visual architecture,” International Journal of Neural Systems, vol. 17, no. 4, pp. 219–230, 2007.
[18] H. Hirschm¨uller and D. Scharstein, “Evaluation of stereo matching costs on images with radiometric differences,” IEEE Transactions on Pattern Analysis and Machine Intelligence, vol. 31, no. 9, pp. 1582–1599, September 2009.
[9] F. Oniga, S. Nedevschi, M. Meinecke, and T. B. To, “Road surface and obstacle detection based on elevation maps from dense stereo,” in IEEE Intelligent Transportation Systems Conference, 2007, pp. 859–865.
[19] http://vision.middlebury.edu/stereo/eval.
234 240