Volume 3, No. 3, March 2012 Journal of Global Research in Computer Science RESEARCH PAPER Available Online at www.jgrcs.info
A UML MODEL FOR MEASURING THE PERFORMANCE OF STUDENTS USING OBJECT ORIENTED APPROACH Dr. Gufran Ahmad Ansari Assistant Professor Department of Information Technology College of Computer, Qassim University Al-Qassim, Kingdom of Saudi Arabia (KSA)
[email protected] Abstract- Nowadays, most of the universities and schools are facing problems to check the performance of the student during or at end of the course. Because the universities and schools are time bounded and due to that there is a current need to get a model that helps to check the performance of the above problem. In this paper author proposed a Unified Modeling Language (UML) class model for checking the performance of above problem. After getting the results from UML, the students will receive valuable suggestions to improve their performance of a particular course or overall course. Author also proposed a Sequence diagram and Activity diagram for the above model. Keywords: UML Class Diagram, Student, Performance, Sequence Diagram, Activity Diagram.
INTRODUCTION The Unified Modeling Language (UML) is an excellent and well known powerful recognized leading diagrammatic modeling language. UML is used to design model and scientific research problems [1, 2]. UML is broadly accepted modeling language by industry people and academia to model a software system[3].The Object Management Group (OMG) start on the UML approach for the software designers and researchers to construct, valuable, effective and efficient software for the industry and it is explained in a extremely simple and clear way[4, 5]. Modeling is very essential part for understanding the real time problems. UML model accepts a vision of a real world system and describe in the form of pictures and notations. UML is a well-defined modeling language which is a precise syntaxes and semantics that can be interpreted and altered by a computer. It has nine standard diagrams for graphical representation of a system. The different points of view of the system are (Classes, Objects, Use, State, Activities, Interaction-Sequence, Interaction-communication, Components and Display). The standards and recent developments of UML are available on [6, 7]. The quality explanation of UML diagrams and notations are available in [8, 9]. Recently, Saxena and Ansari proposed different UML model which is based on specific domains [10, 11]. Performance is the level to which a software system or mechanism meets its objective for appropriateness [12]. The beginning performance analysis can be helpful to avoiding performance failure in software [13]. However, it takes time and attempt to derive the necessary performance models. In existing literature, a small work was found to checking the performance of UML model of distributed system various programming languages, but they are generally based on their features, technological similarities and abilities [14]. Zhen Shen and Zhuang explained in a very simple manner how to improve network performance using UML [15]. M. Butow et, all define and describe in a easy way about checking performance of models using UML and also approaches analysis that fit in temporal aspects into SDL specifications, can be applied [16,176]. There are very few © JGRCS 2010, All Rights Reserved
papers are available for checking the performance of model using an Object-oriented approach. There are a number of benefits to adopting the UML. First the UML provides the facility of high-level information that differentiates the internal behavior of components, which can be processed efficiently and used successfully when testing the software. The second UML has emerged as the industry standard for software modeling notations and diagrams. The third UML includes a set of models that can provide different levels of capacity and accuracy for component modeling, and thus can be used to satisfy various needs in the real world. In the present paper, a well known modeling language UML is used to propose to check the performance of a student in a particular course. UML CLASS MODEL FOR CHECKING PERFORMANCE OF STUDENTS
THE
The UML class model shows the structural activities of the system, in which attributes and operations are designed. Different properties like association, aggregation, inheritances in the form of sub classes are designed and shown in the UML class model. The complete UML modeling has been done for checking the performance of student in a particular course or whole course with class concepts which is shown in Fig.1. The present paper shows the complete process of checking the performance of student which is studies in university or school along with subjects and course are explained in the form of UML class diagram. The UML class model contains six major classes like Student_Detail, Type of Course, S_Marks_Caluclation, S_Performace, Postgraduate and
1
Gufran Ahmad Ansari et al, Journal of Global Research in Computer Science, 3 (3), March 2012, 1-4
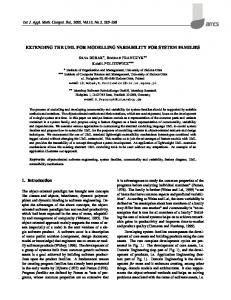
Undergraduate class have all information about undergraduate courses. Postgraduate and Undergraduate classes have a multiple association with S_Marks_Calculation and S_Marks_Calculation has also multiple association with Postgraduate and Undergraduate class. S_Performance class has a multiple association with S_Marks_Calculation and also S_Marks_Calculation has a multiple association with S_Performance class. S_Performance class calculates the performance of a student in a particular course. UML ACTIVITY DIAGRAM
Figure. 1 UML Class Model for Checking the Performance of Students
An activity diagram is a dynamic diagram that represents the activity and event. The activity diagram represents the different activities step by step with the carrying for both conditional and equivalent behavior. Basically the activity diagram is the alteration of state diagram in which most of the states are activity. The activity diagram of the above UML class model is shown in Fig.2. The activity diagram shows the complete process of checking the performance of students in a particular course or whole course. According to the activity diagram the student can do the registration in a particular course. After getting the registration in a particular course and subject student can study postgraduate course or undergraduate courses. After end of the course or in the class test student must appear for the exam. After evaluating the answer sheet display the results of a particular course or all courses. Finally students can view their performance of an individual course or whole courses. UML SEQUENCE DIAGRAM A sequence diagram is a set up of objects and messages. The sequence diagram is given for the above model in Fig. 3. Which is shows the checking of the performance of a student in a particular course or whole course. It has five main objects which are shown on the top of the diagram in a rectangles box with their class name. The five objects are Student, Course Details, and Study Exam and Performance.
Figure. 2 UML Activity Diagram for Checking the Performance of Student
Undergraduate. The Student_Details class has a multiple association with Type of Course class and Type of Course class has a single association with Student_Details class. Student_Details class have all the information about the students and Type of Course class have all the information's about the course that are running by the university or colleges. Type of Course class has a single association with Postgraduate and Undergraduate class. Similarly Postgraduate and Undergraduate class have a multiple association with Type of Course class. Postgraduate class has all information about the Postgraduate courses and © JGRCS 2010, All Rights Reserved
Figure. 3 UML Sequence Diagram for Checking the Performance of Student
The communication of information between two objects is represented by an arrow and message on that arrow. The vertical lines show the life of the objects. According to the sequence diagram the students register a course in a 2
Gufran Ahmad Ansari et al, Journal of Global Research in Computer Science, 3 (3), March 2012, 1-4
university or college and admitted in a particular course. After taking the admission of particular course, a student can go through the course and appear the exam and view the performance and result. EXPERIMENTAL STUDY For measuring the performance of the students in a particular course grading system is considered under Qassim University. The layout of grading system is displayed in Table 1. Where each subject is have maximum 100 marks and minimum marks 60. The UML model is using the OOP approach. The model is converted in namely C++. I have collected many samples from the record of my students in Qassim University Saudi Arabia. One of the samples is shown in Table 1. The program has been tested with all these samples. Comparing the program results with the manually calculated ones, all are identical. This proves the correctness of the proposed model. The proposed model emphasize that the main contribution of this work is the UML class model. The proposed model tested with more than 500 sample data's and it gives a better result, fast and accurate than the manual calculations. It saves a lot of time that calculated by human and also prevent with human errors. Table 1 Student Marksheet
Figure. 4 Output Screen for Checking the Performance of Student
The bar chart for checking the performance of students in a particular course or whole course is given in Fig. 5. The brown color bars showing that the maximum marks of each course and yellow bars shows the minimum marks of each course. The blue bar shows the performance of each course attempt by the students. The last red bar of the chart is showing overall performance of the student in a whole course.
Figure. 5 Bar Char for Checking the Performance of Student
RESULTS AND DISCUSSIONS
ALGORITHM FOR PROPOSED MODEL Step1: Read SID, SName and Subjects Step2: Set Total = Sub-1+Sub-2+Sub3+Sub-3+Sub-4+Sub-5 Step 3: Per% = Total * 100/500 Step 4: IF per