International Journal of PharmTech Research CODEN (USA): IJPRIF ISSN : 0974-4304 Vol.3, No.3,pp 1293-1298, July-Sept 2011
A Validated Rp-Hplc Method for estimation of Dexibuprofen and Paracetamol in combined tablet dosage form. P.Balan*1, I. Carolin Nimila1, Vanaja Rani Movva1, M. Lakshmi Prasanna1, S.Rajasekar1. 1
Department of Pharmaceutical Analysis, Faculty of Pharmacy, PRIST University, Thanjavur -614904, Tamilnadu, India. Corres. author:
[email protected], Tel: (91)9698798284.
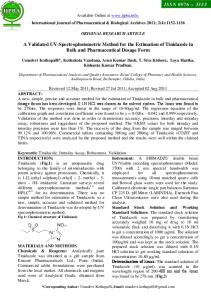
Abstract: A simple, sensitive, precise and specific reverse phase high performance liquid Chromatographic method was developed and validated for the determination of Dexibuprofen and Paracetamol in combined tablet dosage form .The method was validated as per ICH guidelines. The separation was carried out by using a mobile phase consisting of Acetonitrile: water in ratio of 50: 50 pH 7.8 adjusted with Triethylamine. The column used was C18, 250 × 4.5 mm with flow rate of 1.0 ml / min using UV detection at 230 nm. The described method was linear over a concentration range of 2-10 μg/ml (r2 =0.999485 and0.999433) for Dexibuprofen and Paracetamol respectively. The retention times of Dexibuprofen and Paracetamol were found to be 1.763 and 2.463 min respectively. Results of analysis were validated statistically and by recovery studies (mean recovery=100.1%for Dexibuprofen and100.6% for Paracetamol). The limit of quantification (LOQ) for Dexibuprofen and Paracetamol were found to be 0.06 and 0.16 μg/ml respectively. The results of the study showed that the proposed RP-HPLC method is simple, rapid, precise and accurate, which is useful for the routine determination of Dexibuprofen and Paracetamol in its pharmaceutical dosage form. Keywords: Dexibuprofen, Paracetamol, Method development, validation. INTRODUCTION Dexibuprofen, (S+ Enantiomer of Ibuprofen) is (S-2-(4-lsobutylphenyl)-propionic acid) [1]. It is a widely used nonsteroidal anti-inflammatory drug [Figure1]. It is used as symptomatic treatment for osteoarthritis, primary dysmenorrhoea, muscularskeletal pain or dental pain. It reduces gastric damage and improves analgesic and anti-inflammatory effect than racemic ibuprofen [4]. There is only one method reported for Dexibuprofen alone which is stability indicating HPTLC method [5]. Paracetamol is N(4-Hydroxyphenyl) acetamide [2, 3]. It is antipyretic and analgesic [Figure
2]. Paracetamol alone or in combination with other drugs is reported to be estimated by spectrophotometric method [6, 7, 8, and 9]. So far, no method has been reported for estimation of Dexibuprofen and Paracetamol in combined dosage forms, hence we attempted to develop a simple, accurate, and economical analytical method. This paper describes validated RP-HPLC for simultaneous estimation of Dexibuprofen and Paracetamol in combination using acetonitrile: water in the ratio of 50: 50 with pH 7.8. The column used was C-18 with flow rate of 1.0ml / min using UV detector at 230nm
P.Balan et al /Int.J. PharmTech Res.2011,3(3)
Fig1: Structure of Dexibuprofen
Fig2: Structure of Paracetamol
MATERIALS AND METHODS: Instrumentation:HPLC was performed on a High performance liquid chromatography equipped Waters-515 pump and 2489 UV/VIS detector and RP-C18 column was used. A Rheodyne injector with a 20 μl loop was used for the injection of sample. The data processing was performed using EM-Power software. Standards and Chemicals:Standard bulk drug sample Dexibuprofen and Paracetamol were provided by SHASUN Laboratories Ltd.Puduchery. Tablets of combined dosage form were procured from the local market (BRUTEK-P, Zuventis, Mumbai). All other reagents used were of HPLC grade. Chromatographic Conditions:The mobile phase used in this study was a mixture of Acetonitrile and water (pH 7.8) in the ratio 50:50.The pH was adjusted using Triethylamine. The mobile phase was filtered on a 0.45 micron membrane filter and then ultrasonicated for 15 min. Stationary phase was C18 reverse phase column (250×4.5mm) dimensions at ambient temperature. Flow rate 1.0ml/min; detection wavelength 230nm; injection volume 20μl. The retention time was found to be 1.763 and 2.463 min for Dexibuprofen and Paracetamol respectively. The run time was for 5 minutes. The chromatographic conditions were given in Table1.
1294
Table 1: Optimized Chromatographic Conditions Parameter Optimised Condition Chromatograph HPLC Waters Column RP-C18, Column (250 × 4.5 mm) Mobile Phase Acetonitrile: water( 50 : 50) pH adjusted to 7.8 Flow rate 1 ml/min Detection wavelength 230 nm Injection volume 20μl column Temperature Ambient
Preparation of stock solution: Take 6mg of Dexibuprofen and 10mg of Paracetamol standard drugs in 10ml volumetric flask and make up with mobile phase. Then 0.1ml of solution was taken and made up to 10ml so that final concentrations are 6 and 10 µg/ml. Preparation of sample solution: A total of 20 tablets were accurately weighed and triturated with a mortar and pestle. An amount equivalent to one tablet (containing 300 mg of Dexibuprofen and 500mg of Paracetamol) was transferred to a 50ml volumetric flask; 50 ml of mobile phase was added and the flask was kept in an ultrasonic bath for 15 min. The volume was made up to mark with mobile phase and the solution was filtered through0.45 micron membrane filter. The final volume of the solution was made up to 10 ml with mobile phase to get stock solutions containing 6μg/ml Dexibuprofen and 10μg/ml Paracetamol. The diluted solution (10μg/ml) was analyzed under optimized chromatographic conditions and chromatogram is depicted. The results of analysis are given in Table 2 and the chromatogram was given in Fig 3. VALIDATION METHODS Linearity: Linearity was demonstrated by analysing five different concentrations of active compound. Peak areas were recorded, for all the peaks and calibration plot was constructed by plotting peak area Vs concentrations of Dexibuprofen and Paracetamol which were found to be linear in the range of 2µg-10µg/ml respectively. Coefficient of correlation was 0.999485 and 0.999433 respectively. The calibrations curves were given in Fig 4.
P.Balan et al /Int.J. PharmTech Res.2011,3(3)
1295
Fig3: Chromatogram of Dexibuprofen and Paracetamol
Fig 4: Calibration curve of Dexibuprofen and Paracetamol
Table 2: Results of Analysis of Tablet Formulation Parameters Dexibuprofen % Estimated 100.2% Standard deviation 9406.978 Limit of Detection (LOD) 0.02µg/ml Limit of Quantitation (LOQ) 0.06µg/ml % RSD 0.29
Paracetamol 100% 17199.8 0.05µg/ml 0.16µg/ml 0.27
P.Balan et al /Int.J. PharmTech Res.2011,3(3)
1296
Table 3: System Suitability Parameters Parameters Dexibuprofen
Paracetamol
Linearity range
2-10µg/ml
2-10µg/ml
Correlation coefficient
0.999485
0.999433
Slope
40083.95
63011.3
Retention time
1.763min
2.463min
Resolution factor USP plate count USP tailing
1.64 1835 1.06
2126 1.27
Table 4: Recovery Study Data Dexibuprofen % Estimated % RSD
Parameters
Paracetamol % Estimated % RSD
50%
99%
1.72
100.6%
0.42
100%
100.2%
0.29
100%
0.27
150%
100.1%
0.41
100.06%
0.52
Table 5: Results for Precision Study Intra day assay Drug Dexibuprofen Paracetamol
% Obtained 100.2% 100%
Inter day assay
% RSD
% Obtained
% RSD
0.29 0.27
99.4% 100.6%
0.406 1.88
*Mean of six determinations (n=6) Table 6: Results of Robustness Study Factor
Level
pH of Mobile Phase
7.6
Flow rate % of Acetonitrile
Retention time %RSD Dexibuprofen Paracetamol Dexibuprofen Paracetamol 1.715 2.406 0.252 1.23
8.0
1.710
2.350
1.55
0.51
0.9 1.1 48 52
1.874 1.557 1.724 1.697
2.585 2.138 2.403 2.390
0.93 0.75 1.79 0.56
0.45 0.53 0.41 0.54
Accuracy: The accuracy of the method was determined on three concentration levels by recovery experiments. The recovery studies were carried out six times by spiked placebo recovery method and the percentage recoveries with standard deviations [SD] were
calculated. From the data obtained in Table 4 the method was found to be sufficiently accurate. Precision: To demonstrate agreement among results, a series of measurements are done with Dexibuprofen and Paracetamol six replicate injections of the specific
P.Balan et al /Int.J. PharmTech Res.2011,3(3)
standard at various time intervals on the same day and on different days were injected. Percentage relative standard deviation (%RSD) was found to be less than 2% for within a day and day to day variations, which proves that method is precise. The results for precision are given in Table 5. Limit of Detection and Limit of Quantification: The limit of Detection (LOD) and limit of Quantification (LOQ) of the developed method were determined by injecting progressively low concentrations of the standard solutions using the developed RP-HPLC method. The LOD is the smallest concentration of the analyte that gives a measurable response (signal to noise ratio of 3). The LOQ is the smallest concentration of the analyte, which gives response that can be accurately, quantified (signal to noise ratio of 10).The values of LOD and LOQ were given in Table. 2. Ruggedness and Robustness Robustness of the method was determined by making slight changes in the chromatographic conditions, such as change in composition of mobile phase, flow rate and pH of mobile phase. It was observed that there were no marked changes in the chromatograms, which demonstrated that the RP-HPLC method developed is rugged and robust. The robustness limit for mobile phase variation, flow rate variation, and temperature variation are well within the limit, which shows that the method is having good system suitability and precision under given set of conditions and were within the acceptance criteria of not more than 2%. The results for robustness were given in Table. 6. RESULTS AND DISCUSSION: In order to develop an effective method for the analysis of the drugs in pharmaceutical formulations, preliminary tests were performed in order to select
REFERENCES: 1. Budavari S., The Merck Index, Edn.12, Merck Research Lab., Division of Merck and Co., Inc., Whitehouse Station, N.J., 1996, 9. 2. British Pharmacopoeia. Vol. II, London: Her Majesty's Stationary Office; 1998. p.1854. 3. Indian Pharmacopoeia Vol. II, New Delhi: The Controller of Publications, Govt. of India; 1996. p.554.
1297
adequate and optimum conditions. Parameters such as detection of wavelength, ideal mobile phase and their proportions, optimum pH and concentration of the standard solution were studied. Several binary or ternary eluents were tested using various proportions of solvents including acetonitrile and water with various proportions. The flow rate of 1.0 ml/min for the mobile phase was selected after these preliminary tests. The goal of this study was to develop a rapid HPLC method for the analysis of Dexibuprofen and Paracetamol in a finished tablet formulation using a commonly employed reverse phase C-18 column with UV detector. The proposed method is simple, rapid and statistically validated for its accuracy. No interfering peaks were found in the chromatograms indicating that the tablet excipients did not interfere in analysis of drugs. The calibration curve showed linearity over a concentration range of 2 to 10 μg/ml for both drugs and was linear with a correlation coefficient of 0.999485 and 0.999433 for Dexibuprofen and Paracetamol respectively. CONCLUSION The proposed method was found to be simple, precise, accurate and rapid for determination of Dexibuprofen and Paracetamol from tablet dosage form. The mobile phase is simple to prepare and economical. The sample recoveries in formulation were in good agreement with their respective label claims. Hence, it can be easily and conveniently adopted for routine analysis of Dexibuprofen and Paracetamol in tablets. ACKNOWLEDGEMENTS The authors are grateful to Department of Pharmaceutical Analysis, PRISTUNIVERSITY, Thanjavur for providing facilities for the research work. The authors are thankful to SHASUN Pharmaceuticals Ltd., Puduchery, India for providing gift samples of Dexibuprofen and Paracetamol.
4. Bonabello A., Galmozzi M.R., Canaparo R., Isaiah G.C., Serpe L., Muntoni E., and Zara G.P., Dexibuprofen (S(+)-Isomer Ibuprofen) Reduces Gastric Damage and Improves Analgesic and Antiinflammatory Effects in Rodents, Anesth Analg, 2003, 97, 402–8. 5. Sohan S. Chitlange., Nitin Kumar., Stability indicating HPTLC method for estimation of Dexibuprofen in pharmaceutical dosage
P.Balan et al /Int.J. PharmTech Res.2011,3(3)
1298
2009,
Spectrophotometry and chemometric methods, J. Pharm. Biomed Anal., 2002, 28 (6), 1091-1100.
6. Nogowska M., Muszalska I., Zajac M.,Simultaneous spectrophotometric determination of acetyl salicylic acid, Paracetamol and caffeine in pharmaceutical preparations, Chem.Anal. (Warsaw), 1999, 44 (6), 1041-1048.
8. Zarapkar S.S., Hulkar U.P., Bhandari N.P., Reverse phase HPLC determination of Ibuprofen, paracetamol and Methocarbamol in tablets, Indian Drugs, 1999, 36 (11),710-713.
form.,Journal of 2(9),1542-1546
Pharmacy
Research
7. Dinc E., Yucesoy c., Onur F., Simultaneous spectrophotometric determination of mefenamic acid and paracetamol in pharmaceutical preparations using ratio spectra derivative
9. Liang Y.R., Hu J., Wu H.L, Le L.Y., Wang W.J., Determination of Paracetamol and Amantadine HCl tablets in pharmaceuticals by HPLC, TLC and CRM,Yaowu Fenxi Zazhi (Chinese), 2006, 26 (3), 411-414.
*****