Simple and Validated RP-HPLC Method for the Estimation of Valsartan in ... carried out on a Phenomenex C18 (250 mm x 4.6 mm i.d., 5 µ) column with a .... columns of similar type like Hypersil C18, Phenomenex C18 and Hichrom C18.
Available online www.jocpr.com
Journal of Chemical and Pharmaceutical Research, 2012, 4(9):4235-4239
Research Article
ISSN : 0975-7384 CODEN(USA) : JCPRC5
Simple and Validated RP-HPLC Method for the Estimation of Valsartan in Pharmaceutical Tablet Dosage Form Selvadurai Muralidharan*, Jaya Raja Kumar and Sokkalingam Arumugam Dhanaraj Faculty of Pharmacy, AIMST University, Malaysia _____________________________________________________________________________________________ ABSTRACT A simple, selective, rapid, precise and economical reverse phase high pressure liquid chromatographic method has been developed for the estimation of valsartan (VALS) from pharmaceutical Tablet dosage form. The method was carried out on a Phenomenex C18 (250 mm x 4.6 mm i.d., 5 µ) column with a mobile phase consisting of acetonitrile: 5mM ammonium acetate (adjusted to pH 4.5 using orthophosphoric acid) (75:25 v/v) at a flow rate of 1.0 ml/min. Detection was carried out at 240 nm The retention time of valsartan was 3.702 min. The developed method was validated in terms of accuracy, precision, linearity, limit of detection, limit of quantitation and solution stability.The proposed method can be used for the estimation of these drugs in dosage forms. Keywords: Valsartan; Method development & validation; Tablet Estimation _____________________________________________________________________________________________ INTRODUCTION Valsartan, (S)-N-valeryl-N-[2ıOE-(1H-tetrazol-5-yl)biphenyl-4-yl)methyl] valine, is a potent, highly selective, orally active, specific angiotensin II receptor antagonist used as a hypotensive drug[1-3]. Only limited methods have been reported in Spectroscopy, HPLC and LC-MS [4-11]. The aim of this study is development of a simple, precise, rapid and accurate reverse phase HPLC method for the estimation of valsartan in tablet dosage form. The present work describes the development of a validated RP-HPLC method in pharmaceutical dosage form. The present RPHPLC method was validated following the ICH guidelines (12). EXPERIMENTAL SECTION Reagents and chemicals HPLC grade acetonitrile (ACN), Ammonium acetate and Triethyl amine (A.R. grade) was purchased from Merck, Malaysia. Water HPLC grade was obtained from a Milli-QRO water purification system. Reference standards of Valsartan was Procured from Cipla pharmaceuticals, Mumbai, India. Apparatus and chromatographic conditions HPLC chromatographic separation was performed on a Shimadzu liquid chromatographic system equipped with a LC-20AD solvent delivery system (pump), SPD-20A photo diode array detector, and SIL-20ACHT injector with 50µL loop volume. LC solution version 1.25 was applied for data collecting and processing (Shimadzu, Japan). A C18 column (250 mm x 4.6 mm i.d., 5µ) was used for the separation, mobile phase of a mixture of acetonitrile and 5mM ammonium acetate (adjusted to pH 4.5 using orthophosphoric acid); (75:25 v/v) was delivered at a flow rate of
4235
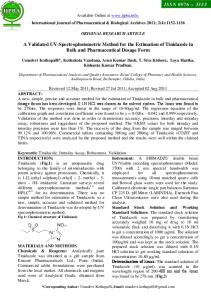
Selvadurai Muralidharan et al J. Chem. Pharm. Res., 2012, 4(9):4235-4239 ______________________________________________________________________________ 1.0 ml/min with detection at 240 nm. The mobile phase was filtered through a 0.2µ membrane filter and degassed. The injection volume was 50 µl and the analysis was performed at ambient temperature. Preparation of standard solutions Standard stock solutions of 1.0 mg/ml Valsartan was prepared separately using a mixture of water and acetonitrile (1:1 v/v). From the standard stock solution, standard solution was prepared to contain 10.0 µg/ml of valsartan. Preparation of sample solutions Twenty tablets containing 80 mg of valsartan were taken and average weight was determined. Weight equivalent to 80mg of Valsartan was taken in 100 ml volumetric flask and suitable volume (Methanol) was added. Further dilutions were made and used for the analysis. Assay method With the optimized chromatographic conditions, a steady baseline was recorded, the mixed standard solution was injected and the chromatogram was recorded. The retention time of Valsartan was found to be 3.702. This procedure was repeated for the sample solution obtained from the formulation. The peak area ratio of the standard solution and sample solution were calculated. The concentration of the drugs was calculated using following formula: Sample Peak Area Concentration of drugs = --------------------------------------Standard Peak Area RESULTS AND DISCUSSION Estimation of Valsartan in dosage forms The HPLC procedure was optimized with a view to develop precise and stable assay method. The pure drug Valsartan was run in different mobile phase compositions with different C18. The flow rate was also varied from 0.5 ml to 1.2 ml/min. Finally Phenomenex C18 column (250mm x 4.6mm i.d., 5µ) with a mobile phase of a mixture of acetonitrile and 5mM ammonium acetate (adjusted to pH 4.5 using orthophosphoric acid) (adjusted to at a flow rate of 1.0 ml/min with a detection at 240 nm gave sharp and symmetrical peaks with retention time 3.702 for valsartan respectively. The resolution factor at the above said condition was 1.5. The typical chromatogram of sample solution is shown in Figure 1. Detection was done at 240 nm. The peak area ratio of standard and sample solutions was calculated. The assay procedures were repeated for six times and mean peak area and mean weight of standard drugs was calculated. The percentage of individual drugs found in formulations, mean, standard deviation in formulations were calculated and presented in Table 1. The results of analysis shows that the amounts of drugs were in good agreement with the label claim of the formulation. Method validation Accuracy and precision The accuracy of the method was determined by recovery experiments. The recovery studies were carried out six times and the percentage recovery and standard deviation of the percentage recovery were calculated and presented in Table 1. From the data obtained, added recoveries of standard drugs were found to be accurate. The precision of the method was demonstrated by inter day and intra day variation studies. In the intra day studies, six repeated injections of standard and sample solutions were made and the response of drug peaks and % CV were calculated and presented in Table 2. In the inter day variation studies, six repeated injections of standard and sample solutions were made for three consecutive days and response factor of drug peaks and percentage % CV were calculated and presented in Table 2. From the data obtained, the developed RP-HPLC method was found to be precise. Linearity and Range The linearity of the method was determined at five concentration levels ranging from 2 to 12µg/ml for Valsartan. The calibration curve was constructed by plotting response factor against concentration of drugs. The slope and intercept value for calibration curve R2=0.99 for Valsartan. The results show that an excellent correlation exists between response factor and concentration of drugs within the concentration range indicated above.
4236
Selvadurai Muralidharan et al J. Chem. Pharm. Res., 2012, 4(9):4235-4239 ______________________________________________________________________________ Limit of Detection and Limit of Quantification The Limit of Detection (LOD) and Limit of Quantification (LOQ) of the developed method were determined by injecting progressively low concentrations of the standard solutions using the developed RP-HPLC method. The LOD is the smallest concentration of the analyte that gives a measurable response (signal to noise ratio of 3). The LOD for Valsartan was found to be 10 ng/ml respectively. The LOQ is the smallest concentration of the analyte, which gives response that can be accurately quantified (signal to noise ratio of 10). The LOQ was 28 ng/ml Valsartan, respectively (Table 3). Ruggedness and Robustness The ruggedness of the method was determined by carrying out the experiment on different instruments like Shimadzu HPLC (LC2010AHT), Agilent HPLC and Water’s Breeze HPLC by different operators using different columns of similar type like Hypersil C18, Phenomenex C18 and Hichrom C18. Robustness of the method was determined by making slight changes in the chromatographic conditions. It was observed that there were no marked changes in the chromatograms, which demonstrated that the RP-HPLC method developed, are rugged and robust. Solution stability In order to demonstrate the stability of both standard and sample solutions during analysis, both solutions were analyzed over a period of 5 h at room temperature. The results show that for both solutions, the retention time and peak area of Valsartan remained almost unchanged and no significant degradation within the indicated period, thus indicated that both solutions were stable for at least 5 h, which was sufficient to complete the whole analytical process. System suitability studies The column efficiency, resolution and peak asymmetry were calculated for the standard solutions (Table 3). The values obtained demonstrated the suitability of the system for the analysis of this drug combination and the system suitability parameters fall within ± 3 % standard deviation range during routine performance of the method. Table 1. Results of analysis of formulation and recovery studies
Table 2. Intraday and interday precision studies of Valsartan
_____________________________________________________________________________________________ Intraday studies Interday studies _____________________________________________________________________________________________ 100 400 600 100 400 600 (ng/ml) (ng/ml) _____________________________________________________________________________________________ Mean 99.2253 399.3379 599.7443 99.3253 399.7719 599.5743 SD 0.47 0.62 0.43 0.47 0.43 0.39 %CV 0.47 0.15 0.07 0.47 0.10 0.06 %Accuracy 99.22 99.83 99.95 99.46 99.94 99.92 _____________________________________________________________________________________________
4237
Selvadurai Muralidharan et al J. Chem. Pharm. Res., 2012, 4(9):4235-4239 ______________________________________________________________________________ Table 3. System suitability studies
Figure 1. Typical Chromatogram of Sample Solution
/3.702
mAU 350
300
250
200
150
100
50
0
-50 0.0
1.0
2.0
3.0
4.0
5.0
6.0
min
CONCLUSION In conclusion, the developed method for the estimation of valsartan is accurate, precise, selective and linear and it can be applicable for the Pharmacokinetics studies. Hence this method is definitely time saving to enable the estimation of valsartan. The proposed method is found to be accurate, precise, linear, robust, and rugged. The proposed method could be useful for the national quality control laboratories in developing countries. REFERENCES [1]. G Flesch, PH Muller, PH P. Lloyd, Eur. J. Clin. Pharmacol. 1997, 52, 115-120. [2]. L Criscione, W Bradley, P Buhlmayer, S Whitebread, R Glazer, P Lloyd, P Mueller, MD Gasparo, Clinical advantage of valsartan. Drug Rev. 1995, 13, 230-250. [3]. S Oparil, S Dyke, F Harris, J Kief, D Jamaes, A Hester, S Firzsimmons, Clin.Ther.1996, 18, 797-810. [4]. F Waldmeier, G Flesch, P Muller, T Winkler, HP Kriemler, P Buhlmayer, MD Gasparo, Pharmacokinetics, disposition and biotransformation of [14C]-radiolabelled valsartan in healthy male volunteers after a single oral dose. Xenobiotica. 1997, 27, 9-71. [5]. Sioufi, F Marfil, J Godbillon, J. Liq. Chromatogr. 1994,17, 2179-2186.
4238
Selvadurai Muralidharan et al J. Chem. Pharm. Res., 2012, 4(9):4235-4239 ______________________________________________________________________________ [6]. E Francotte, A Davatz P Richert, J.Chromatogr.B . 1996, 686, 77-83. [7]. N Daneshtalab, RZ Lewanczuk, F Jamali, J Chromatogr B Analyt Technol Biomed Life Sci., 2002, 766,345-359. [8]. L Gonzalez, J. Chromatogr. A., 2002, 949,49-60. [9]. N Koseki, Pharm Biomed Aanal., 2007, 43,1769-1774. [10]. H Li, J. Chromatogr. B. Analyt. Technol. Biomed. Life. Sci., 2007, 852,436-442. [11]. PS Selvan, J. Chromatogr. B. Analyt. Technol. Biomed. Life Sci., 2007, 858,143-150. [12]. International Conference on Harmonization, ICH. Technical requirements for registration of pharmaceuticals for human use guideline on validation of analytical procedure-methodology (1996) Geneva.
4239