A Visual Backchannel for Large-Scale Events Marian Dörk, Daniel Gruen, Carey Williamson, and Sheelagh Carpendale Abstract—We introduce the concept of a Visual Backchannel as a novel way of following and exploring online conversations about large-scale events. Microblogging communities, such as Twitter, are increasingly used as digital backchannels for timely exchange of brief comments and impressions during political speeches, sport competitions, natural disasters, and other large events. Currently, shared updates are typically displayed in the form of a simple list, making it difficult to get an overview of the fast-paced discussions as it happens in the moment and how it evolves over time. In contrast, our Visual Backchannel design provides an evolving, interactive, and multi-faceted visual overview of large-scale ongoing conversations on Twitter. To visualize a continuously updating information stream, we include visual saliency for what is happening now and what has just happened, set in the context of the evolving conversation. As part of a fully web-based coordinated-view system we introduce Topic Streams, a temporally adjustable stacked graph visualizing topics over time, a People Spiral representing participants and their activity, and an Image Cloud encoding the popularity of event photos by size. Together with a post listing, these mutually linked views support cross-filtering along topics, participants, and time ranges. We discuss our design considerations, in particular with respect to evolving visualizations of dynamically changing data. Initial feedback indicates significant interest and suggests several unanticipated uses. Index Terms—Backchannel, information visualization, events, multiple views, microblogging, information retrieval, World Wide Web.
1
I NTRODUCTION
Digital backchannels are an emerging social phenomenon. As people are watching political debates [34], attending educational events [17], or even coping with natural disasters [36], they increasingly share brief and timely pieces of information in digital backchannels, which create persistent conversations about events of social significance. Digital backchannels have become an intriguing communication medium, over which more and more people exchange impressions, suggestions, and comments during events. Such backchannels not only enable participants to share their experience and shape how observers perceive an event [7, 33], they are also used to help participants influence the unfolding of an event and its outcome [6, 19]. As these digital backchannels rise in importance as social information spaces, in which people complement and co-create large-scale events, we see significant limitations with current methods of displaying information. The widespread chronologically ordered lists alone are not sufficient for large-scale backchannels in that they are not able to adequately represent the scale and dynamics of real-time conversations. This has the unintended but well-known consequence that participants get distracted from the main event, have difficulties focusing, and lack an overview of what the backchannel contains [10, 19, 27]. To explore these issues, we introduce Visual Backchannel, an evolving, interactive, and multi-faceted interface that integrates three visualizations with a list of backchannel posts via linking, brushing and filtering (see Figure 1). In order to give new perspectives on backchannel conversations, we introduce Topic Streams, a temporally and topically adjustable stacked graph that visualizes topics extracted from digital backchannel conversations. This is accompanied by two compact visualizations, People Spiral and an Image Cloud, presenting visual aggregates of active participants and shared images. These visualizations offer a visual sense of the conversation at the moment, using visual accentuations that make the present visible, in the context of the topical development. This way Visual Backchannel provides saliency and visual evidence of what is happening now, and what is recent within the ongoing temporal context of how backchannel conversations unfold • Marian Dörk, Carey Williamson, and Sheelagh Carpendale are with the University of Calgary, E-mail: {mdoerk, carey, sheelagh}@ucalgary.ca. • Daniel Gruen is a research scientist with IBM Research, at the IBM Watson Research Center in Cambridge, E-mail:
[email protected]. Manuscript received 31 March 2010; accepted 1 August 2010; posted online 24 October 2010; mailed on 16 October 2010. For information on obtaining reprints of this article, please send email to:
[email protected].
over time. The four views, which are linked via highlighting, brushing, and filtering are designed to provide organically evolving representations of a constantly changing data set, and interactive access to the temporal distribution of topics, the most active participants, and salient photographic impressions. With this work, we make two main contributions: • We propose the notion of evolving visualizations that integrate representations of current activity and recent development in continuous information streams, such as digital backchannels. • We introduce three novel interactive visualizations that summarize the main facets of large-scale backchannels and provide exploratory interactivity along time, topics, and people in the context of a Visual Backchannel interface. The rest of this paper is organized as follows. Section 2 provides a brief overview of prior related work. Section 3 motivates the need for better digital backchannels, and provides design goals for our Visual Backchannel system. Section 4 identifies the challenges and opportunities of dealing with dynamic, evolving data. Section 5 describes the realization of our Visual Backchannel, while Section 6 discusses initial feedback on the system. Section 7 outlines limitations of this work and future research directions, while Section 8 concludes the paper. 2 R ELATED W ORK Our work can be situated in the context of visualizing persistent conversations, experiencing digital backchannels during a wide range of events, and representing topics over time. 2.1 Visualizing Persistent Conversations Much of the previous research on visualizing human communication considered its social and expressive aspects. For example, on a low level, artistic visualizations of typing patterns, corrections, and pauses between responses can enrich otherwise ordinary text-based messages [29, 37]. On a higher level, visualizing the identity and presence of people participating in chats and Usenet discussions, as well as their temporal activity and structure, can lead to increased social awareness [13, 14]. Visualizations of short-term [38] and long-term discussions [40, 42] can provide valuable cues about conversation activity and community patterns. Further research focuses on conversation threads. For example, the extent of forum discussions and the distribution of a given search term therein can be visualized in a bird’seye view of forum threads [12]. Email exchanges can be visualized as thread arcs representing reply structure and temporal order [25]. While nesting and time provide suitable mechanisms for structuring and ordering the display of exchanged messages, we are interested in providing overviews of the main topics being discussed.
a) Topic Streams
c) People Spiral
b) Filters and Search
d) Post List
e) Image Cloud
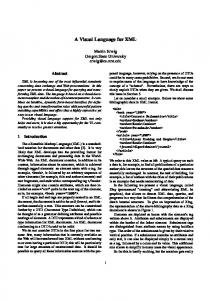
Fig. 1. The Visual Backchannel—here shown for Twitter posts about the event Park(ing) Day—consists of a) Topic Streams: a visualization representing topical development, b) controls for filtering and searching, c) People Spiral indicating the activity of participants, d) chronologically ordered list of posts, and e) Image Cloud displaying shared photos.
In contrast to social and structural aspects of conversations, few visualizations attempt to represent the actual topics being discussed. Conversation Map displays participants, salient topics, and threads of newsgroup discussions in a coordinated-view interface including social and semantic network visualizations [32]. Themail visualizes how topics in personal email conversations develop over time using stacked keyword lists arranged along a horizontal time axis [39]. Both Conversation Map and Themail provide content-based perspectives on conversations, however, they have only been applied to archives after the fact, not to real-time conversations as they unfold. Besides considering digital conversations, visualization interfaces can complement verbal small-group conversations as they evolve, representing proportional talking time of speakers as circular visualization [3] or salient terms as topical clusters [4]. While the former summarizes who is and has been talking for how long, the actual content and topics of the conversation are not represented. The latter cluster visualization lacks the history visualization that the earlier technique incorporates. We extend this research that emphasized primarily social and structural aspects of discussions in that we seek to represent conversation topics in the context of their temporal development together with participants’ activity and pictorial impressions. While previous work represented either small, live conversations or large, archived discussions, our work explores the case of large-scale real-time conversations. 2.2
Using Digital Backchannels for Events
Digital backchannels can be understood as conversations that accompany an ongoing event. Early research characterized backchannel communication as private, informal, ephemeral, and only visible to those engaged in it, suggesting ethical and social concerns about increased persistence and visibility [10]. Later work explored public use of an Internet Relay Chat during academic conferences [27], and an interactive system to vote on audience questions [19]. The benefits of a digital backchannel include the exchange of additional information without interrupting the main event and the ability to shape the event. The main concern was the potential to disrupt and distract [10, 19, 27]. With the emergence of microblogging, in particular through Twitter1 , we are witnessing a new type of backchannel that is accompanying not only professional events, but also personal life events. Studies of Twitter posts, called ‘tweets’, show a broad range of uses including sharing personal updates, informational links, and real-time 1
http://twitter.com
comments about events [24, 43]. Researchers have noted Twitter’s uniqueness in its accessibility, simplicity, and mobility as a platform as well as in the brief, broadcast-like, real-time, and loosely-linked nature of shared tweets [28, 43]. It has also been argued that backchannels can help learners in their knowledge acquisition [28], as evidenced by books advising the use of backchannels for education and business audiences [2, 17]. Digital backchannels are increasingly used as information channels during current events. People affected by crises are using Twitter as an important broker of timely information [22, 35, 36]. A study of Twitter messages during emergency and high-security events has shown a relative increase of information dissemination, in contrast to personal communication [22]. Backchannels are seen to complement official information sources by providing a bottom-up mechanism for relating first-hand accounts [35]. The domain of politics is another realm where there is growing interest in digital backchannels. For example, Twitter members have actively posted reactions to and evaluations from a TV debate between the candidates in the 2008 US elections [34]. Such Twitter reactions can be used to visually complement media broadcasts with, for example, current topic trends [33]. Politicians have been experimenting with online communication to engage in new forms of dialogue with their constituents [6, 26]. For example, the White House under Barack Obama invited citizens to shape online town hall meetings [9]. With thousands of people engaging in digital backchannels, it quickly becomes difficult if not impossible to follow the development of the topics discussed. Our work addresses this challenge and attempts to visually represent the voices of thousands of people and indicate temporal evolution of topics. 2.3
Representing Topics as They Change
In the following, we discuss visualization research that considers the temporal, topical, and social character of shared information. The most relevant prior work is ThemeRiver, which visualizes user-selected themes of news stories as horizontally-centred stacked graphs [20]. A recent revisit of the ThemeRiver approach applied and adapted it to entertainment datasets and suggested new methods for ordering and colouring the streams [8]. The main limitations of these stacked graph techniques are the fixed length of time bins, the static selection of themes being used, and the lack of zooming or filtering operations. In our work we are introducing a stacked graph technique that is temporally, topically, and socially dynamic by visualizing livechanging data and allowing temporal zooming and interactive filtering along topics, people, and search terms. Several approaches have been suggested for the visual exploration of blog posts, for example, by visualizing tags and comments arranged along a time-axis [23] or by providing faceted visualization widgets for visual query formulation according to time, place, and tags [15]. For news stories, Newsmap is an interactive, web-based treemap visualization representing the relative number of articles per news item2 . The evolution of topical trends in social media has been explored by using line graphs indicating term trends [18]. Other work has suggested representing the changing nature of stories by clustering keywords into themes and tracking their temporal evolution [31]. Earlier work explores the idea of live-updating views for existing visualization techniques by encoding data changes as animations [1, 21], as has also been done for representing changes in tag frequencies [11, 16]. There is a growing interest in visualizing the subjective and social aspects of people’s communication on the Web, as exhibited (for example) by We Feel Fine, an art/visualization project that visualizes emotional statements as animated, coloured particles3 . In another example, people were asked, following an election, to share their feelings as individual words resulting in a sentiment visualization representing the most salient emotional adjectives differentiated by party affiliation4 . These and many other examples of web-based visualizations 2 3 4
http://newsmap.jp http://www.wefeelfine.org http://nyti.ms/5fhwjZ
can be framed as casual infovis, a visualization practice with a wider user population and different types of insights ranging from personal reflection to social awareness [30]. Most interactive Twitter visualizations fit into this space of social, casual, and playful infovis. For example, some interfaces provide a network visualization of contacts and topics5 , others overlay salient keywords onto a geographic map6 . A treemap visualization blends keywords with, for example, photos of the 2010 Winter Olympics, and also provides a visualization time slider to select certain time periods7 . There are also Twitter displays that, strictly speaking, are not visualizations, but moving lists or typographic animations8 . Work on coping with large numbers of tweets in personal feeds proposes the organization of tweets into thematic clusters allowing the user to focus on particular subsets of tweets [5]. It is not clear how this interface represents change of topics over time. To summarize, there has been some promising research on visualizing the development of topics over time. While existing stacked graph techniques focus on static datasets with fixed temporal and topical granularities, we introduce a highly dynamic and interactive stacked graph technique. Visualizations of news, tags, and tweets use primarily motion to represent data change. We want to extend this work by incorporating additional methods for encoding recent data changes after animations have been finished. To our knowledge, there has been no work on evolving views combining both current and past changes of topics over time. With our work we want to integrate current, recent, and past topic changes using visual and interactive representations. 3
TOWARD B ETTER D IGITAL BACKCHANNELS
We are exploring the problem space around digital backchannels as socially significant information spaces during events, and deriving design goals for a Visual Backchannel interface. 3.1
Problem Space and Scope
At the beginning of this research project, we held a brainstorming session with about 20 colleagues from our research group to gather initial feedback on the type of events they wanted better backchannel support for and the problems—in particular with regard to participation— they experienced at such events. Based on their feedback, we have identified a broad range of events and a selection of the main problems with existing event backchannels. The collected problems centre around following the main topics being discussed, knowing the people participating, and managing attention between the main event and the backchannel. Quotes in this section were taken from sticky notes generated by participants during this brainstorming session. Too Many Voices. Active events and backchannels attended by many participants make it difficult to follow the conversation or even engage meaningfully, as there are “too many voices” and “too many people to listen to”. Instead it would be ideal to be able to “hear the ’voice of thousands”’. Sea of Strangers. During large-scale events participants may feel “lost in a sea of strangers” as it is difficult to “know who else is in the meeting” or event. For example, it can be hard to “find like minded people” or to “find my tribe”. Experiencing a large-scale event often gives the opportunity for meeting new people and “not just talking to the people you come with”. A requirement for this is for oneself to be “seen as attending” as well, which means that a person’s participation and presence at the event is visible to other participants. Losing focus. Distraction is a critical problem provoked by the competing nature of the main event and the backchannel. With many people and posts to follow, participants have difficulties deciding “what to focus on”, which often coincides with a “lack of attention to [the] meeting itself”. What just happened. A participant attending both an event and engaging in a backchannel has to remain current in both spaces. This 5 6 7 8
http://apps.asterisq.com/mentionmap http://trendsmap.com, http://nyti.ms/4VO3pc http://j.mp/9Nt8on http://visibletweets.com, http://twistori.com
requires the participant to continuously switch the context of attention and recreate the personal awareness in the particular space. Participants are constantly asking themselves What just happened? Or, where are we now and how did we get here? 3.2
Design Goals for a Visual Backchannel
When considering large-scale backchannel conversations, there is a growing need to consider fragmented awareness and the shifting attention of participants. In order to explore these issues of switching between the main event and the backchannel, we attempt to represent the “now” in the context of the “recent”. By aligning the visual variables for current activity with the representations for recent developments, we attempt to help participants in recreating awareness. In particular, we want to help participants quickly answer common questions about an ongoing backchannel conversation, for example: What are the main topics right now? How are topics changing over time? Who are the most active participants? What are certain participants talking about? Based on these questions, previous research, and our own experiences with events and backchannels, we derived the following design goals for a Visual Backchannel interface: Summarize the conversation. A Visual Backchannel should include views that summarize the topical, social, and pictorial aspects of backchannel conversations, decreasing the cognitive effort required to follow a backchannel. The main topics, most active participants, and most popular images of a conversation should be visualized indicating both activity and development. Integrate the ‘now’ and the ‘recent’. Visualizations should capture how a backchannel conversation is unfolding at the current moment and in the context of its recent development. This way participants should be assisted in making sense of current activity by being able to review recent developments. For example, when briefly switching attention away from the event toward the backchannel, it should require little effort to recover awareness and focus. Extend presence of the present. As the ‘now’ really does not take any time, there should be visual accentuations for current activity such as incoming posts and subsequent changes in the visualizations. This way current backchannel activity should become more comprehensible. Ideally, the half-life of visual highlights representing the present should bridge the gap to the visualization of the recent past. Provide flexible time windows. Considering that events may last from minutes to several weeks, the interface should provide flexible methods for modifying the time window under exploration. The temporal selection should influence the extent of visual change in the interface. With narrower time spans, more visual activity is expected. Allow for topical and social exploration. Besides time, the main dimensions for interactive exploration should be the topics and the participants of the backchannel. Selecting individual participants should indicate their pattern of topical development over time. Selecting topics should reveal their most active authors and co-occurring topics. Make visual activity adjustable. When displaying a live event, the interface should allow the viewer to adjust the level of visual activity by specifying time windows, filtering by topics and participants, and entering search terms. We expect that there should be less visual activity with larger time windows and more constrained filters. Encode organic feel. We would like Visual Backchannel to offer a dynamic and appealing interface. Colours, shapes, and arrangements should be accessible, inviting, and visually pleasing. Changes in the interface triggered by incoming posts or interactive filtering should be carried out by animated transitions. 4
T WEETS
AS
DATA
To approach the aforementioned goals for a Visual Backchannel, we turn to the microblogging community Twitter as a widely used backchannel platform. As we were more interested in exploring new visual interfaces for backchannel communication than creating a new backchannel platform, we decided to build on Twitter, which already has a large and active audience. Besides the wide adoption of Twitter, the choice was also influenced by Twitter’s open API that allows for relatively simple and automatic access to its publicly shared posts.
4.1
Short Live Updates
Twitter posts, or ‘tweets’, are an interesting data set to consider for infovis research, because of their brief, social, timely, and public nature. Tweets are limited to 140-character length, initially in order to work with SMS texts, but this limit could also be seen today as an attempt to manage attention. For the purpose of Visual Backchannel we focus on a tweet’s author, timestamp, and text. The author and time information of a post is easy to obtain and essential for indicating the activity of backchannel participants and visualizing temporal development. A tweet’s text holds a wealth of valuable additional information. The text in a tweet holds the words that can be used in aggregate form to give a broad sense of what a conversation is about and, in combination with the timestamp, to indicate its topical evolution. A tweet may also contain links to images, possibly taken using a mobile phone during an event, which we can use to provide live pictorial impressions from event participants. Furthermore, there is a convention among Twitter members to indicate whether a tweet is a quotation by somebody else, namely a re-tweet, by prefacing the tweet with the original tweet’s author and the letters RT. Another convention of the Twitter community is to add so-called hashtags—tags preceded by a hash sign—that are intended to associate a tweet with certain places, topics, or events, for example, #visweek. The use of hashtags has become an important organization mechanism allowing Twitter members to track a subset of tweets. It could be argued that the participants publishing tweets with a given hashtag temporarily become members of an ephemeral community around this hashtag and, for example, the event it stands for. 17% of a random sample of tweets (n=50,680) included hashtags, among which there were on average 1.3 hashtags per tweet. For Visual Backchannel, we can use hashtags or words as search terms to aggregate tweets belonging to an event. In our text analysis, we treat hashtags as words. While an individual tweet is small and has a clear structure, taken together in bulk (during events, for example), tweets can occur in large quantities, with temporal spikes and periods of low activity. These potentially large data volumes in short time frames place limitations on the complexity of data processing and visual mapping. The data operations have to be kept minimal to ensure fluid interactivity and near real-time visualization of conversation topics and activity. 4.2
Text Analysis
The processing of tweets is different from previous work on text visualizations of email archives, blog posts, and news articles. Our ‘documents’ are at most 140 characters long and typically do not contain explicit keywords, subject headings, or tags except perhaps for hashtags. We believe that using re-occurring words used by participants as topics for the Visual Backchannel results in a truthful representation of what a backchannel conversation is about. The challenge with using freeform text instead of preselected categories is that the resulting topic dimension will have a higher degree of noise and variance. The goals of the following processing steps are to reduce noise and variance and extract meaningful topics that are rooted in the actual tweets. 1) Images and re-tweets. First, we extract event photos that are typically associated with tweets as links to image services, such as Twitpic9 . We determine whether a post is a re-tweet quoted from somebody else by looking for substrings of RT. This is done before the subsequent processing steps, since links and re-tweets are not considered in the Topic Streams. 2) String cleaning. Noise becomes negligible as we aggregate large numbers of tweets, remove special characters and URLs, and make the text lowercase. The resulting string consists now only of letters and numerals. Then we split the string at whitespace characters in order to get individual words. 3) Stop word removal. To reduce the number of less expressive words, we remove 120 stop words, common words (such as “a”, “is” and “can”) that typically do not carry meaning. We also consider the search term we use to aggregate the posts from Twitter as a stop word 9
http://twitpic.com
and remove it, since it would be associated with all tweets across all times thus not adding any information. 4) Stemming. We reduce the number of words further by collapsing those words that carry similar meaning using a basic Porter stemmer algorithm. For example, singular and plural versions of the same word, or noun, adjective, and verb versions of the same stem are collapsed together into single stems. We display the most frequent word per stem as a label, which worked well in our experience. 5) Associations. We associate the extracted aspects with the original posts and store them in a relational database. In summary we now have the following information for each backchannel post: time of publication, full original text, extracted topics (word stems), author name, image link, and whether it is a re-tweet. This information allows us to visualize several dimensions of a backchannel conversation. Based on correlations between these aspects, we can also derive: newness of a topic in a time window, ratio of original content per author, used topics of participants, and cooccurrences between topics. Since the occurrences of topics are linked with timestamps we can calculate a general newness measure of a stem based on its average time of occurrence. Indirectly via the posts, a topic is also associated with all the backchannel participants using these topics and with all the co-occurring topics in these posts. This allows us to filter the topic visualization also by the participants and the topics themselves. Furthermore, whether a tweet is an original post or a re-tweet allows us to calculate an originality measure for a particular participant based on the ratio between original and quoted tweets. 5 D ESIGNING A V ISUAL BACKCHANNEL In this section, we discuss our design and implementation of a Visual Backchannel as a coordinated-view interface that provides interactive and visual access to the current activity and ongoing development of backchannel conversations. Besides featuring a conventional list of backchannel posts, the Visual Backchannel interface consists of three novel visualizations that are linked in order to support cross-filtering and brushing. The primary visualization using the most screen real estate is Topic Streams, a stacked graph visualization of conversation topics, below which there is a People Spiral, a helical view of the most active participants, and an Image Cloud featuring photographs taken during an event (see Figure 2). While being designed to create aesthetic aggregations that summarize topical, social, and pictorial aspects of a backchannel over a given time period, these visualizations also accentuate current activity in ongoing backchannels using ‘half-lived’ highlights in the context of recent developments. The visualizations provide ways for interactive and responsive cross-filtering along time, topics, and participants. Furthermore, the interface features interactive representations of currently set filters, including text search, and a conventional list of backchannel posts giving rapid access to the data being visualized. 5.1 Topic Streams The primary view of our Visual Backchannel is used by Topic Streams, an interactive stacked graph that visualizes live-changing textual data across time and supports interactive exploration by temporal zooming and panning, and topical filtering. In contrast to previous stacked graph techniques that relied on fixed time intervals and predefined categories, such as news topics [20], movie titles, and artist names [8], our Topic Streams support multiple levels of temporal zoom and are based on the changing textual contents of tweets. 5.1.1 Representing Conversation Development We choose a stacked graph as the main visualization, as we can use it to encode both current and cumulative changes in the backchannel conversation. The visualization uses an integrated set of visual variables and arrangements to encode topical development: Position. The x-axis of the visualization is used for the time dimension. Depending on the time window, there are date and/or time labels on the top. The present is positioned at the far right edge of the view, unless the viewer changes the temporal selection to a past time
Fig. 2. The Visual Backchannel interface representing Twitter posts about the earthquake in Chile on the evening of February 27, 2010.
window. Analogous to previous stacked graph techniques [8, 20], the y-axis is used to encode relative frequency of topics by the vertical width of the stream corresponding to a topic at a particular time point. We display the 30 most popular topics and omit less popular topics, in order to reduce drawing complexity and ensure interactive responsiveness. However, less popular topics can be explored by filtering by participant or text search. Ordering. Recent work on stacked graphs suggested novel methods for finding ideal stream orderings in order to reduce ‘wiggle’ between time intervals [8]. One of the suggestions is to arrange arriving streams on the outside (both top and bottom) and streams that have arrived earlier close to the inside of the stacked graph. We experimented with many ordering techniques, however, we experienced very unstable orderings of streams for different time spans leading to abrupt re-orderings when zooming or panning along the time dimension. To avoid excessive visual activity through reordering, yet still use the order of streams in a meaningful but more stable way, we decided to order by general newness of a topic from top to bottom of the streams. The choice of newness as an ordering measure over time of first occurrence is based on the observation that the first occurrence of a word in an individual tweet alone does not make it a conversation topic, but only when it is picked up by multiple participants. As we have taken the current time window as the basis for topic selection, we calculate a newness measure by averaging the timestamp of all those topic occurrences from the beginning of the event until the end of the current time window. This way newness represents the novelty of a topic within a particular time window of an event defined by the current temporal selection. Similar to the typical ordering of blog and Twitter posts, we order the topics by putting the newest topics on top. An earlier prototype included animated transitions for stream reordering, which resulted in white gaps between streams during transitions. We decided to reduce the visual activity caused by reordering by keeping the order of the stream shapes stable, and only apply transitions for label positions and smoothly adjust the stream shapes instead.
This has the benefit of much smoother animated transition. Colour. We double-encode the newness of topics with their stream colours, as the stream ordering only represents a ranking and not a distribution of values. The mapping from newness to colour is done in the HSV (hue, saturation, value) colour space. We choose a subset of the hue spectrum between blue and green, with the newest topics represented by green and the oldest in blue. To make the streams of newer topics appear brighter and more saturated we map greater newness to higher saturation and higher value (see Figure 3, right). Shape. The stream shapes are defined by cubic Bézier curves. As illustrated in Figure 3, left, the changing width and shape of a stream is defined by the control points of a curve at different time intervals. Curve control points for a given data point, either on the top or bottom of the stream, share the same y value which results in interpolated curve segments that do not ‘ring’, but stay between the y values of interpolated data points. Positioning the outer control points (e.g., pi a and pi c) with their x values at the borders of the corresponding time interval creates the effect of smoothly curved streams. There are 15 intervals for a given time window which provides a good tradeoff between satisfactory temporal resolution and interactive responsiveness. The Topic Streams are stacked in order to give the impression of a conversation river consisting of multiple topic lines. While earlier techniques used exclusive categories for stacked graph visualizations, we use words coinciding with other words in tweets as the basis for the Topic Streams. This has the effect that tweets with more words ultimately have a greater impact on the resulting visualization. We find that this is acceptable as longer backchannel posts also contribute more to a conversation. Alternatively, a normalization step could take into account the length of a tweet and scale the contribution of a word to the visualization accordingly. We decided not to count multiple instances of the same word per tweet to reduce the influence that individual tweets can have on the visualization of topics. Scaling. While the vertical width of an individual stream at a specific time interval is determined by the relative number of topic oc-
Time intervals t0
Colour mapping t1
t2
t3
t4
Highlights
Newest topic
Cubic Bézier curves p2a
p2b
p2c
w2 Stream width q2a
q2b
q2c
Control points Oldest topic
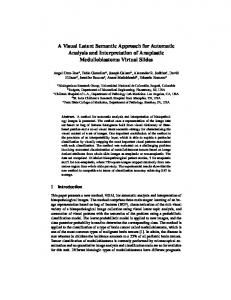
Fig. 3. Left: The development of a topic over time intervals ti is represented as a stream-like shape defined by two cubic Bézier curves whose control points, pi a,b,c and qi a,b,c , define the changing widths wi of the topic stream. Right: The chosen colour scale ranges between a rich, bright green for newer topics and matte, dark blue for older topics.
currences in tweets during this time bin, the overall sum of the stream widths per time interval corresponds to the sum of occurrences of these most popular topics. We scale the topic visualization so that the time bin with the most topics uses the full height of the topic view in the interface. This has the effect that the Topic Streams are rescaled between filter explorations. While this carries the danger of impeding comparability, we indicate the rescaling through animated transitions. Labels. The topic visualization is also accompanied by textual labels. For each topic there is a label positioned at its widest section of the corresponding stream. The label that is used is the most used word instance of the particular stem. The font size of the label is correlated with the overall number of occurrences of the topic in this time window and its colour is a darker tone of the colour of the stream. There are date and time labels at the top of the visualization for temporal intervals. Faint vertical lines demarcate the different time bins. 5.1.2 Representing Current Activity Complementing the visualization of topics changing over time, we see a need for representing current activity in the backchannel in the context of recent developments. We want to represent data change in ways that are comprehensible and not lost when following the visualization only peripherally or sporadically, which is likely during events. To encode current activity we are focusing on three main visual variables: colour, position, and motion. These variables are not in conflict when used for representing topical development, as they can be seen as extensions from the present into the recent past. Colour. We accentuate the topics and authors of incoming posts by adding temporary yellow-coloured backgrounds to the corresponding labels in the visualizations (see Figure 4). The opacity of a highlight depends on the relative frequency that a topic was mentioned. These visual accentuations can be seen as ‘half-lived’ highlights of current activity whose immediate presence in the interface is always temporary. However, we seek to connect the representation of the now with the representation of recent developments in the data stream. Therefore, we choose yellow as it is the natural extension of the colour scale used to indicate newness in the streams. One could argue that the newest or most recent time point is the present. Position. We position the present at a clear location, namely the far right of the topic visualization. This way the viewer can expect the most change in a particular region of the interface. Similar to the temporary use of colour, the position of the now gradually slides to the left of the visualization as the previous now becomes the recent. Motion. Data change leads to animated transitions in the visualizations. The Topic Streams grow or shrink relatively with current activity. The extent of the animations represents the extent of the change in the backchannel conversation. When the animated transitions terminate, the result of the previous now becomes the shape of the recent. By using multiple connected visual variables to represent the continuum between current activity (the now) and prior development (the recent), the Visual Backchannel offers a novel visual representation
Fig. 4. The Topic Streams represent Twitter topics during Easter 2010 with yellow highlights indicating current activity in the backchannel.
that is designed to help with getting a sense of ‘what is happening’ in the context of ‘what just happened’. While we have focused here on the Topic Streams, we have followed an analogous approach for visualizing the now for the People Spiral, Image Cloud, and post list. 5.1.3 Interactivity The Topic Streams support three basic filter interactions: temporal zoom, temporal sliding, and topical selection. All these interactions result in animated transitions of the Topic Streams and the other views, reducing the cognitive cost of following the change. Temporal zooming. The zoom level specifies the basic unit for each time interval. A range between ten seconds and a month per interval, with seven steps in between, was chosen to represent a wide spectrum of events and allowing viewers to set their time span of choice. The viewer can change the level of temporal zoom by scrolling with the mouse wheel, similar to how zooming works in web-based mapping services, or clicking on the corresponding button above the Topic Streams. This zoom event is acknowledged by an animation of the grid representing the time intervals. As soon as the data for the new time window of the topic visualization has been transmitted to the browser, the Topic Streams are updated through animated transitions. Temporal sliding. The viewer can also change the current time window by sliding it to an earlier or later period. Also similar to webbased mapping tools, the viewer can simply drag the topic view either to the left or to the right or select corresponding buttons to move the time window to a later or earlier time point. By dragging with the mouse pointer, the streams, time grid, and time labels will follow its movement, and after releasing the mouse button they will snap into the chosen place. When the viewer drags the topic visualizations, there will be pre-rendered parts of the streams with the length of the current time window in each direction. This technique is known in computer graphics as off-screen rendering, and here it allows us to provide a smoother user experience. Topical selection. Besides changing the temporal granularity or position of the Topic Streams, the viewer can also change their topical composition by selecting a topic itself as a filter. This has the effect that only those Topic Streams that coincide with the selected topic will be shown. The selected topic will be removed from the Topic Streams, as it is implicitly present in all selected tweets and thus will not change the visual representation of the Topic Streams. Instead the topic filter will be represented as an interactive button above the topic visualization that allows its cancellation by simply clicking it. 5.2 Compact Visualizations for Participants and Photos Besides the rich and sophisticated visualization provided by the Topic Streams, we decided to choose more compact views representing the people participating in a backchannel and the shared photos. Together these views can only use about one third of the screen area of the backchannel interface to have sufficient screen space for the post listing. Particularly guided by the goals of designing for an organic appearance and making efficient use of the screen space, we came up with two aesthetic, yet compact views that summarize the activity of backchannel participants and their pictorial impressions.
n=16
n=100
s=2.0 r=0˚
s=1.5 r=25˚
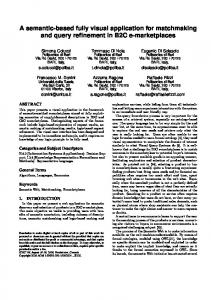
Fig. 5. The Image Cloud arranges photos shared by Twitter members during the Burning Man 2009 desert festival. Image sizes correspond to relative differences in image sharing and reposting. With fewer images in a selection (left), the displayed images can assume larger areas.
Fig. 7. Different visual arrangements for an Image Cloud representing 100 photos shared during the SXSW 2010 festival on Twitter. Layouts differ by margins between images, adjusted by the spacing constant s, and the image orientations, specified by the rotations range r.
5.2.1 People Spiral With the goal to display participants in an aesthetic representation, we designed the People Spiral layout consisting of dots and labels representing backchannel participants and their activity (see Figure 6). Each dot in the spiral stands for a participant using the dot size to represent their activity in the backchannel, based on the relative number of tweets within the current time window and topic selection. The colour of a dot indicates the originality of the person’s posts. The more tweets were quotes, or re-tweets, the less saturated the dot is. The base colour is a tone of blue. The effect is that participants contributing novel information to the backchannel appear in richer and more intensive colours than those mostly re-posting.
as a tooltip. If the number of participants is below a certain threshold, currently set to 40, the layout reverts to a full circle displaying the labels for all represented participants (see Figure 6, bottom right). The labels allow interactive filtering by participant. Selecting one will change the colour of the label and dot to orange and add a participant filter on the top right of the interface. Clicking again on the label or on the filter button will withdraw the filter. Selecting another participant will change the filter. In combination with other views, filtering by participant allows us to quickly see what individual people have been talking about in the backchannel. We have experimented with selecting only the posts by the selected participant and also including those that mention them. We find both cases to be useful.
n=300
n=36
n=88
Fig. 6. Representing the activity and originality of Twitter members with posts about Park(ing) Day 2009. The People Spiral accommodates a range of participant numbers and adjusts its layout accordingly.
Another goal for the design of the People Spiral is to visually represent as many people as possible, and give precedence to more active participants. An early design included an icon list of participants, which did not indicate activity and could only display a few people without having to scroll. Slightly compromising the readability of some labels, we chose a spiral layout for its organic shape and the ability to represent many participants in a compact area. The People Spiral is ordered by activity and represents up to 300 participants. The most active participant is positioned at the outer end of the spiral on the right side with its label straight and easily readable. A label’s font size is relative to the dot size and has the same colour. Further along the spiral, the labels are rotated perpendicular to the tangent of the spiral at a given point, however, on the left side they are flipped to avoid labels being rendered upside down. Depending on the current temporal and topical selection, the number of participants displayed varies. In order to represent large numbers of participants, we omit the labels for less active participants whose dots are positioned in the inside of the spiral. Hovering over these dots reveals the name of the participant
5.2.2 Image Cloud The Image Cloud is a lightweight view for socially shared images, inspired by the widespread use of tag clouds on the Web [41]. Similar to how tag clouds typically use font size to encode how often a tag has been associated with resources in web communities, we can adjust the area an image uses in the visual display to indicate how often it has been shared in relation to other displayed images. As posts on Twitter can contain links to images, it can be observed that images and, in the context of events, photos assume social significance based on the repostings by participants. With the Image Cloud, we harness these social frequency measures by displaying more frequently posted images larger than those that have been posted only once (see Figure 5). In our current design, we focused on the presentation of at most 100 image thumbnails with a square aspect ratio, however, this technique can be easily extended to arbitrary rectangles and larger displays. The positioning of images is based on an iterative force-directed layout algorithm that is seeded by initial positions with larger images positioned closer to the centre and smaller ones further at the periphery of the view. In order to make efficient use of the space devoted to the Image Cloud we need to adjust the maximum image size on the basis of the image frequencies and quantity. In our prototype, we set the maximum length of image thumbnails using the following formula: s A lmax = (1) ci s ∑ni=1 cmax with A for the screen area, n for number of images, ci for occurrences of a particular image, cmax for maximum occurrences among all images, and s as a spacing constant ranging between 1 and 2.5. Depending on aesthetic intentions for creating customized backchannel displays, one could, for example, decrease s creating larger overlaps and images. Exploring these aesthetic considerations a little further, we have experimented with adding small, random rotations to images around the z-axis as a simple way of creating a more ‘natural’ appeal similar to the aesthetic of photo collages. By setting the range of rotation r and adjusting the spacing constant s, one gets a spectrum of visual layouts for an Image Cloud that ranges between a clean mosaic-like layout and a messy collage view with many overlaps. A relatively high spacing constant leads to open unused areas in the layout and relatively small images (see Figure 7, left). Reducing the spacing and adding rotation both increased the area used by
shared images and also added an interesting visual pattern (right). The spacing and rotation constants provide the designer of a backchannel interface with more control over its visual appearance. While image spacing and rotation for aesthetic purposes may appear like visual clutter, we think that an appropriate balance between order and deviation in the layout can make the presentation both appealing and useful. 5.3
Interactive Exploration
In addition to seeing overviews and trends, we designed the Visual Backchannel interface to allow the viewer to explore the different aspects of a backchannel and the linkage between them. The Visual Backchannel is a coordinated-view system that provides interaction techniques to inspect the relationships of a backchannel conversation with regard to its topics, time periods, participants, images, and posts. In our design there are two main types of exploratory interactivity: linked brushing and cross filtering. The former serves the temporary exploration of data relationships and the latter allows the viewer to select a subset of the conversation stream. These interaction types are designed to be as seamless and comprehensible as possible. Linked brushing. With interactive brushing, the viewer can identify commonalities between multiple views. By hovering over a visual element in one view, related elements in other views are highlighted with a distinct colour, in our current design, it is a slightly matte tone of pink. For example, when moving the mouse pointer over the interface elements for participants, posts, or images, the Topic Streams visualization indicates the corresponding temporal distribution of a participant’s activity or the publication time of the given post or photo. Similarly, the People Spiral highlights the author of a particular backchannel post or image, and vice versa the posts and images are highlighted. Cross filtering. Besides displaying temporary relationships, the Visual Backchannel also provides functionality to slice and dice the conversation stream and the corresponding views by time, topic, and participant. The Topic Streams provide interactivity to change temporal granularity, time span, and topical selection and the People Spiral allows filtering by a participant of interest. Topic and participant filters become interactive controls displayed in the top right of the interface accompanying a search box and a button for filtering out re-tweets. In addition to these positive filters, we envision negative filters to hide particular participants or topics, for example, due to spam or different interests. The search box already allows negative filtering by preceding a search term with a minus sign. 5.4
Evolving Visualizations
In order to design a Visual Backchannel for both past and ongoing events, we set out to create interactive visualizations that support both archival exploration and live tracking of backchannel conversations. From a data processing perspective, an ongoing backchannel conversation constitutes itself as continuously incoming posts that are processed and mapped to visual variables. From a visualization perspective these data changes can be represented by a wide array of visual variables. Previous research emphasized the value of motion and animated transitions [1, 21]. We agree, and apply gradual transitions to our Topic Streams, People Spiral, and Image Cloud, resulting in appealing animations for newly arriving data. When distraction is a potential issue, we feel that motion alone yields only short-lived and possibly too subtle cues for following the development of a backchannel conversation. While shifting focus between backchannel and main event, a participant should be able to easily grasp how the backchannel conversation developed since the last time they checked. Therefore, we seek to encode recent and present data change with visual variables that are easy to follow and gradually build up a history of data change. The Topic Streams already have an explicit time dimension that visualizes data change over time. The People Spiral and Image Cloud provide implicit data histories through social aggregates of backchannel activity during the current time window. In addition to these explicit and implicit encodings of data change, we also provide highlights in the interface that emphasize visual elements linked to currently unfolding activity. For incoming posts the corresponding Topic Streams are highlighted by briefly
adding yellow backgrounds behind the topic labels, which faded out after not more than 5 seconds. The opacity of these highlights is determined by the number of tweets that mention a particular topic. Similarly the authors and post items themselves receive temporary yellow highlights directing the attention of the viewer to new or changing visual elements. In our latest Visual Backchannel prototype, the time from publishing a post on Twitter until it is retrieved, analyzed, and visualized lies between 20 and 30 seconds. In summary, the Visual Backchannel interface features evolving visualizations that represent data change threefold using: 1) shape and size, 2) animated transitions, and 3) temporary colour highlights. We believe that these representations provide several valuable perspectives on the unfolding of backchannel communication. To reduce visual activity, the viewer can choose to follow a part of the backchannel by selecting a particular topic or a wider time window. 6
I NITIAL F EEDBACK
FROM
P OTENTIAL U SERS
In an attempt to gain feedback on the usefulness and limitations of our Visual Backchannel interface from a wide range of potential users, an early prototype featuring the Topic Streams, a post list, and a people circle was demonstrated on a podium at a large corporate trade event attended by over 6000 people. The functional demo showed a live view of the tweets around the hashtag used for the conference. There was significant tweeting activity during the event, followed both by people attending the event and those monitoring it from afar. The Visual Backchannel was a very popular, well-received demo, with many visitors commenting positively on the overall look and apparent simplicity of presentation. The reactions and comments from visitors suggested a set of possible uses for the Visual Backchannel interface that partly match our proposed goals and confirm earlier work on conversation and community visualization (e.g., [13]). Audience reaction. Organizers and speakers at the conference were very interested to see what themes the audience took from specific sessions. This was particularly true for speakers at the large plenary sessions. They were curious both to see what the audience found interesting, and what the reactions were to specific announcements they made and demos they showed. For example, they could see reactions to the choice of a specific celebrity as keynote speaker, and more importantly to them, what people thought of a new project they announced. Seeing oneself. People using Twitter wanted to see their own posts and who else had re-tweeted or responded to them. Several tweeters asked to have screenshots taken and sent to them capturing their postings almost as a souvenir of their involvement in the community; this was not something we had anticipated. Two stated that they would show them to their managers as evidence of their efforts and impact. Product conversations. Many attendees wanted to use the tool to follow tweets about their product or company, both in general and to show the effect of specific announcements, publicity campaigns, or news stories. A business partner from Australia said he would like to use it as a quick way to easily catch up and see what people had been saying in the rest of the world about a topic or product area while he was asleep overnight. He said it would “literally change my life”. Event experiences. Several people who had attended social events around the conference (late night party, an amateur musical show) wanted to navigate to these times to see what other people had tweeted. New tweets appeared on the screen with yellow background highlights for several seconds, with similar highlights appearing on the associated terms and participants. We noticed that people’s attention was often drawn to the screen when they noticed new posts arriving in their peripheral vision; even when speaking to the researcher, they turned to look at the screen. Use of the prototype by or with visitors to the demo area revealed several ideas for improvements and extensions. The current design of the Visual Backchannel interface as presented in this paper reflects some of these suggestions. Search capability. Visitors wanted to locate postings around a specific topic within the event, and in some cases wanted to pull up a specific tweet they had seen before. The tested prototype version required them to locate the term in the visualization to select associated
tweets. In some cases, the term was not shown as it had not appeared enough in the selected time window prompting some people to zoom into the display and scroll to different time periods in hopes of seeing the desired word. On the basis of this, we have integrated a search capability into the Visual Backchannel interface allowing full text search over post contents and author names. Pinning keywords and people. In the tested implementation, users would occasionally select a term and/or person in the visualization, see the corresponding tweets, and then scroll the time window to see tweets for earlier or later periods of time. If there were no tweets corresponding to the term and person, the display would revert to showing all tweets and the selection criteria would be lost. This behaviour has been fixed and filters remain set until the viewer revokes them. Sentiment analysis. Adding some form of sentiment analysis was requested by many, so they could see at a glance not just what topics were being discussed, but whether the general impressions of them were positive or negative. This was particularly important to the event organizers and moderators, and for those who envisioned using the tool to monitor conversations around their products and companies. So far we have not experimented with encoding sentiment, but will likely explore this in the near future. Threads. Several visitors suggested other ways of organizing tweets and re-tweets, such as in a more traditional discussion/reply format. As the conventions around replies and retweets have evolved through the practices of the Twitter community, there has not been simple access to the thread nature of posts. Recently there is explicit support by the Twitter platform to expose threads and correspondences, which we plan to incorporate into the Visual Backchannel soon. 7
D ISCUSSION
In the following, we critically assess the Visual Backchannel idea with regard to open questions regarding scalability, distraction, participation, and potential uses beyond events. Scalability. The two main bottleneck areas for the Visual Backchannel are analyzing the data and generating visualizations. Running the Visual Backchannel as a web-based system on state of the art computers10 allows the processing of about 5 posts per second. While preparing and rendering the Visual Backchannel interface and subsequent for a medium sized event (1400 posts) takes about one second to render, it takes about 7 seconds for a large event (180,000 posts). Generating views for an exceptionally large conversation11 of one million posts by 325,000 participants over a timespan of 25 days, takes about 45 seconds to generate—admittedly not interactive response times. As the system had not gone through any rigorous optimization, these preliminary measures are promising. However, to support exceptionally large events more research on scalability and performance is necessary. Distraction. Besides the scalability of the Visual Backchannel, there is the cognitive load for the participant to consider. One of our design goals is to provide visual overviews to reduce distraction from the main event by the backchannel conversation. While the competition for attention between the back and the front channel is already occurring, we need to investigate more closely what effect our design decisions regarding the representation of the now and the recent have on the participants and their event experience. The jury is out whether the visualizations that we introduced can quickly satisfy high-level information needs or whether they captivate or confuse the viewer to explore the backchannel communication instead of following or engaging with the main event. Participation. The initial motivation for this work arose from a desire to use electronic means to increase the level of meaningful participation during meetings and events. This then grew into a more ambitious goal: supporting truly large-scale events and discussions involving hundreds of thousands and potentially millions of participants, such as national “town hall” meetings or truly global topical discussions. While the work that we present here can be seen as one step toward that goal, the Visual Backchannel in its current state does not pro10 11
Client and server: 2.5/2.4 GHz Intel Core 2 Duo with 4 GB memory. Twitter posts about Chile after the February 2010 earthquake.
vide ways of actually participating in a large backchannel. The challenge here is to design new ways to engage in an event or backchannel by allowing the participant to be heard among “too many people” and creating new relationships. Purpose. We designed the Visual Backchannel interface with the goal of representing current backchannel activity in its immediate temporal context. Providing this context also enables seamless transitioning to viewing past activity. As discussed in Section 6, the initial feedback we received during a trade show was particularity positive about this dual capability and encourages us to further explore the notion of visualizing the ‘now’ together with the ‘recent’. There was significant interest in our Visual Backchannel from both event organizers and event participants that suggests uses for backchannel interfaces after as well as during the event. We have since observed the use of our tool by colleagues who asked to use it to monitor events they were not able to attend. These initial results promise further research opportunities for the visualization of both live and archival backchannel activity. Beyond events. While we have approached backchannel communication from the perspective of event support, we believe that the Visual Backchannel can be extended into a general-purpose interface for any type of data that has at least topical and temporal characteristics. For example, server logs for web site navigation and search terms could be visualized across time and in real-time to anonymously represent a sense of what web surfers have been recently and are currently interested in. The question is whether the resulting visualizations, in particular the Topic Streams, can provide meaningful and interesting information without the shared experience of an event. The common ground that is typically provided by an event may be necessary for shaping and punctuating the visualization. 8
C ONCLUSION
We have presented the Visual Backchannel, a novel medium for exploring large-scale conversations around events, making it possible to: 1) get a visual sense of large backchannel conversations over time, 2) follow evolving representations of a live, continually changing data set, and 3) explore its temporal, topical, social, and pictorial facets. In order to visually summarize what a backchannel conversation is about and how it changes, we have introduced Topic Streams, as temporally adjustable stacked graphs, and two lightweight visualizations, People Spiral and Image Cloud, that represent the authors and images of a backchannel. These three visualizations provide context for the continually updated post listing and are themselves continually updating and evolving. The viewer can engage in different types of interactive explorations to focus on the subset of a backchannel conversation by selecting a time span, participant, and/or topic of interest. In a continual stream of information, there are interesting nuances in the temporal experience. For instance, the current moment or ‘the now’ is caught up in what is actively taking place in the posts. However, to understand the topics in the now, one needs the context of the immediately preceding, or ‘the recent’. Further, both the now and the recent need the context of the on-going but slightly longer term focus of the event. By integrating decaying highlights that progress form the incoming yellow through the hue gradient of yellow through green to blue, the Visual Backchannel combines information about the now together with information about the recent into one visualization. Providing this temporarily fading highlight raises the possibility that one might be able to keep one’s awareness of the backchannel in one’s periphery. This possibility is certainly worth further exploration. We see this research in a larger context of exploring emerging social information streams that have considerable value for both observers and participants of backchannels. While we have addressed challenges of data change and development in the context of backchannels for events, we feel that there is a need for much more research on representing both the ‘now’ and ‘recent’ in changing information spaces. ACKNOWLEDGMENTS We thank our colleagues at CUE (IBM Research) and the iLab (University of Calgary) for valuable advice and assistance, in particular, Mark Hancock and Elaine M. Huang for their feedback on drafts of
this paper. We are also very grateful to the referees for their constructive feedback and suggestions. Funding was provided by IBM Research, SMART Technologies, NSERC, iCORE, and NECTAR. R EFERENCES [1] C. Albrecht-Buehler, B. Watson, and D. Shamma. Visualizing live text streams using motion and temporal pooling. Computer Graphics and Applications, IEEE, 25(3):52 – 59, 2005. [2] C. Atkinson. The Backchannel: How Audiences Are Using Twitter and Social Media and Changing Presentations Forever. New Riders Pub, 2009. [3] T. Bergstrom and K. Karahalios. Conversation Clock: Visualizing audio patterns in co-located groups. In HICSS 2007: Hawaii International Conference on System Sciences, pages 1317–1325. 40, 2007. [4] T. Bergstrom and K. Karahalios. Conversation Clusters: grouping conversation topics through human-computer dialog. In CHI ’09: Proceedings of the SIGCHI Conference on Human Factors in Computing Systems, pages 2349–2352. ACM, 2009. [5] M. Bernstein, S. Kairam, B. Suh, L. Hong, and E. H. Chi. A torrent of tweets: Managing information overload in online social streams. In Workshop on Microblogging: What and How Can We Learn From It? (CHI ’10), 2010. [6] S. Borins. From online candidate to online president. International Journal of Public Administration, 32(9):753–758, 2009. [7] A. Burns and B. Eltham. Twitter free Iran: an evaluation of Twitter’s role in public diplomacy and information operations in Iran’s 2009 election crisis. In Communications Policy Research Forum 2009. University of Technology, Sydney, 2009. [8] L. Byron and M. Wattenberg. Stacked graphs - geometry aesthetics. TVCG: Transactions on Visualization and Computer Graphics, 14(6):1245–1252, Nov/Dec 2008. [9] CNN. Obama goes online for town hall meeting. http://www.cnn. com/2009/POLITICS/03/26/obama.online/ (Retrieved 201003-22), 26 March 2009. [10] S. Cogdill, T. Fanderclai, J. Kilborn, and M. Williams. Backchannel: whispering in digital conversation. In HICSS 2001: Hawaii International Conference on System Sciences, page 8 pp. IEEE Computer Society, 2001. [11] C. Collins, F. B. Viégas, and M. Wattenberg. Parallel tag clouds to explore and analyze faceted text corpora. In VAST 2009: IEEE Symposium On Visual Analytics Science And Technology. IEEE Computer Society, 2009. [12] K. Dave, M. Wattenberg, and M. Muller. Flash forums and forumReader: navigating a new kind of large-scale online discussion. In Proceedings of the 2004 ACM conference on Computer supported cooperative work, pages 232–241. ACM, 2004. [13] J. Donath. A semantic approach to visualizing online conversations. Communications of the ACM, 45(4):45–49, 2002. [14] J. Donath, K. Karahalios, and F. Viegas. Visualizing conversation. In HICSS 1999: Hawaii International Conference on System Sciences, pages 74–83. IEEE Computer Society, 1999. [15] M. Dörk, S. Carpendale, C. Collins, and C. Williamson. VisGets: Coordinated visualizations for web-based information exploration and discovery. IEEE Transactions on Visualization and Computer Graphics, 14(6):1205–1212, Nov/Dec 2008. [16] M. Dubinko, R. Kumar, J. Magnani, J. Novak, P. Raghavan, and A. Tomkins. Visualizing tags over time. ACM Transactions on the Web (TWEB), 1(2):7, 2007. [17] EDUCAUSE Learning Initiative. 7 things you should know about backchannel communication. http://www.educause.edu/ node/198305 (Retrieved 2010-03-18), 2010. [18] D. Fisher, A. Hoff, G. Robertson, and M. Hurst. Narratives: A visualization to track narrative events as they develop. In VAST 2008: IEEE Symposium On Visual Analytics Science And Technology, pages 115 – 122, 2008. [19] D. Harry, J. Green, and J. Donath. backchan.nl: integrating backchannels in physical space. In CHI ’09: Proceedings of the SIGCHI Conference on Human Factors in Computing Systems, pages 1361–1370. ACM, 2009. [20] S. Havre, E. Hetzler, P. Whitney, and L. Nowell. ThemeRiver: Visualizing thematic changes in large document collections. TVCG: Transactions on Visualization and Computer Graphics, 8(1):9–20, 2002. [21] E. Hetzler, V. Crow, D. Payne, and A. Turner. Turning the bucket of text into a pipe. In InfoVis 2005: Symposium on Information Visualization, pages 89–94. IEEE Computer Society, 2005.
[22] A. L. Hughes and L. Palen. Twitter adoption and use in mass convergence and emergency events. In ISCRAM 2009: Conference on Information Systems for Crisis Response and Management, 2009. [23] Indratmo, J. Vassileva, and C. Gutwin. Exploring blog archives with interactive visualization. In AVI ’08: Proceedings of the working conference on Advanced visual interfaces, pages 39–46. ACM, 2008. [24] A. Java, X. Song, T. Finin, and B. Tseng. Why we twitter: understanding microblogging usage and communities. In Proceedings of the 9th WebKDD and 1st SNA-KDD 2007 workshop on Web mining and social network analysis, pages 56–65. ACM, 2007. [25] B. Kerr. Thread Arcs: An email thread visualization. In InfoVis 2003: Symposium on Information Visualization, pages 211–218. IEEE Computer Society, 2003. [26] D. Lazer, M. Neblo, K. Esterling, and K. Goldschmidt. Online Town Hall Meetings – Exploring Democracy in the 21st Century. Congressional Management Foundation, 2009. [27] J. McCarthy and danah m. boyd. Digital backchannels in shared physical spaces: experiences at an academic conference. In Conference on Human Factors in Computing Systems, pages 1641–1644, 2005. [28] B. McNely. Backchannel persistence and collaborative meaning-making. In SIGDOC ’09: Proceedings of the 27th ACM international conference on Design of communication, pages 297–304. ACM, 2009. [29] P. Neumann, A. Tat, T. Zuk, and S. Carpendale. KeyStrokes: Personalizing typed text with visualization. In EuroVis 2007: Proceedings of Eurographics / IEEE VGTC Symposium on Visualization, pages 43–50, 2007. [30] Z. Pousman, J. T. Stasko, and M. Mateas. Casual information visualization: Depictions of data in everyday life. TVCG: Transactions on Visualization and Computer Graphics, 13(6):1145–1152, Nov/Dec 2007. [31] S. Rose, S. Butner, W. Cowley, M. Gregory, and J. Walker. Describing story evolution from dynamic information streams. In VAST 2009: IEEE Symposium On Visual Analytics Science And Technology, 2009. [32] W. Sack. Conversation Map: a content-based usenet newsgroup browser. In IUI 2000: Proceedings of the 5th international conference on Intelligent user interfaces, pages 233–240. ACM, 2000. [33] D. Shamma, C. Santa Clara, L. Kennedy, and E. Churchill. Tweetgeist: Can the Twitter timeline reveal the structure of broadcast events? In CSCW Horizons 2010: Proceedings of the ACM conference on Computer supported cooperative work, 2010. [34] D. A. Shamma, L. Kennedy, and E. F. Churchill. Tweet the debates: understanding community annotation of uncollected sources. In WSM ’09: Proceedings of the first SIGMM workshop on Social media, pages 3–10. ACM, 2009. [35] K. Starbird, L. Palen, A. L. Hughes, and S. Vieweg. Chatter on the red: what hazards threat reveals about the social life of microblogged information. In CSCW 2010: Proceedings of the ACM conference on Computer supported cooperative work, pages 241–250. ACM, 2010. [36] J. Sutton, L. Palen, and I. Shklovski. Backchannels on the front lines: Emergent uses of social media in the 2007 southern california wildfires. In ISCRAM 2008: Conference on Information Systems for Crisis Response and Management, 2007. [37] A. Tat and S. Carpendale. Visualising human dialog. In IV ’02: International Conference on Information Visualisation, pages 16–21, 2002. [38] F. B. Viégas and J. S. Donath. Chat circles. In CHI ’99: Proceedings of the SIGCHI Conference on Human Factors in Computing Systems, pages 9–16, 1999. [39] F. B. Viégas, S. Golder, and J. Donath. Visualizing email content: portraying relationships from conversational histories. In CHI ’06: Proceedings of the SIGCHI Conference on Human Factors in Computing Systems, pages 979–988. ACM, 2006. [40] F. B. Viégas and M. Smith. Newsgroup crowds and authorlines: Visualizing the activity of individuals in conversational cyberspaces. In HICSS 2004: Hawaii International Conference on System Sciences. IEEE Computer Society, 2004. [41] F. B. Viégas and M. Wattenberg. Tag clouds and the case for vernacular visualization. interactions, 15(4):49–52, 2008. [42] R. Xiong and J. Donath. PeopleGarden: creating data portraits for users. In UIST 1999: Symposium on User Interface Software and Technology, pages 37–44. ACM, 1999. [43] D. Zhao and M. B. Rosson. How and why people twitter: the role that micro-blogging plays in informal communication at work. In GROUP ’09: Proceedings of the ACM 2009 international conference on Supporting group work, pages 243–252. ACM, 2009.