Mar 14, 2013 - ABSTRACT: National Geographic Society (NGS) has made several changes throughout the years in their choice of map projection for their ...
Cartography and Geographic Information Science
ISSN: 1523-0406 (Print) 1545-0465 (Online) Journal homepage: http://www.tandfonline.com/loi/tcag20
A Visual Basic Algorithm for the Winkel Tripel Projection Fritz C. Kessler To cite this article: Fritz C. Kessler (2000) A Visual Basic Algorithm for the Winkel Tripel Projection, Cartography and Geographic Information Science, 27:2, 177-183, DOI: 10.1559/152304000783547939 To link to this article: http://dx.doi.org/10.1559/152304000783547939
Published online: 14 Mar 2013.
Submit your article to this journal
Article views: 38
View related articles
Full Terms & Conditions of access and use can be found at http://www.tandfonline.com/action/journalInformation?journalCode=tcag20 Download by: [Penn State University]
Date: 14 September 2015, At: 10:51
A Visual Basic Algorithm
for the Winkel Tripel Projection Fritz C. Kessler ABSTRACT: National Geographic Society (NGS) has made several changes throughout the years in their choice of map projection for their world reference maps. The Van der Crinten I map projection was used from 1922 to 1988. Then, in 1988, it was replaced by the Robinson projection. Beginning in 1998, the Winkel Tripel became the map projection of choice for NCS' world maps. Given this change, cartographers and others who make maps may be interested in using the Winkel Tripel for custom applications. The goal of this paper is to show how Winkel Tripel's complex projection equations can be programmed using Visual Basic.Those who use other languages such as C++ can use this programming example to help them create a similar algorithm in their language of choice.
Downloaded by [Penn State University] at 10:51 14 September 2015
KEYWORDS: Map projection, Winkel Tripel, algorithm
Introduction
O
ver the years, the National Geographic Society (NGS) has made several changes in their choice of map projection for their world reference maps. From 1922 until 1988, world maps were produced using the Van der Grinten I projection (Figure 1). During this 55-year period, NGS acknowledged the popularity of this projection but also realized that other projections had been developed which tried to represent the spherical Earth more faithfully. Citing the need for a projection that reduced the amount of distortion, especially in the polar areas, in 1988 NGS changed to the Robinson projection (Figure 2) for their world maps. Since its introduction in 1988, the Robinson projection has been adopted by many other mapping agencies for their world maps. Despite the popularity of this projection, in 1995 NGS produced a world map using the Wmkel Tripel projection (Figure 3) to illustrate the locations of the Earth's crustal boundaries and published it as a map supplement in the National Geographic magazine (1995). Public reaction to the map and to the Winkel Tripel projection was extremely favorable. A decision was therefore made in 1998 to replace the Robinson with the Wmkel Tripel as the projection for N GS world maps. In light of this change, cartographers and others who make maps may be interested in using the Winkel Tripel for custom applications. In some cases, they may not have access to software such as Geocart®, MicroCAM, or WO RLD which can generate the projection. Or, they may wish to utilize a programming language to create a custom application such as a computer-based animation 1
Fritz Kessler is Assistant Professor in the Department of Geography, Frostburg State University, Dunkel Hall, Frostburg, MD 21532. Tel.: (301) 687-4266, Fax: (301) 687-4495. URL: http://www.fsu.umd.edu/depVgeog/faculty/ kessler/fkmain. html. E-mail: .
but may be uncertain of how to implement equations (i.e., spherical assumption) for the Winkel Tripe!. This paper describes how Winkel Tripel's complex projection equations can be programmed using Visual Basic. I present here a program called Wmkel Piotl written in Visual Basic 5.0 that is used to draw the Winkel Tripel's parallels and meridians as well as draw a simple coastline me. Winkel Plot also allows the user to change the central meridian and spacing of the parallels and meridians. A simple programming language and flexible graphics capabilities make Visual Basican attractive language to use. However, there are limitations in the mathematical functions supported by Visual Basic that make programming the Wmkel Tripel projection formulas difficult. These difficulties are addressed in the paper, and solutions are provided.
NGS' Projection Choice
for World Maps From 1922 until 1988, NGS used the Van der Grinten I projection as the basis for their world maps. According to Chamberlin (1947), the Van der Grinten I was the "epitome of compromise, for in not attempting to show any special truth it gives perhaps the best overall picture." He added
Winkel Plot can be obtained at http://www/fsu/umd.edu/dep/geog/faculty/kessler/fkmain.html. Cartography and Geographic Information Science, Vol. 27, No.2, 2000, pp.]77-] 83
that the projection had "the single advantage of presenting a picture of the entire world without either excessive angular distortion or scale change" (p.63). The projection is neither equal area nor conformal, represents the world in a circle, and uses gentle curves for the parallels and meridians. The center of the projection has low distortion, but as latitude increases, distortion becomes extreme, especially near the edges of the projection (see Figure 1). To lessen the distortion at the edges of the projection, NGS used the Van der Grinten I to only show areas between 60 Sand 80 N latitudes. The polar areas were displayed in the upper left and right margins of the map using the Azimuthal Equidistant projection (Figure 4). While NGS was using the Van der Grinten I projection for their world maps, numerous other projections were developed. Most of these projections were specifically developed to enable faithful representation of the Earth according to predefined criteria. Thus in 1982, a search was initiated at the request ofNGS to select a new map projection for NGS' world political maps that would present a less distorted view of the Earth's landmass and also mark the loath anniversary of the agency (Garver 1988). A panel of academic and professional cartographers reviewed several possible map projections and after discussing the merits of each, they made their recommendations to NGS. In 1988, NGS adopted the Robinson projection as a suitable replacement for the Van der Grinten I. The Robinson projection was developed by Arthur Robinson in the early 1960s following a so-called "artistic" approach whereby the resulting projection is an "interpretation distilled from the author's experience" (Robinson 1974, p. 146). His projection was created to preserve shapes and relationships on the map as they occur on the Earth, while minimizing distortion. Having no special property (i.e., neither equal area nor conformal), the Robinson projection employs curved lines to represent longitude, but straight parallel lines to represent lines oflatitude. The projection has relatively low distortion throughout, and according to NGS, provides a better balance between size and shape than did the Van der Grinten I projection (Garver 1988). NGS' goal in selecting a projection for a world map has always been an "uninterrupted projection that displays features on the Earth and their relationships to one another as accurately and with as little distortion as possible" (Garver 1988, p. 912). In 1988, Robinson' projection seemed the "most reasonable for a general reference map of the world possible (Garver 1988, p. 912)." Ten years later, NGS switched to the Winkel Tripel projection. This time, however, no committee was convened. Instead, NGS consulted a map projection expert to recommend several projections.
Downloaded by [Penn State University] at 10:51 14 September 2015
0
178
0
Figure 1. The Van der Grinten I projection plotted with a 30° graticule.
Figure 2. The Robinson projection graticule.
plotted with a 30°
Figure 3. The Winkel Tripel projection plotted with a 30° graticule. The need for change in projections after only a tenyear period was motivated by two important reasons: aspect ratio and landmass representation. Aprojection's aspect ratio can be described as the ratio between the lengths of the equator and the central meridian, and it is important in determining the "compactness" of the
Cartography and Geographic Information Science
Downloaded by [Penn State University] at 10:51 14 September 2015
Fig~re ~. NGS.' world map plotted on the Van der Grinten I and projections with a 15° graticule.
projection. The Robinson projection has an aspect ratio of 1.97:1while the WinkelTripel's is smaller at 1.63:1. A projection with a smaller aspect ratio (i.e., closer to 1:1) IS more compact and occupies less space on the printed page, i.e., one needs more paper to print a world map at a given scale using the Robinson projection than when the Winkel Tripel is used. Moreover, the Robinson projection distorts the landmass in the polar regions more than the Winkel Tripe\. Specifically,on a Robinson projection centered at 0.0°, Greenland is about as wide as it is long, a significant distortion of Greenland's true shape which should be about twiceas long as it is wide. In comparison, the Winkel Tripel shows Greenland to be one and a halftimes as long as it is wide. This representation is not perfect, but Greenland's shape looks more correct, and its size distortion is moderate.2 The use of the WinkelTripel results in reduced production costs,while achieving a better representation oflandmass in the polar regions.
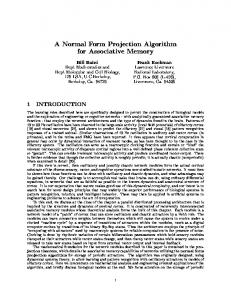
The Winkel Tripel Oswald Winkel (1873-1953) produced three world projections, the first two of which were pseudo cylindrical. Snyder (1993) explains that the first of these, Winkel I, was produced in 1914 by averaging the Sinusoidal projection and the cylindrical equidistant projection (Figure 5A). The standard parallels for the cylindrical equidistant were placed 2
at 50°28' Nand S. Winkel took a similar approach in 1918 to create his second projection, Winkel II; he averaged the cylindrical equidistant projection and the Mollweide projection (Figure 5B). Winkel's third projection, the Tripel, is his best known projection. The Tripel is the result of another averaging, this time between the cylindrical equidistant and Aitoff projections (Figure 5C). Winkel (1921) applied the German term Tripel to his third projection to indicate that it is a "compromise of the properAzimuthal Equidistant ties of three elements"-area, angle, and distance-, which results in a projection with a lower oerall distortion than when the properties of only one of these elements are preserved. The Tripel projection wasdesigned for the display of the oikumene (the known world), which he limited to 70° Nand S of the equator. Canters and Declair (1989) describe the Winkel Tripel as one of the best projections for general-purpose world maps, frequently employed in atlas cartography. Historically, the primary use of the Tripel has been for smaIl-scaleatlasmapping. Accordingto Snyder (1993), the Tlll1esAtlaswas its chief user beginning in 1958, but this publication wrongly states that the Winkel Tripel was averaged from the Lambert cylindricalequivalent and the Hammer azimuthal projections. The Winkel Tripel has also been used in atlasesproduced byJohn Bartholomew & Son, Ltd., using 40° N and S as the location of the standard parallels for the cylindrical equidistant (Strebe 1999; personal communication). Unlike Winkel's other map projections, the Winkel Tripel is not pseudo cylindrical. Snyder and Voxland (1989) classify this projection as a modified azimuthal, based on the characteristics of the meridians and parallels in the equatorial aspect.. Tobler (1962) classified the Winkel Tripel as polyconic, basing his classification on the mathematical relationships between the geographical and Cartesian coordinates. The Winkel Tripel poses no special projection property and thus is neither conformal nor equal area. The Winkel Tripel has no standard parallels; the meridians and parallels are gentle curves, except for the poles and the equator, which are straight lines. The pole line is slightly shorter than half the length of the equator (0.389).
This .des.cri~tio~ c~me from a pa~p~l~t publishe~ by .NGSentitled Why National Geographic Uses the Winkel Tripel Projfection. The publication IS distributed free to indiViduals who inquire aout the change in projections at NGS.
Vol. 27, No.2
179
Figure 5. A matrix showing the different combinations of projections Winkel used to create the Winkel I (5A). Winkel II (58). and the Winkel Tripel (5C) projections. Cylindrical Equidistant
Winkel I
Sinsoidal
Mollweide
Cylindrical Equidistant
Downloaded by [Penn State University] at 10:51 14 September 2015
Cylindrical Equidistant
Formulas for the Winkel Tripel Equations 1 and 2 (Snyder and Voxland 1989, p. 214) give the general plotting formulas for the equatorial aspect of the Winkel Tripe!. x == (XI Y == (Yt
+ x2)/2 + Y2)/2
AitotT
Mter D has been determined from Equation 5, it must be checked. IfD equals 0 then, using Equations 6 and 7, set the values of X and Y to 0, the center of the projection. IfD
==
0;
(6) (7)
X==o y==o
(1) (2)
where:
= the Cartesian coordinates for the
X1'YI
cylindrical equidistant projection, and x2' Y2 = the Cartesian coordinates for the Aitoff projection. This suggests that the coordinates for the cylindrical equidistant and Aitoff projections must be determined before the equations for the Winkel Tripel projection can be completed. The general plotting formulas for the cylindrical equidistant projection are given by Equations 3 and 4 (Snyder and Voxland 1989, p. 219).
x
==
R(A - 1..0)COS~I
(3) (4)
Y == R~
where:
Ao = the central meridian; ¢.
=
the standard parallel;
= the radius of the sphere (can be set to 1.0); A, ¢ = the longitude and latitude values,
R
respectively; and X, y = the plotting coordinates of the cylindrical equidistant projection. To begin calculating the Winkel Tripel projections using Equations 3 and 4, set the value of ¢. (i.e., the standard parallel) to 50°28' The general plotting formulas for the Aitoffprojection are given by Equations 5 through 10 (Snyder and Voxland 1989, p. 232). The value ofD in Equation 5 needs to be determined before proceeding with Equations 6 through 10. D = arccos[cos~
180
* cos «
1..-1..0 )/2)]
(5)
For all D values not equal to zero, values of C must be determined using Equation 8. IfD ~ 0; C == sin ~ 1 sin D
(8)
Once C is calculated, use Equations 9 and 10 to solve for values of X and Y, respectively. X == 2R D (1 Y==(RDC)
(9)
C2)1/2
(10)
where: D, C = solved by Equations 5 and 8, respectively; Ao = the central meridian; R = the radius of the sphere (can be set to 1.0); A, ¢ = longitude and latitude values, respectively; and X, Y = plotting coordinates for the Aitoff projection. If the quantity [COS0 * cos ( ( A-Ao )/2)]from Equation 5 equals 1, then the inverse cosine of 1 equals 0 and D = O. IfD = 0, use Equations 6 and 7 to set X = 0 and Y = 0 (i.e., defining the center of the projection). For all D ~ 0, use Equation 8 to solve for values of C. Once C is calculated, input values R, D, and C into Equations 9 and 10, and solve for X and Y
Implementation in Visual Basic Equations 1 through 8 can be directly translated into Visual Basic code. The cylindrical equidistant Cartography and Geographic Information
Science
equations are converted first. Next, the equations for the Aitoff are translated and then the equations for the Winkel Tripel are developed. Equations 3 and 4, which are used to calculate the cylindrical equidistant, can be translated into Equations 11 and 12: CylEquiDist_Plot_X(i)= 1.0*(Long_Rad(i)entralMeridian) * Cos (0.8808094)
Downloaded by [Penn State University] at 10:51 14 September 2015
(11)
CyIEquiDist]lot_Y(i) = 1.0 * Lat_Rad(i) (12) where: Long_ Rad(i), Lat_Rad(i) = individual longitude and latitude values expressed in radians; i = counter used to keep track of each pair of latitude and longitude values; CylEquiDist ]lot_ X(i) and CylEquiDist ]lot_ Y(i) = the cartesian plotting coordinates for the cylindrical equidistant projection; Quantity 0.8808094 refers to the location of the standard parallel of 50°28' (VisualBasic's trigonometric functions require all degree values to be expressed in radians); 1.0 = the radius of the sphere; and CentralMeridian = the value for the projection's central meridian. In the Wmkel Plot program, the default value for the central meridian is 0.0. However, the user interface allows the option to redefine the central meridian. Visual Basic has powerful graphics and flexible interface design capabilities, but it does have limitations when it comes to higher-order mathematical functions. Except for the inverse tangent function (i.e., Atan), Visual Basic does not have functions for such common inverse trigonometric functions as the inverse cosine, which is needed to solve part of the Aitoff projection (see Equation 5). Visual Basic does, however, provide various derived mathematical functions that can be used to obtain several inverse trigonometric functions. For instance, it provides a derived mathematical function for the inverse cosine shown in Equation 13 (Microsoft Visual Basic 1995, pp. 1063-4). Arccos(X)= Atn(-X/ Sqr(-X* X + 1» + 1.570796327 (13) where: X = the inverse cosine value that is to be calculated; and 1.570796327 = rr/2. Thus, the inverse cosine function which is used in Equation 5 as an initial step in calculating part of the Aitoff projection can be adapted to Visual Basic using Equation 13. Two steps must be taken to develop Equation 5 into 13. Step one involves setting up Equation 14 to solve for the quantity inside the brackets of Equation 5 (i.e., [cosl1l* cos 1.-1.0 )/2)]).
«
Vol. 27, NO.2
d(i) = (Cos(Lat_Rad(i))* Cos«Long_Rad(i) - Central Meridian) / 2» (14) where: Long_Rad(i) and Lat_Rad(i) = individual longitude and latitude values expressed in radians; i = a counter used to keep track of each pair of latitude and longitude values; and CentralMeridian = the central meridian for the Aitoff projection. Once the value of d(i) is solved, step two involves substituting this value for X in Equation 15 (i.e., the inverse cosine value that is to be calculated). Inverse_Cosine_D(i)= Atn(-d(i)/ Sqr(-d(i) * d(i) + 1» + 1.570796327 (I5) Mter calculating Inverse_Cosine_D(i) for each Lat_ Rad(i) and Long_ Rad(i), a check of the value of Inverse_Cosine_D(i) must be made. IfInverse_Cosine_D(i) = 0.0, from Equation 13, both Aitoff]lot_ X(i) and Aitoff]lot_ Y(i)coordinates become 0.0 (Equations 16 and 17, respectively), the center of the projection. Aitoff]lot_X(i) = 0.0 (16) Aitoff]lot_Y(i) = 0.0 (17) where variables Aitoff]lot_X(i) and Aitoff_Plot_Y(i) are the cartesian coordinates for the Aitoff projection. For all other values of Inverse_Cosine _D(i) not equal to 0.0, solve for C(i) using Equation 18, (developed from Equation 8). C(i) = Sin(Lat_Rad(i» / Sin(Inverse_Cosine_D(i» (18) where: Lat_Rad(i) = the individual latitude value; and Inverse_Cosine _D(i) = the quantity solved for in Equation 15. Once the values of C(i) and D(i) have been found, the X and Y values for the Aitoff projection can be calculated. The placement of the central meridian impacts the value of Aitoff Plot X(i). Depending on the sign of the Long_Rad(i), the Aitoff Plot X(i) values are solved by Equation 19 or 20. If Long_Rad(i) is negative, the corresponding Aitoff_Plot_X(i) value becomes negative and is calculated from Equation 19. If Long_Rad(i) is positive, the corresponding Aitoff_ Plot_ X(i) value becomes positive and is calculated from Equation 20. Aitoff_Plot_X(i)= -(2 * 1.0* Inverse_Cosine_D(i) * Sqr(l - (C(i) 2») (19) Aitoff_Plot_X(i)= (2 * 1.0* Inverse_Cosine_D(i) * Sqr(l - (C(i) 2») (20) where: Aitoff_Plot_X(i) = the X coordinate for the Aitoff projection; 1.0= value used for the radius of the sphere; Inverse_Cosine_D(i) = calculated from Equation 13; A
A
181
. '. ..
x
"~::::8A